Patient samples
The DZNE Clinical Registry Study of Neurodegenerative Diseases (DESCRIBE) cohort is a multicentric, longitudinal observational study conducted by the German Center for Neurodegenerative Diseases (DZNE) and its clinical sites. It recruits patients with different neurodegenerative conditions, including ALS, bvFTD and PSP. Recruitment of these patients is described in more detail below. The multicenter, longitudinal Degeneration Controls and Relatives cohort (DANCER) serves to provide healthy controls for all DESCRIBE subcohorts. After written informed consent (University of Bonn Ethics Board statement 311/14) all participants undergo baseline and annual follow-up visits with clinical and neurological examination, cognitive assessments, 3T magnetic resonance imaging (MRI), blood and CSF sampling following identical standard operating procedures (SOPs). Patients with Alzheimer’s Disease (AD) dementia were recruited as part of the DESCRIBE cohort, following the National Institutes of Aging- Alzheimer’s Association (NIA-AA) diagnosis criteria90 and confirmed by positive CSF amyloid-beta, total Tau and p-Tau181 status.
The DESCRIBE ALS cohort
ALS patients were diagnosed according to the revised El-Escorial-Criteria91. Different motor phenotypes of ALS were classified as classical ALS, progressive bulbar paresis, flail arm, flail leg, progressive muscular atrophy (PMA), primary lateral sclerosis (PLS) or genetic ALS. Participants were clinically characterized using the Amyotrophic Lateral Sclerosis Functional Rating Scale-revised (ALS-FRS-R)92. The Edinburgh Cognitive and Behavioral ALS Screen (ECAS)93 served as an additional test to identify cognitive and behavioral impairment. ALS patients with cognitive impairment (ALSci), ALS with behavioral impairment (ALSbi), ALS with cognitive and behavioral impairment (ALScbi) and ALS with frontotemporal dementia (ALS-FTD) following the Strong criteria94 and genetic ALS with a pathogenic FTD mutation, additionally underwent the assessments of the DESCRIBE FTD cohort (see below).
The DESCRIBE FTD cohort
Patients with bvFTD were diagnosed according to the revised Rascovsky criteria95 by an experienced multidisciplinary team of neurologists, psychiatrists and neuropsychologists and under consideration of MRI images and CSF data, when available. Neuropsychological assessments included Mini Mental State Examination Test (MMSE), the Montreal Cognitive Assessment (MoCA)41, Free and Cued Selective Reminding Test (FCSRT)96, the Neuropsychological battery of the Consortium to Establish a Registry for Alzheimer’s Disease (CERAD) Plus test97 including Trail Making Tests A and B and the mini-Social cognition & Emotional Assessment (Mini-SEA)98 test. Psychiatric scales included Geriatric Depression Scale (GDS)99, the brief questionnaire of the Neuropsychiatric Interview (NPI-Q)53, and the functional scales CDR-SB, CDR plus NACC FTLD, Functional Activities Questionnaire (FAQ)50, and a modification of the revised Cambridge Behavior Inventory (CBI-R)54, the CBI-M.
Patients with semantic variant PPA (svPPA) were diagnosed according to Gordon-Tempini criteria100. Baseline assessment of patients with PPA additionally included a modified version of the Camel and Cactus test101, the visual form of the Sentence Comprehension Test (SECT-V)102, the Sentence Repetition Test from the Aachen Aphasia Test103, hierarchical word lists104 and the Repeat and Point Test105.
The DESCRIBE PSP cohort
The cohort design is summarized in106. Diagnosis of PSP was based on the National Institute of Neurological Disorders and Stroke and the Society for PSP (NIND-SPSP) criteria107 for participants recruited before 2017, and on the Movement Disorder Society (MDS-PSP) diagnostic criteria108 for participants recruited after 2017. Participants were clinically phenotyped by PSP rating scale (PSP-RS)42, PSP staging system (PSP-SS)109, PSP quality of life scale (PSP-QoL)48, PSP-clinical deficits scale (PSP-CDS)43, Schwab and England disability scale (SEADL)44, MDS-Unified Parkinson’s Disability Rating Scale (MDS-UPDRS) Part III46, Starkstein Apathy Scale (SAS)47, Clinical Global Impression Severity Scale (CGI-s)45, GDS99, and MoCA41.
The Healthy Control cohort DANCER
Healthy controls samples were obtained from the Degeneration Controls and Relatives cohort (DANCER) and included 71 participants who, based on neuropsychological testing, neurological and psychiatric examination, do not suffer from a neurodegenerative disease. Participants additionally underwent MR imaging. The neuropsychological test battery follows the same protocol and includes all assessments as the one used for participants of the DESCRIBE FTD cohort. Participants undergo an annual follow-up as well as genetic testing at baseline (see below). Relatives with a known pathogenic FTD-ALS mutation were excluded as controls.
Genetics
All patients with a diagnosis of bvFTD, FTD-ALS, ALS with cognitive and or behavior impairment and all control subjects were tested for pathogenic C9orf72 hexanucleotide repeat expansions, for insertions or deletions in MAPT and GRN genes by multiplex ligation-dependent probe amplification (MLPA) and for other protein-coding variants by whole exome sequencing. Specifically, expansions of the C9orf72 GGGGCC hexanucleotide repeat were detected by the AmplideX PCR/CE C9orf72 kit (Asuragen) with a cut-off value of 30 repeats defining pathologically expanded repeats. For detection of deletions or duplications in GRN and MAPT genes we employed the SALSA MLPA kit (MRC-Holland). Participants with ALS and PSP were not systematically screened for mutations as part of the DESCRIBE study protocol. Our study sample contained 37 mutation carriers, including 18 C9orf, 4 GRN, 3 MAPT, 4 VCP, 2 TBK1, 2 CHCHD10, 2 FUS, and 2 SOD-1 cases (Suppl. Table 10).
DZNE Brain Bank post-mortem cohort and neuropathological diagnosis
In the DZNE Brain Bank, autopsies and sampling of tissues for diagnostics and research is performed after written informed consent in accordance with local ethics review boards. Brain autopsies and neuropathological diagnosis were available for 31 participants of subcohort 2, consisting of 24 cases with a TDP-43 proteinopathy (ALS-TDP and FTLD-TDP, including 2 cases with TBK1 mutation), 5 cases with a Tau proteinopathy (PSP and FTLD-Tau including 1 case with MAPT mutation), as well as 1 ALS with a mutation in SOD-1, and 1 ALS case with a CHCHD10 mutation (Suppl. Table 11).
Neuropathological evaluation was performed for all cases on formalin fixed paraffin embedded tissue sections from 20 standardized neuroanatomical regions following guidelines for the assessment and diagnosis of neurodegenerative diseases including immunohistochemistry with antibodies against phosphorylated TDP-43 (clone 1D3110), phosphorylated tau (clone AT8, Thermo Fisher), α-synuclein (clone 4D6, Origene), and beta-Amyloid (clone 4G8, Covance). For all cases, assessment included reporting of Alzheimer’s disease neuropathological changes111 and presence/regional distribution of Lewy pathology112. Cases with FTLD-TDP were subclassified according to current criteria113.
Extracellular vesicle (EV) isolation from plasma and CSF
EVs were prepared from EDTA plasma as described in37. Briefly, 500 µL plasma was thawn on ice and subjected to serial centrifugation to isolate medium-sized and small extracellular vesicles (sEVs, mEVs). To remove cellular debris, plasma was centrifuged for 10 minutes at 4°C with 3,500g, and 2 times with 4,500g. The supernatant was subsequently centrifuged for 30 minutes with 10,000g at 4°C. The resulting pellet (mEV fraction) was resuspended in 100 µl PBS, 1% CHAPS, whereas the supernatant was applied to size exclusion columns equilibrated with 10 mL of 20 mM HEPES buffer (pH 7.4) to isolate sEVs (qEVoriginal, 70 nm+; Izon Science Limited, Cambridge, MA). Using the Izon Automatic Fraction Collector (AFC) and by adding 20 mM HEPES buffer (pH 7.4), we eluted 24 fractions with a volume of 500 µL. As shown previously37, fractions 7–10 contain the highest EV concentrations without contamination by non-vesicular plasma proteins. We therefore pooled fractions 7–10 as the sEV fraction and subjected them to 4,000g centrifugation at 4°C in an Amicon Ultra centrifugal filter with a 3-kD cutoff (Merck Millipore, Darmstadt, Germany) to concentrate the sample. Subsequently, the volume was filled up with 20 mM HEPES to a final volume of 100 µl containing 1% CHAPS. Samples were stored at − 20°C until further analysis of Tau and TDP-43 content.
Western blotting
Western blotting was performed according to standard protocols using 10 or 12% SDS polyacrylamide gels, followed by transfer to polyvinylidene fluoride (PVDF) membranes (Millipore, Bedford, USA). PVDF membranes were blocked for 30 min in 4% w/v nonfat dried milk in TBS-Tween 0.5% v/v (TBS-T). Primary antibodies were incubated with the PVDF membrane overnight at 4°C, secondary antibodies for 1 hour at room temperature. Protein bands were visualized with ECL Western Blotting detection kit (GE Healthcare, Amersham, UK). The following antibodies were used:
(1) primary antibodies: anti-Calnexin (cat no. C4731, Sigma-Aldrich, Darmstadt, Germany, 1:2000 dilution), anti-Flotillin-2 (cat no. 610384, BD Biosciences, San Jose, CA, USA, 1:500 dilution); anti 3R Tau (RD3 anti 3R Tau antibody; catalog no. 05-803, Merck, dilution 1:500), anti 4R Tau (anti-4R Tau antibody; catalog no. ab218314, Abcam, dilution 1:500), and anti-TDP-43 antibody (catalog no. ab305694, Abcam, dilution 1:500). (2) secondary antibodies: HRP anti mouse IgG (Dako, 1:5000 dilution), HRP anti rabbit IgG (Dako, 1:5000 dilution).
Nanoparticle tracking analyzer (NTA)
NTA was performed with a NanoSight LM10 instrument and a LM14 viewing unit equipped with a 532-nm laser (NanoSight, Malvern Instruments Ltd, Malvern, UK). Samples were recorded in quadruplicates for 30 seconds and analyzed with the Nanoparticle Tracking Analysis (NTA) 2.3 software.
3R Tau immunoassay
Plasma sEV and mEV 3R Tau were measured in duplicates, 50 µl per well. Briefly, 96-well multi-array plates (Meso Scale Discovery, Gaithersburg, USA) were coated with RD3 anti 3R Tau antibody (catalog no. 05-803, Merck) after 1:600 dilution in dPBS overnight at 4°C. After three times washing with 0.05% Tween-20 in PBS (PBST), plates were blocked at room temperature with 150 µl blocking buffer per well for one hour under shaking at 350 rpm. Protein standards were prepared from 3R recombinant Tau (hTau23) by serial 2x dilution in blocking buffer (7,000 pg/ml highest standard to 109.38 pg/ml lowest standard ). Standards and samples were incubated at room temperature under 350 rpm shaking for two hours, followed by three times washing with PBST. Plates were then incubated for one hour at room temperature with the detection antibody, biotinylated anti- total tau HT7 (MN1000B, Thermo Fisher Scientific, epitope residues 159–163), in a 1:300 dilution in blocking buffer and under shaking at 350 rpm. After three times washing in PBST, 50 µl sulfo-tagged streptavidin (Meso Scale Discovery, Gaithersburg, USA) was added in a 1:300 dilution per well and incubated for one hour at room temperature in the dark and under shaking at 350 rpm. Plates were then washed three times and each well incubated with 150 µl 2×MSD Reading Buffer T (Meso Scale Discovery™, Gaithersburg, USA). Plates were then measured using a Sector Imager 6000 and the MSD Discovery Workbench 3.0 Data Analysis Toolbox (Meso Scale Discovery™, Gaithersburg, USA).
4R Tau immunoassay
Plasma sEV and mEV 4R Tau were measured in duplicates, 50 µl per well. Plates (Biotechne, catalog no: DY008) were incubated with capture antibody directed against 4R Tau (Abcam 4R antibody; [EPR21725] (ab218314)) in 100 µl of a 1:300 dilution in plate coating buffer (R&D DY008 kit) for 18 hours at room temperature and under constant shaking at 150 rpm. After three times washing in 1x washing buffer (R&D DY008 kit), blocking buffer (10x diluted in dPBS, R&D blocking buffer, containing 0.1x HAMA blocker (Abcam catalog no. ab193969)) was added to each well and incubated at room temperature for 1 hour under 350 rpm shaking. Wells were subsequently washed 3 times in washing buffer. 4R Tau standard was prepared from recombinant 4R Tau (htau40) by serial dilution in blocking buffer (standard 1 7,000 pg/ml to standard 7 109.48 pg/ml). Standard and samples were incubated for two hours and 20 minutes at room temperature under shaking at 350 rpm. After three times washing, wells were incubated under 350 rpm shaking for two hours at room temperature with detection antibody (biotinylated total tau HT7 (MN1000B), Thermo Fisher Scientific, 1:300 dilution in blocking buffer), followed by three times washing and incubation with streptavidin HRP (R&D systems) for 30 min at room temperature in the dark with 350 rpm shaking. Next, wells were washed three times and incubated for 15 min with substrate solution (R&D DY008 kit) and subsequently with stop solution. The plates were subsequently immediately measured using a BMG Fluostar ELISA reader.
TDP-43 SIMOA assay
TDP-43 levels were determined from plasma, plasma sEV and mEV fractions using the human TDP-43 Advantage kit on a single-molecule array (SIMOA) HD-X analyzer, software version 3.1 (Quanterix, Billerica, MA, USA) following the manufacturer’s instructions. As per product information, the assay was developed against TDP-43 amino acids 203–209 and the C-terminal region. Samples were thawn on ice and randomized on plates. Plasma samples were measured in duplicates, sEV and mEV samples as singlets, 50µl per well.
Plasma Neurofilament Light Chain (NfL) SIMOA assay
Plasma NfL concentrations were determined in duplicates, as previously described114, using the SIMOA NF-light Advantage kit on a Quanterix HD1 analyzer (Quanterix, Billerica, MA) by a blinded experimenter according to the manufacturer’s instructions.
Statistical analysis
Statistical analysis and data visualization were performed using Prism 7 (GraphPad Software Inc., La Jolla, CA, USA), IBM SPSS Statistics 21 (IBM Corporation, Armonk, NY, USA), and R (R Foundation for Statistical Computing, Institute for Statistics and Mathematics, Wirtschaftsuniversität Wien, Vienna, Austria) software programs. The statistical tests were two-tailed and values with p < 0.05 were considered significant.
Comparisons of marker levels were performed using Kruskal-Wallis tests followed by Dunn’s correction for multiple comparisons due to non-Gaussian distributions. Normal distribution assumption was assessed based on visual inspection of histograms and Kolmogorov-Smirnov tests.
To assess the link between EV marker and clinical scales as well as plasma NfL, Spearman correlations were used. To illustrate associations between plasma Nfl and plasma EV 3R/4R Tau ratio, plasma NfL and plasma EV /TDP-43, as well as plasma EV 3R/4R Tau and plasma EV TDP-43 (Fig. 1,2,4, Suppl. Figure 5,7,11,14), monotonic regression splines (using the "cgam" function from R package “splines”) were modeled. Notably, potential confounder (i.e. age, sex and disease duration) showed no influence on plasma biomarker levels (Suppl. Tables 3, 7). We therefore used the non-parametric tests described above with covariate adjustment to account for violations of normal distribution assumptions and non-linear relationships.
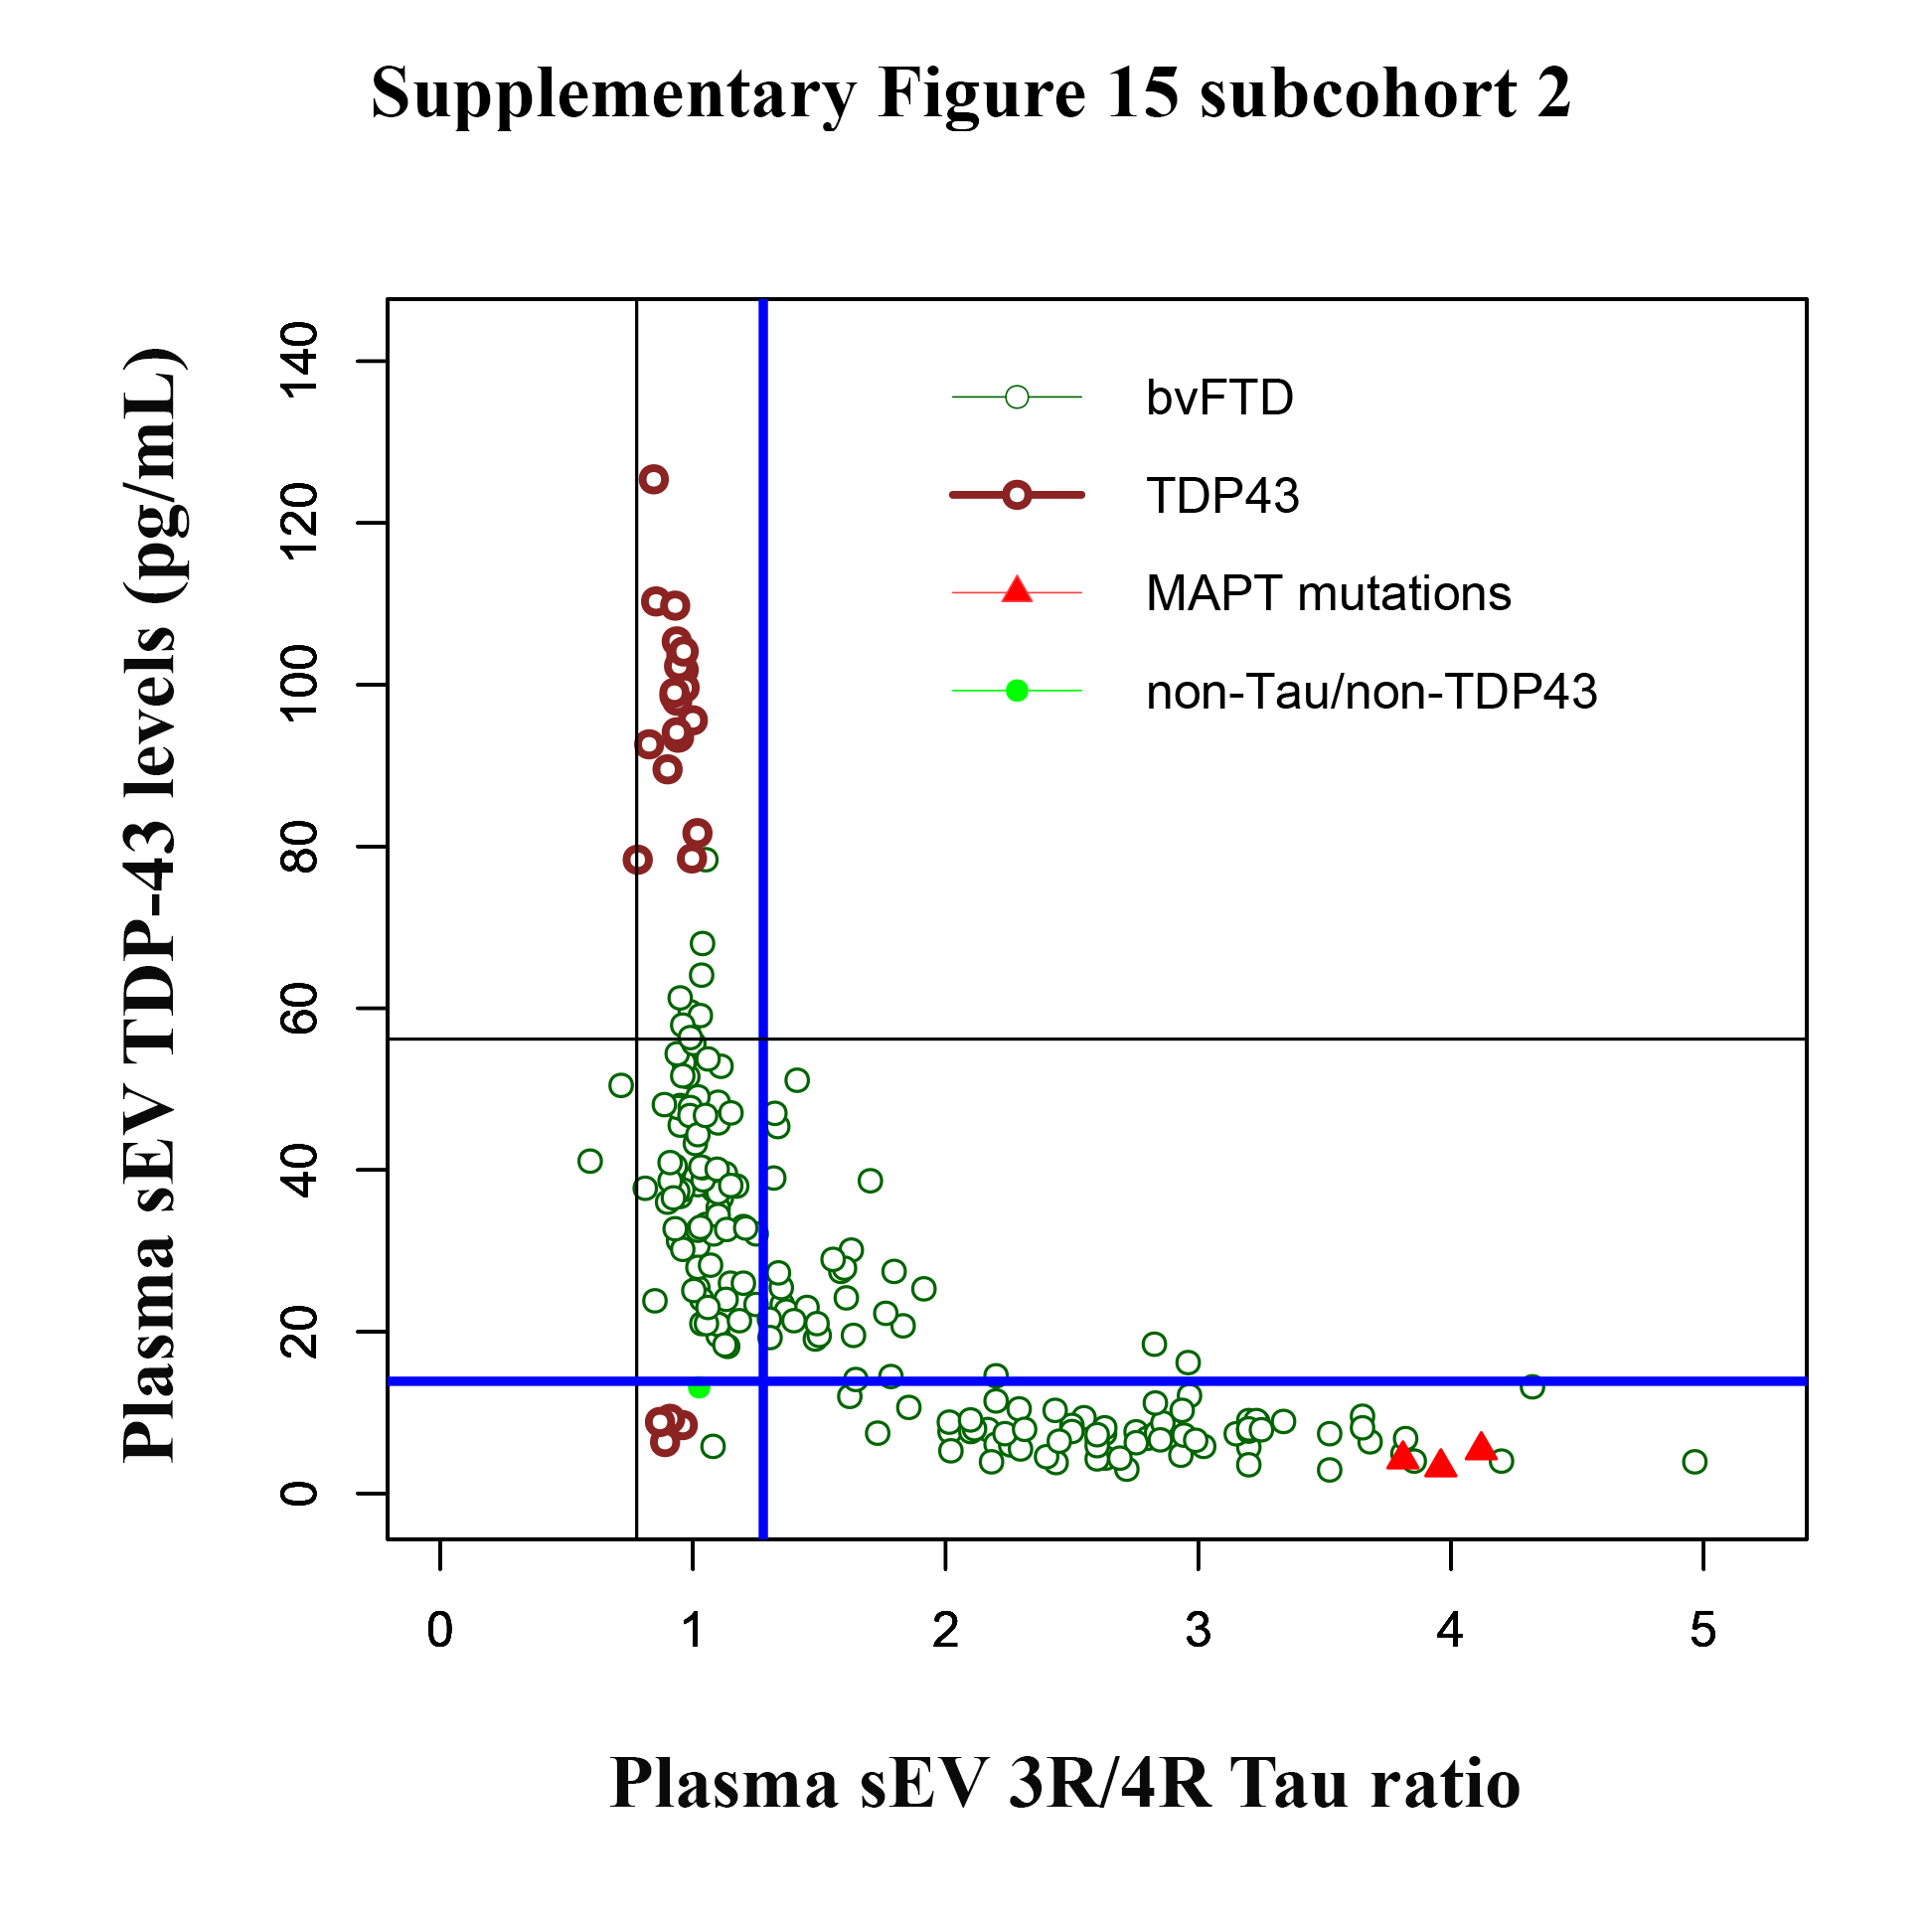
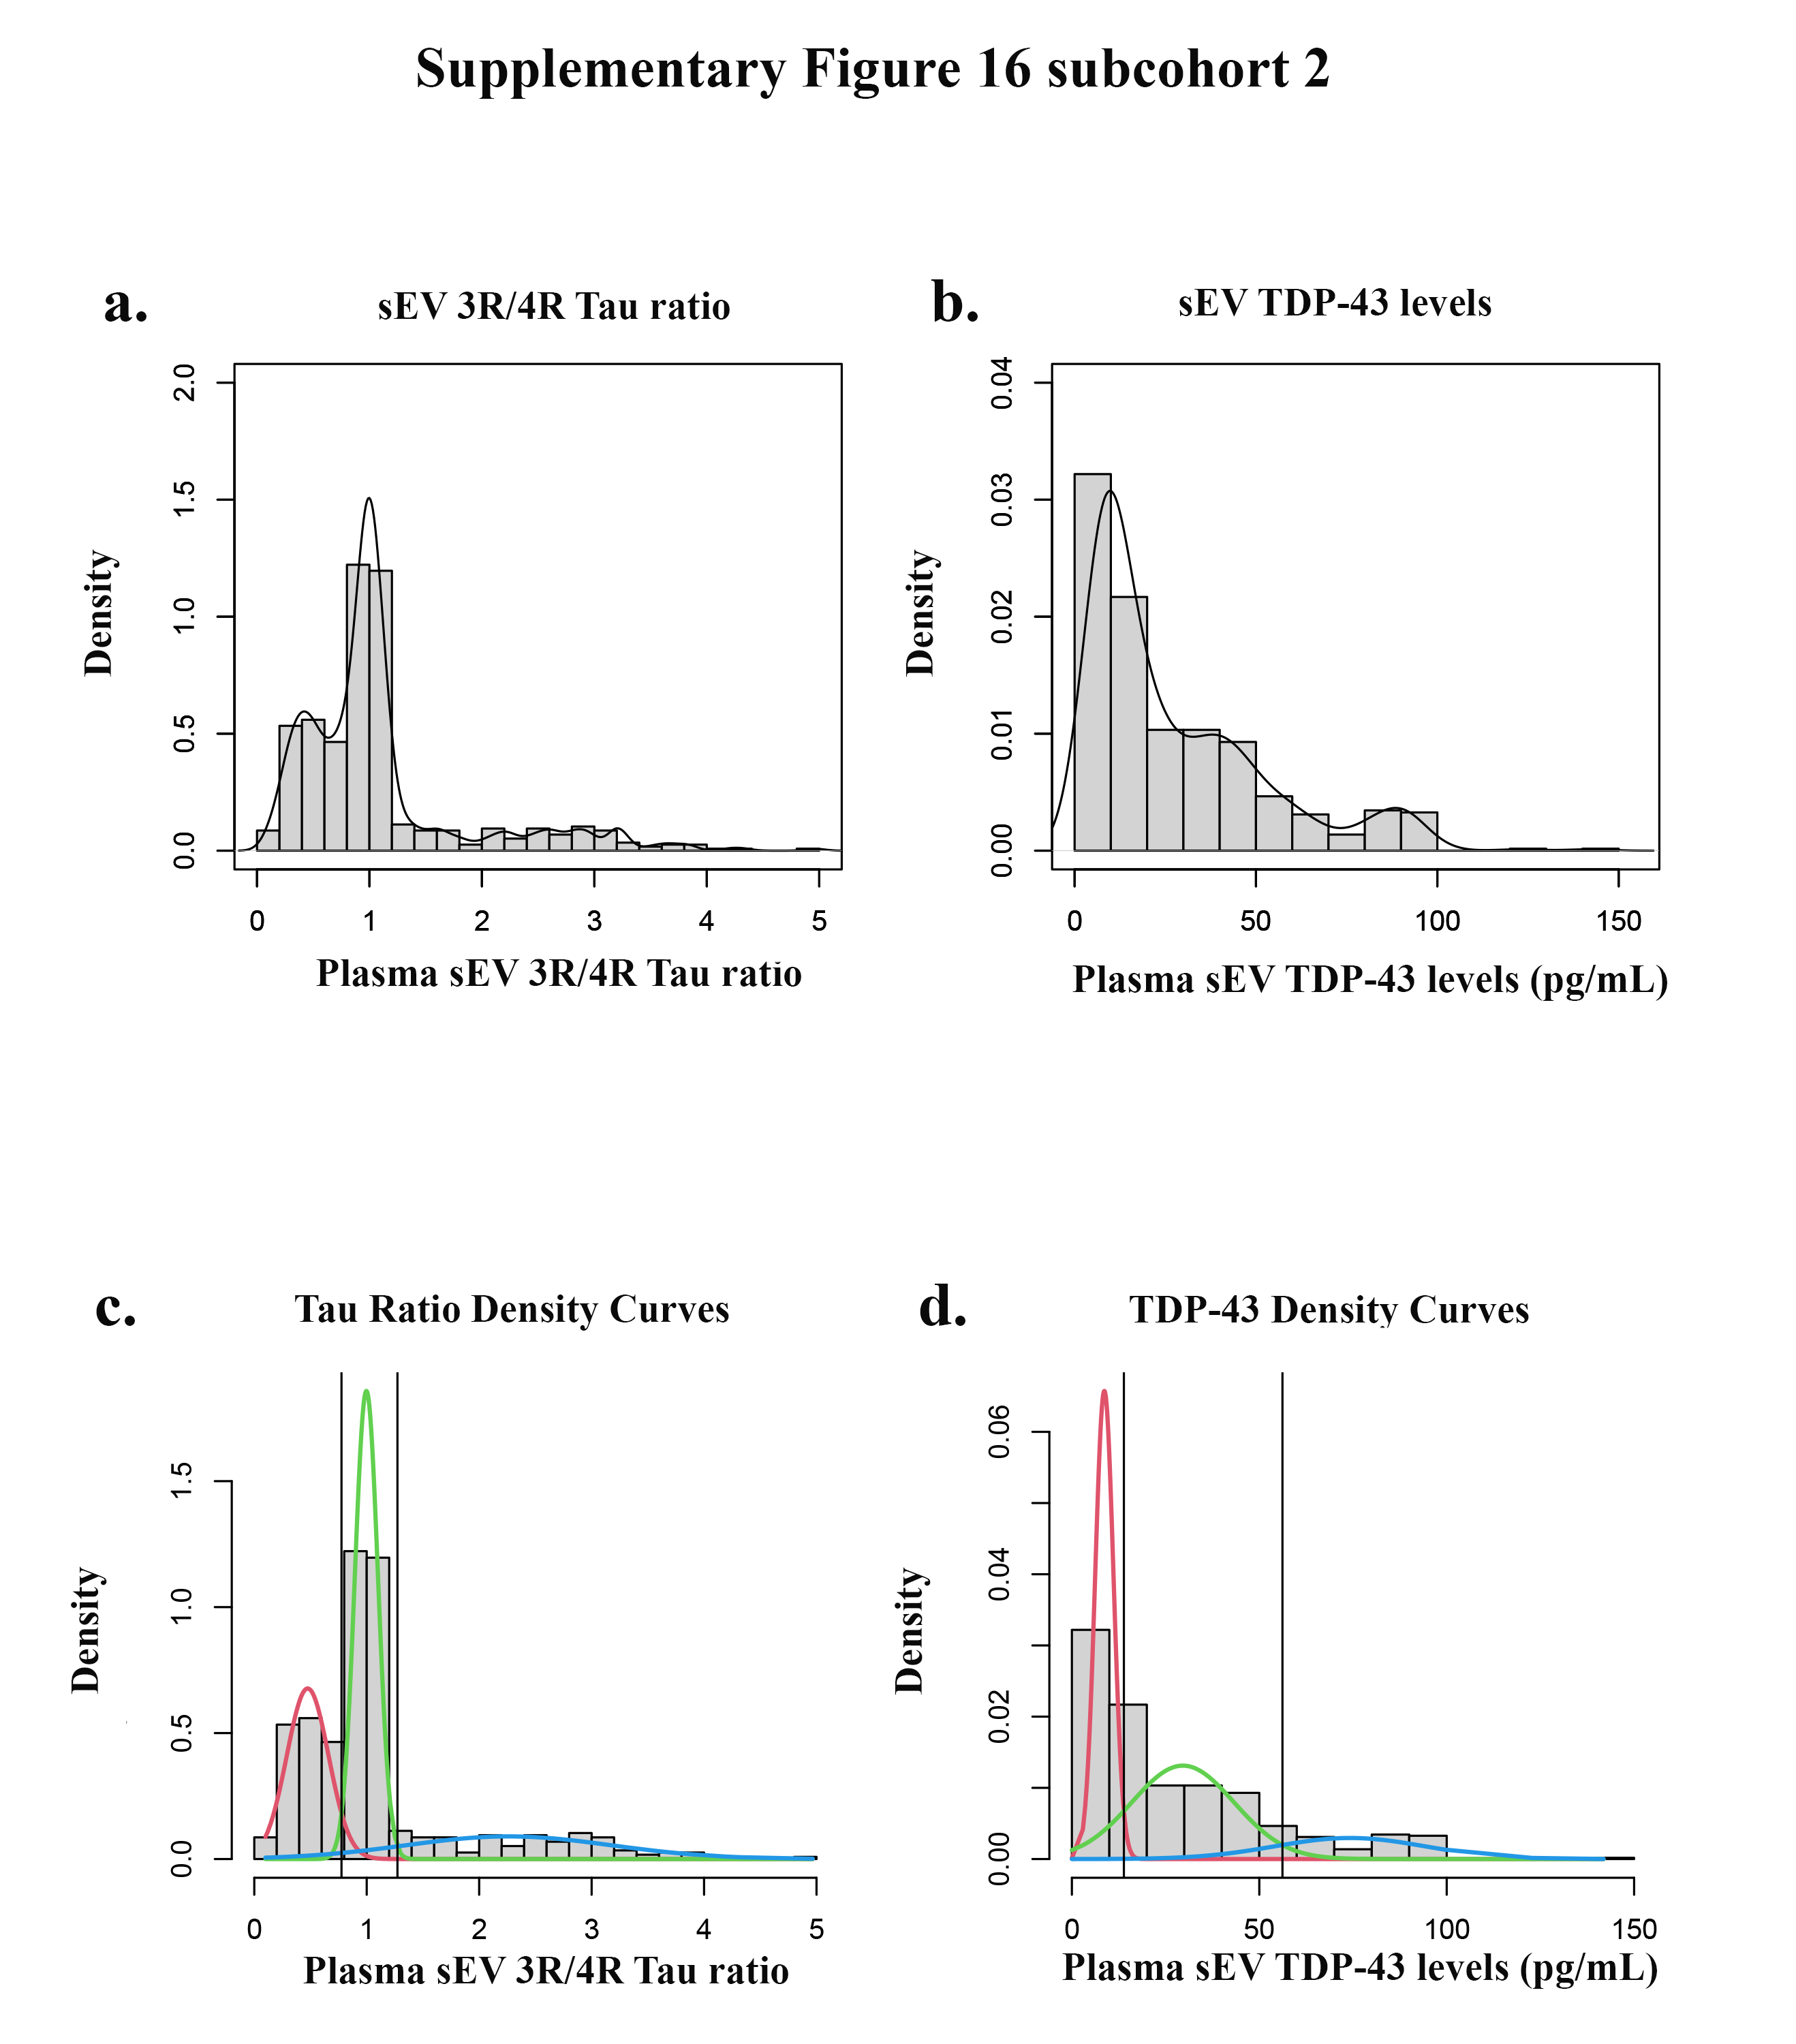
MedCalc software was used for computation and comparison of ROC curves (with the method of Hanley&McNeil115)(standard error (SE), 95% confidence interval (CI) for the difference, and p-value) as well as for calculation of sensitivity and specificity. The cut-off values of 3R/4R Tau ratio and TDP-43 levels were defined with Gaussian mixture modeling using the R statistical software program version 3.2.1 mix tools package as previously described by Bertens et al. 58. First, the R boot.comp function was used to determine the number of distributions that fitted best to the data. Next, we defined data-driven cut-offs as the point where the lines of fitted normal distributions crossed each other. Specifically, we derived three normal distributions (as suggested by bootstrapping) and determined the intersection of the middle normal distribution with the two more extreme distributions. We computed sensitivity and specificity based on the cut-offs of plasma sEV 3R/4R Tau ratio and TDP-43 levels as determined by mixture modelling.
For a description of the Modified version of the Cambridge Behavioural Inventory (CBI-M), Transmission electron Microscopy (TEM), Cell Culture & siRNA transfection, Immunoprecipitation-Mass Spectrometry (IP-MS) of Tau, Preparation of recombinant Tau protein, and Assay Validation please see Suppl. Methods.