3.1 Analysis of microarray data: Experiments were run with controls (n=10), cortisone treatment (n=10) and cortisone treatment after stress (n=10). Amygdala RNA samples, 14 days after 3 days of stress treatments, were extracted for Microarray analysis. Triplicate samples were used on a rat mitochondrial based cDNA chip. Misclassification rates were reduced in a method previously discussed[27]. The cDNA was spotted 3 times on the microarray. Plus, three chips were used for each prefrontal cortex sample, making for a total of 9 data points for one sample. Likewise, 90 datapoints were derived by multiplying 3 (probes) x 3 (experiments) x 10 (specimens). This redundancy allowed for confidence in the mRNA data used in the pathway analysis. Here we look at mitochondrial mRNA expression in the amygdala cortex after stress followed by cortisone therapy. 1500 mitochondrial genes were analyzed 14 days later electroshock induced stress. Average expression levels were measured for all experimental groups: stressed (n=10), cortisone (n=10) and no stress (n=10). A total of 540,000 microarray spots were analyzed from 40 microarray clips using 40 RNA samples. This generated 228 genes with differential expression profiles shown in Figure 1 and 2.
We identified a cluster and heat map of 228 genes with significantly expressed RNA derived from the four groups of DEGs in the amygdala complex of the 10 control rats, 10 corticosterone administrated, ten corticosterone with stress, and the 10 stressed rats (Fig. 2). The resulting dendrograms for all of these (Figures 1 and 2) genes and 40 amygdala complex specimens are classified as a control group from CON-01 to CON-10 and stressed group from STR-1 to STR-10, COR-1 to COR-10, and COR&STR in Fig.2 This analysis compares the gene expression levels between the various treated groups. Fig. 6 reveals Venn analysis of DEGs in three groups in comparison with control. Thus, Figure 5 shows total experimental data from (n=40) four group treatments with unsupervised clustering analysis. The amygdala tissue samples with the treatments are classified as CON: control; COR: corticosterone treated rats; STR: stress treated rats; S&C: stress and corticosterone treated rats.
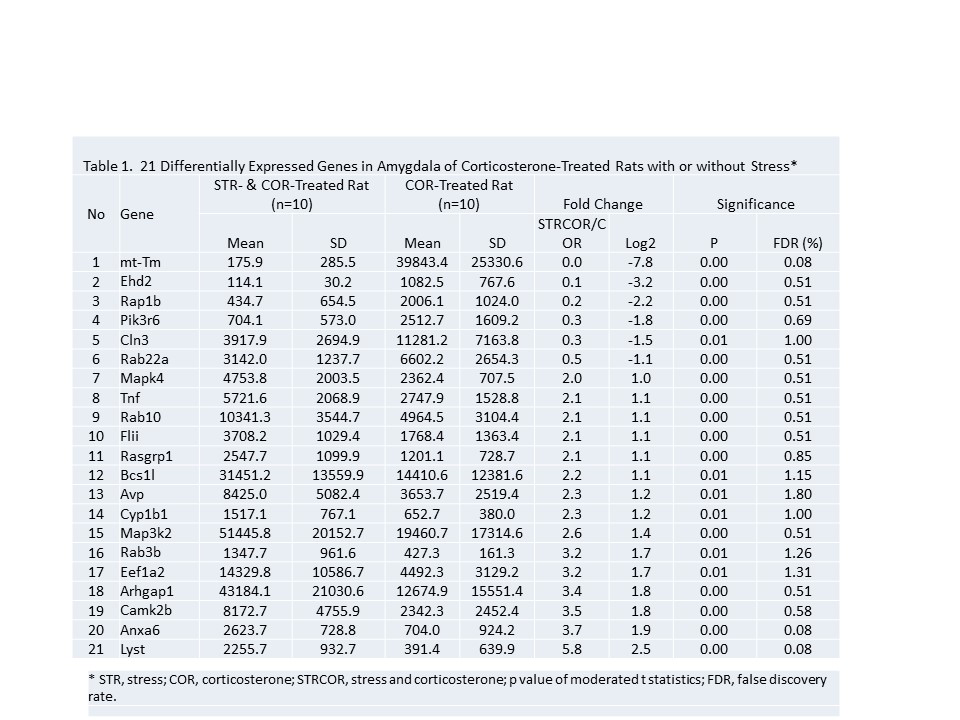
3.2 Pathway analysis of differentially expressed genes: Pathways containing protein products of the differentially expressed genes were determined using the IPA program. Table 1, illustrates the 21 DEGs regulated in the amygdala treated with three corticosterone injections. Table 1, illustrates the 21 DEGs in the CORT plus stress in comparison with CORT alone group in the amygdala cortex. These 21 DEGs illustrated related behavioral measurements showing mitigated stress response in the CORT plus stress group in comparison with the stress alone group in the amygdala complex. A high stringency algorithm was used, including fold changes and fold discovery rates (FDR) comparing stressed to controls (Table 1). The canonical tables include gene symbols, full names of genes listed in Genecards, fold change (ratio of stress and control, log2 of the ratio), p-volume, and FDR. (Fig. 1 and Fig 2.)
Molecular networks associated with mitochondrial functions were constructed based on differentially expressed genes from the amygdala complex associated with exaggerated fear (Jia et al.) . Canonical pathways analysis (Fig 7 and Fig 8, Table 1) indicated that six differentially expressed molecular networks are associated with metabolic molecules and neurotransmission, as well as translational factors in exaggerated fear (Fig 5, 6, 7,10) and in PTG (Fig 8,9,10,12,13 Table 1). These pathways include mitochondrial dysfunction involved in metabolism, ATP production, neuronal cell signaling, neurotransmitters, CNS and Alzheimer disease, Huntington disease, and Parkinson disease. Neuronal DEGs involved in cell signaling were evident in the amygdala under conditions of traumatic stress. Detailed molecular intervention of these differentially expressed molecular pathways and the symptoms of PTG such as resilience are noted (Fig 4, 5, 8, 9, 11, and 12). These results suggest potential molecular targets that can be used for pharmacological intervention following exposure to traumatic stress. CORT therapy and PTG associated molecular targets provide for resiliency after trauma exposure.
In the network analysis, the networks identified are presented as graphs indicating the molecular relationships between gene products. Gene products are represented as nodes, and a biological relationship between two nodes is indicated by a line. The intensity of the node color indicates the degree of up-regulation (red) or down-regulation (green). Gene products in uncolored notes were not identified as differentially expressed in our experiment but were integrated into the computationally generated networks based on the evidence stored in the IPA knowledge base, indicating relevance to this network.
Classification of DEGs in experiment with four groups of treatments
There are 228 DEGs derived from a total of 1500 genes printed on a microarray chip as shown in the methods. To understand which group of DEGs affect the changes in our behavioral measurement, we classified DEGs based on our four experimentally treated groups. We did Venn analysis shown in figure 5 that revealed 27 DEGs in common. To understand the expressional profile between stressed and CORT treated groups we further analyzed these two groups shown in figure 6. As shown, 42 DEGs out of 111 DEGs were expressed in the Venn analysis indicating that CORT DEG expression is independent of stress. Furthermore 13 DEGs were not affected by CORT treatment indicating that these 13 DEGs could be mediated by neuronal mechanisms or by other hormonal mechanisms other than CORT.
Canonical analysis of DEGs in stress and in CORT treatment.
Enzymes, phosphates, transmembrane receptors, cytokine channels, transcription factors, G-proteins coupled receptors, growth factors, and nuclear receptors are represented by a node shape in Figures 11, 12, and 13. Canonical pathways are displayed in Figure 7. Figure8 and Table 2. These pathways are from the IPA library that correlates most significantly to the input data set. Two parameters were used to determine the significance of the association between the data set and canonical pathway. Firstly, the ration of genes from the data set of the pathway divided by the total number of genes of the canonical pathway. Secondly, a P-value calculated using Fischer's exact test show that the probability of the association between genes of the data set and genes of the canonical pathway is due to chance alone. Node (gene) and line (gene relationship) are explained in Figure 11. The intensity of the node color-(red)) indicates the degree of up-regulation. Genes in uncolored nodes are not identified as differentially expressed genes in our experiment and are integrated into the computationally generated networks on the basis of the evidence stored in the IPA knowledge memory indicating relevance to this network. The node shape denotes enzymes, phosphatases, kinases, peptidases, G-protein coupled receptors, transmembrane receptors, cytokines, growth factors, ion channels, transporters, translation factors, nuclear receptors, and transcription factors.
Validation of the Rap1b and Arhgap1 Gene Expressions in the Amygdala (Microarray) and Blood (qRT-PCR).
Quantitative real-time PCR (qRT-PCR) was used to validate and to confirm gene expression results obtained from microarray analysis in our previously published results [33]. The relative mRNA levels of identified genes measured by qRT-PCR were in agreement with the data detected by microarray from 92 to 67% on five genes examined[33]. Previously, in an attempt to correlate biomarkers in peripheral tissue (blood) with the profile of dysregulated genes in the amygdala, Rap1b, and Arhgap1 were chosen. In the current study, upregulation of (Rap1b) and downregulation of (Arhgap1) expressions were observed in stressed amygdala and blood. Rap1b is of known relevance to abnormal fear response [34]. The results show that the relative mRNA levels of these genes measured by qRT-PCR (blood, n = 8, p < 0.01) were in agreement with the data detected by microarray (amygdala, n = 10, p < 0.01) experiments (shown in Figures 1A,B in Supplementary Material) [15].