Identification of TME Subtypes
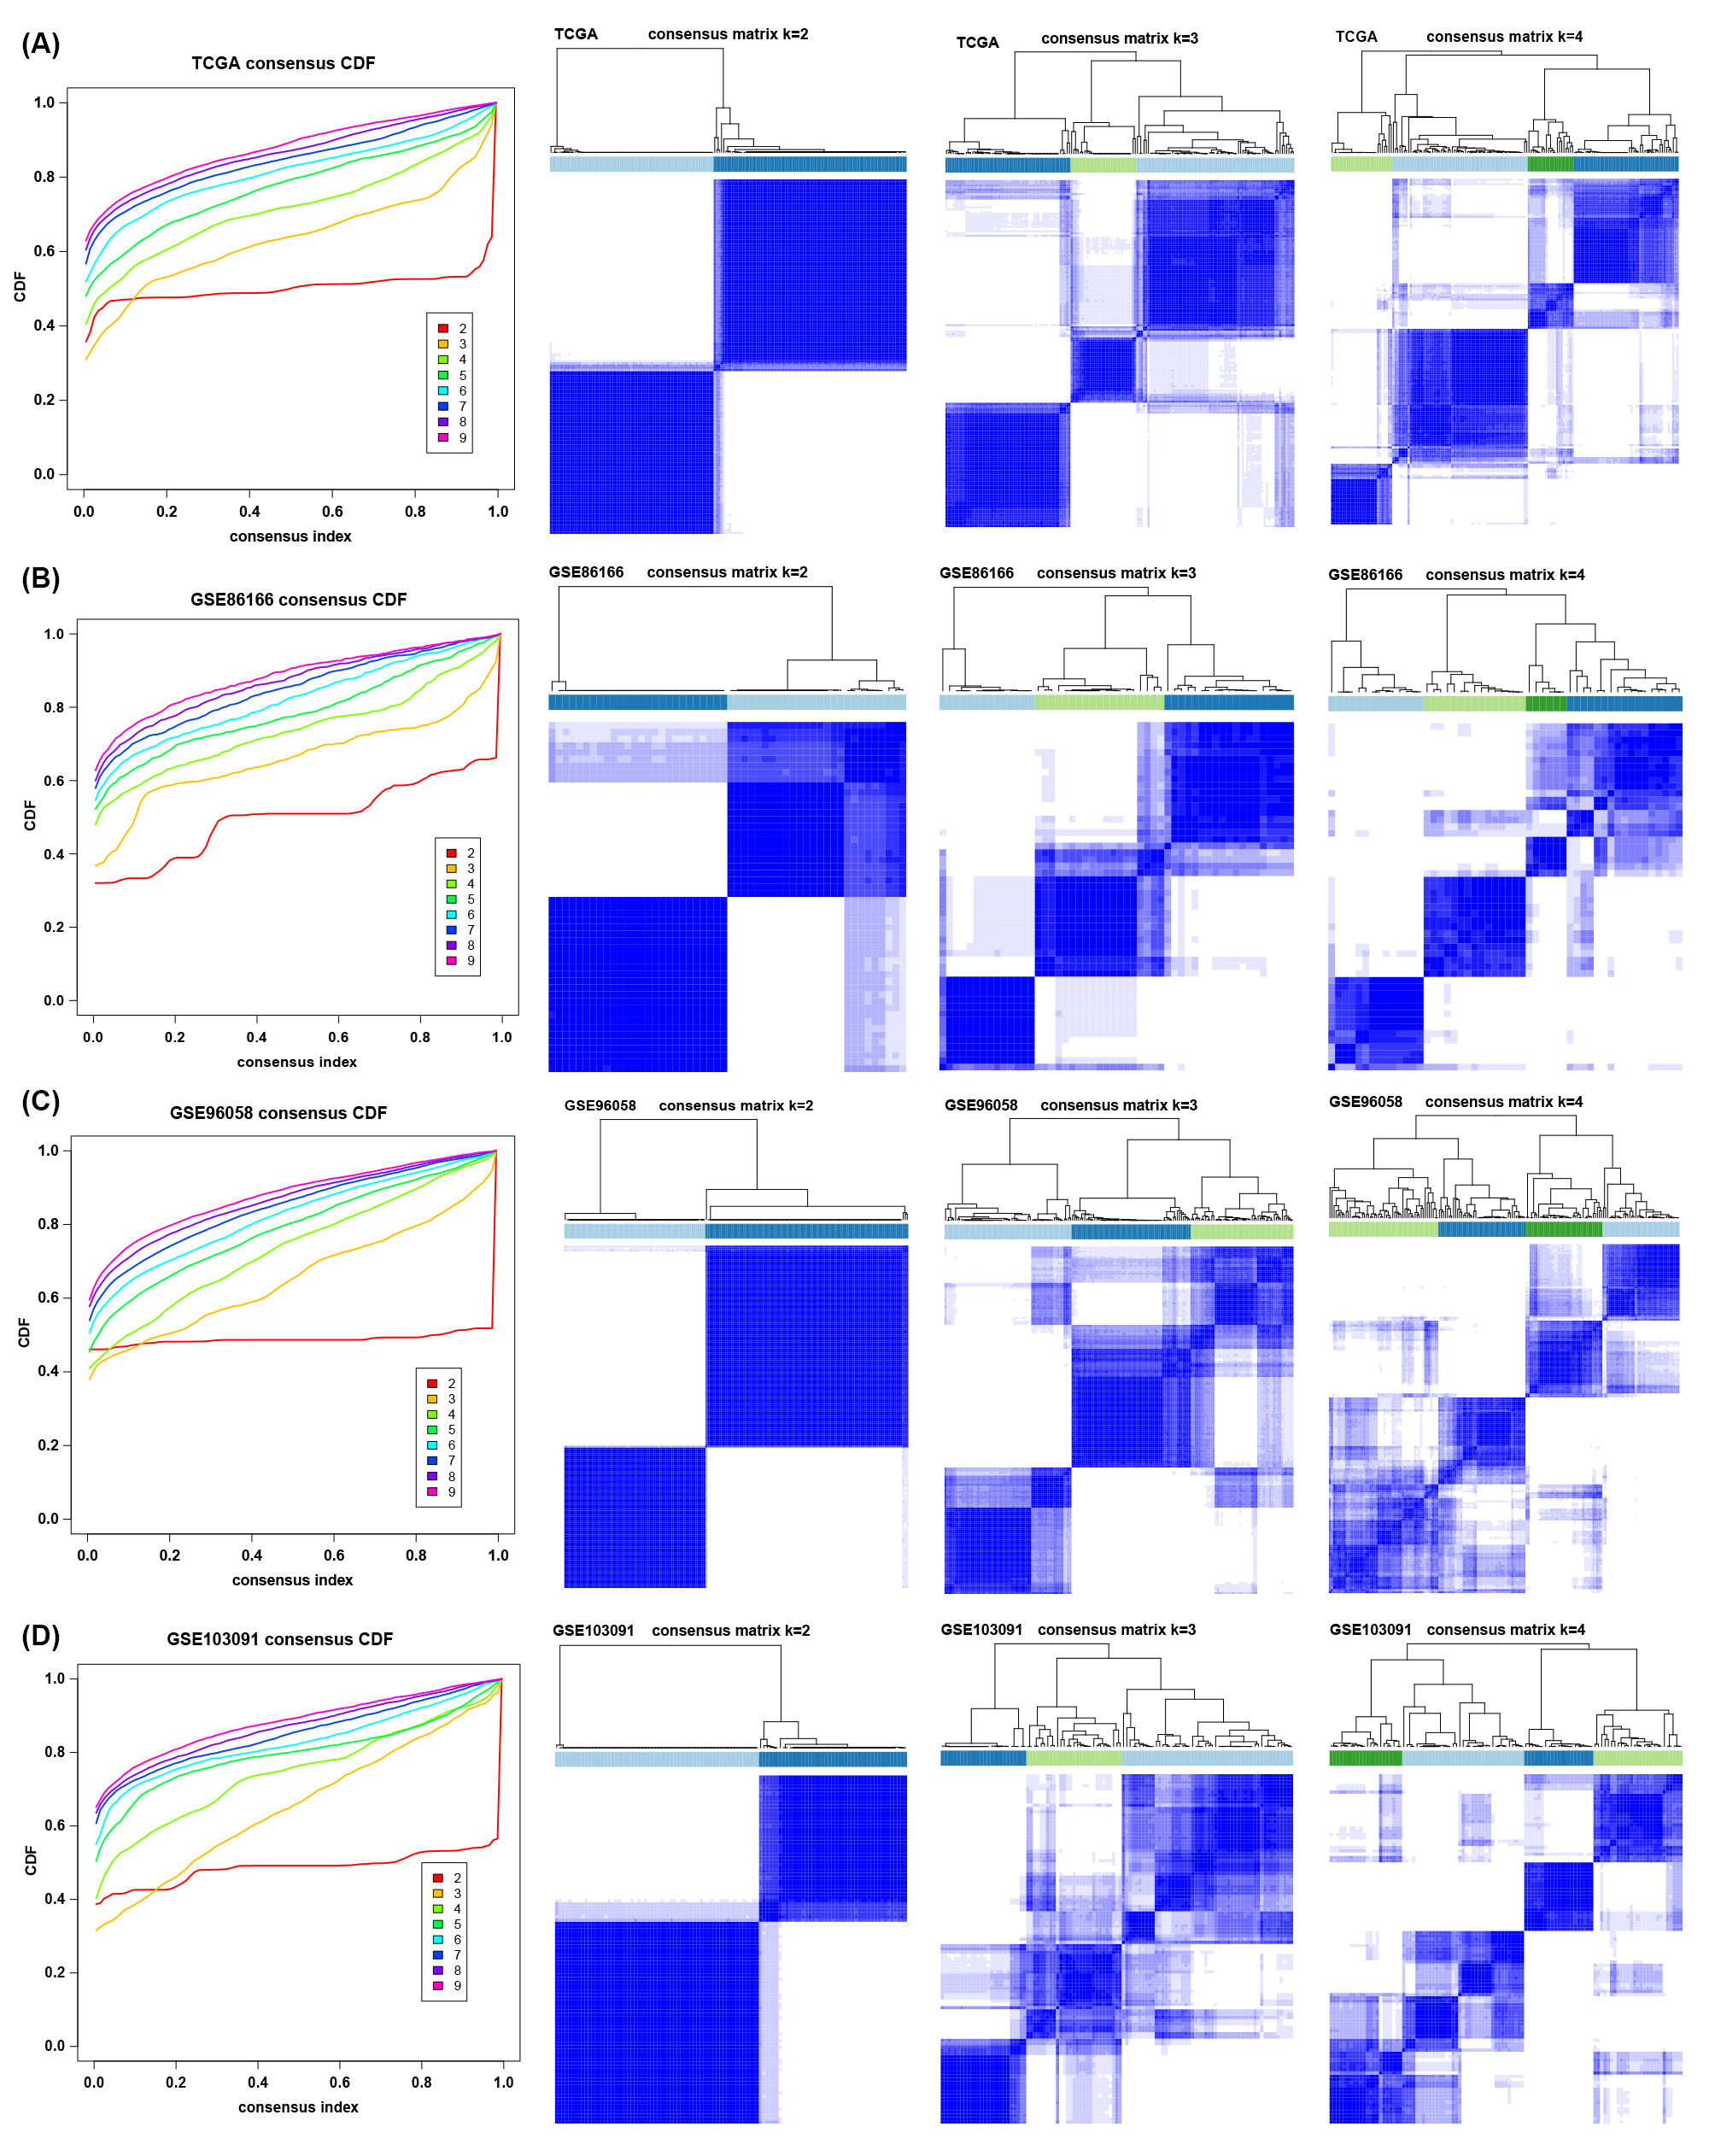
To explore the tumor microenvironment patterns in four independent TNBC cohorts, consensus cluster analysis was used to classify patients with TME conditions (Figure S2A-D). By integrating the clustering results of each dataset, two distinct TME subtypes were eventually identified using unsupervised clustering in each cohort, named subtypes 1 and 2 (Figure 1A). Here, we used immune cell signature 1 to perform cluster analysis. At the same time, we found that the infiltration of the levels of immune cells was significantly different using immune cell signature 2 in all four cohorts (Figure 1B). Among them, subtype 1 was enriched with immune cells compared with subtype 2, meaning that subtype 1 was an immune-activating subtype with higher immune cell infiltration levels, the same as the conception of a "hot" tumor. By the CIBERSORT algorithm, we found that some antitumor immune cells, such as CD8+ T cells, activated CD4+ T cells and M1-like macrophages, were higher in subtype 1. In contrast, tumor-associated immune cells, such as M2-like macrophages, were more elevated in subtype 2 (Figure 1C-D). Given these differences in the TME for these two subtypes, survival analysis showed that the overall survival of subtype 1 in the four cohorts was better than that of subtype 2 (Figure 1E).
Biological Function Analysis between TME subtypes
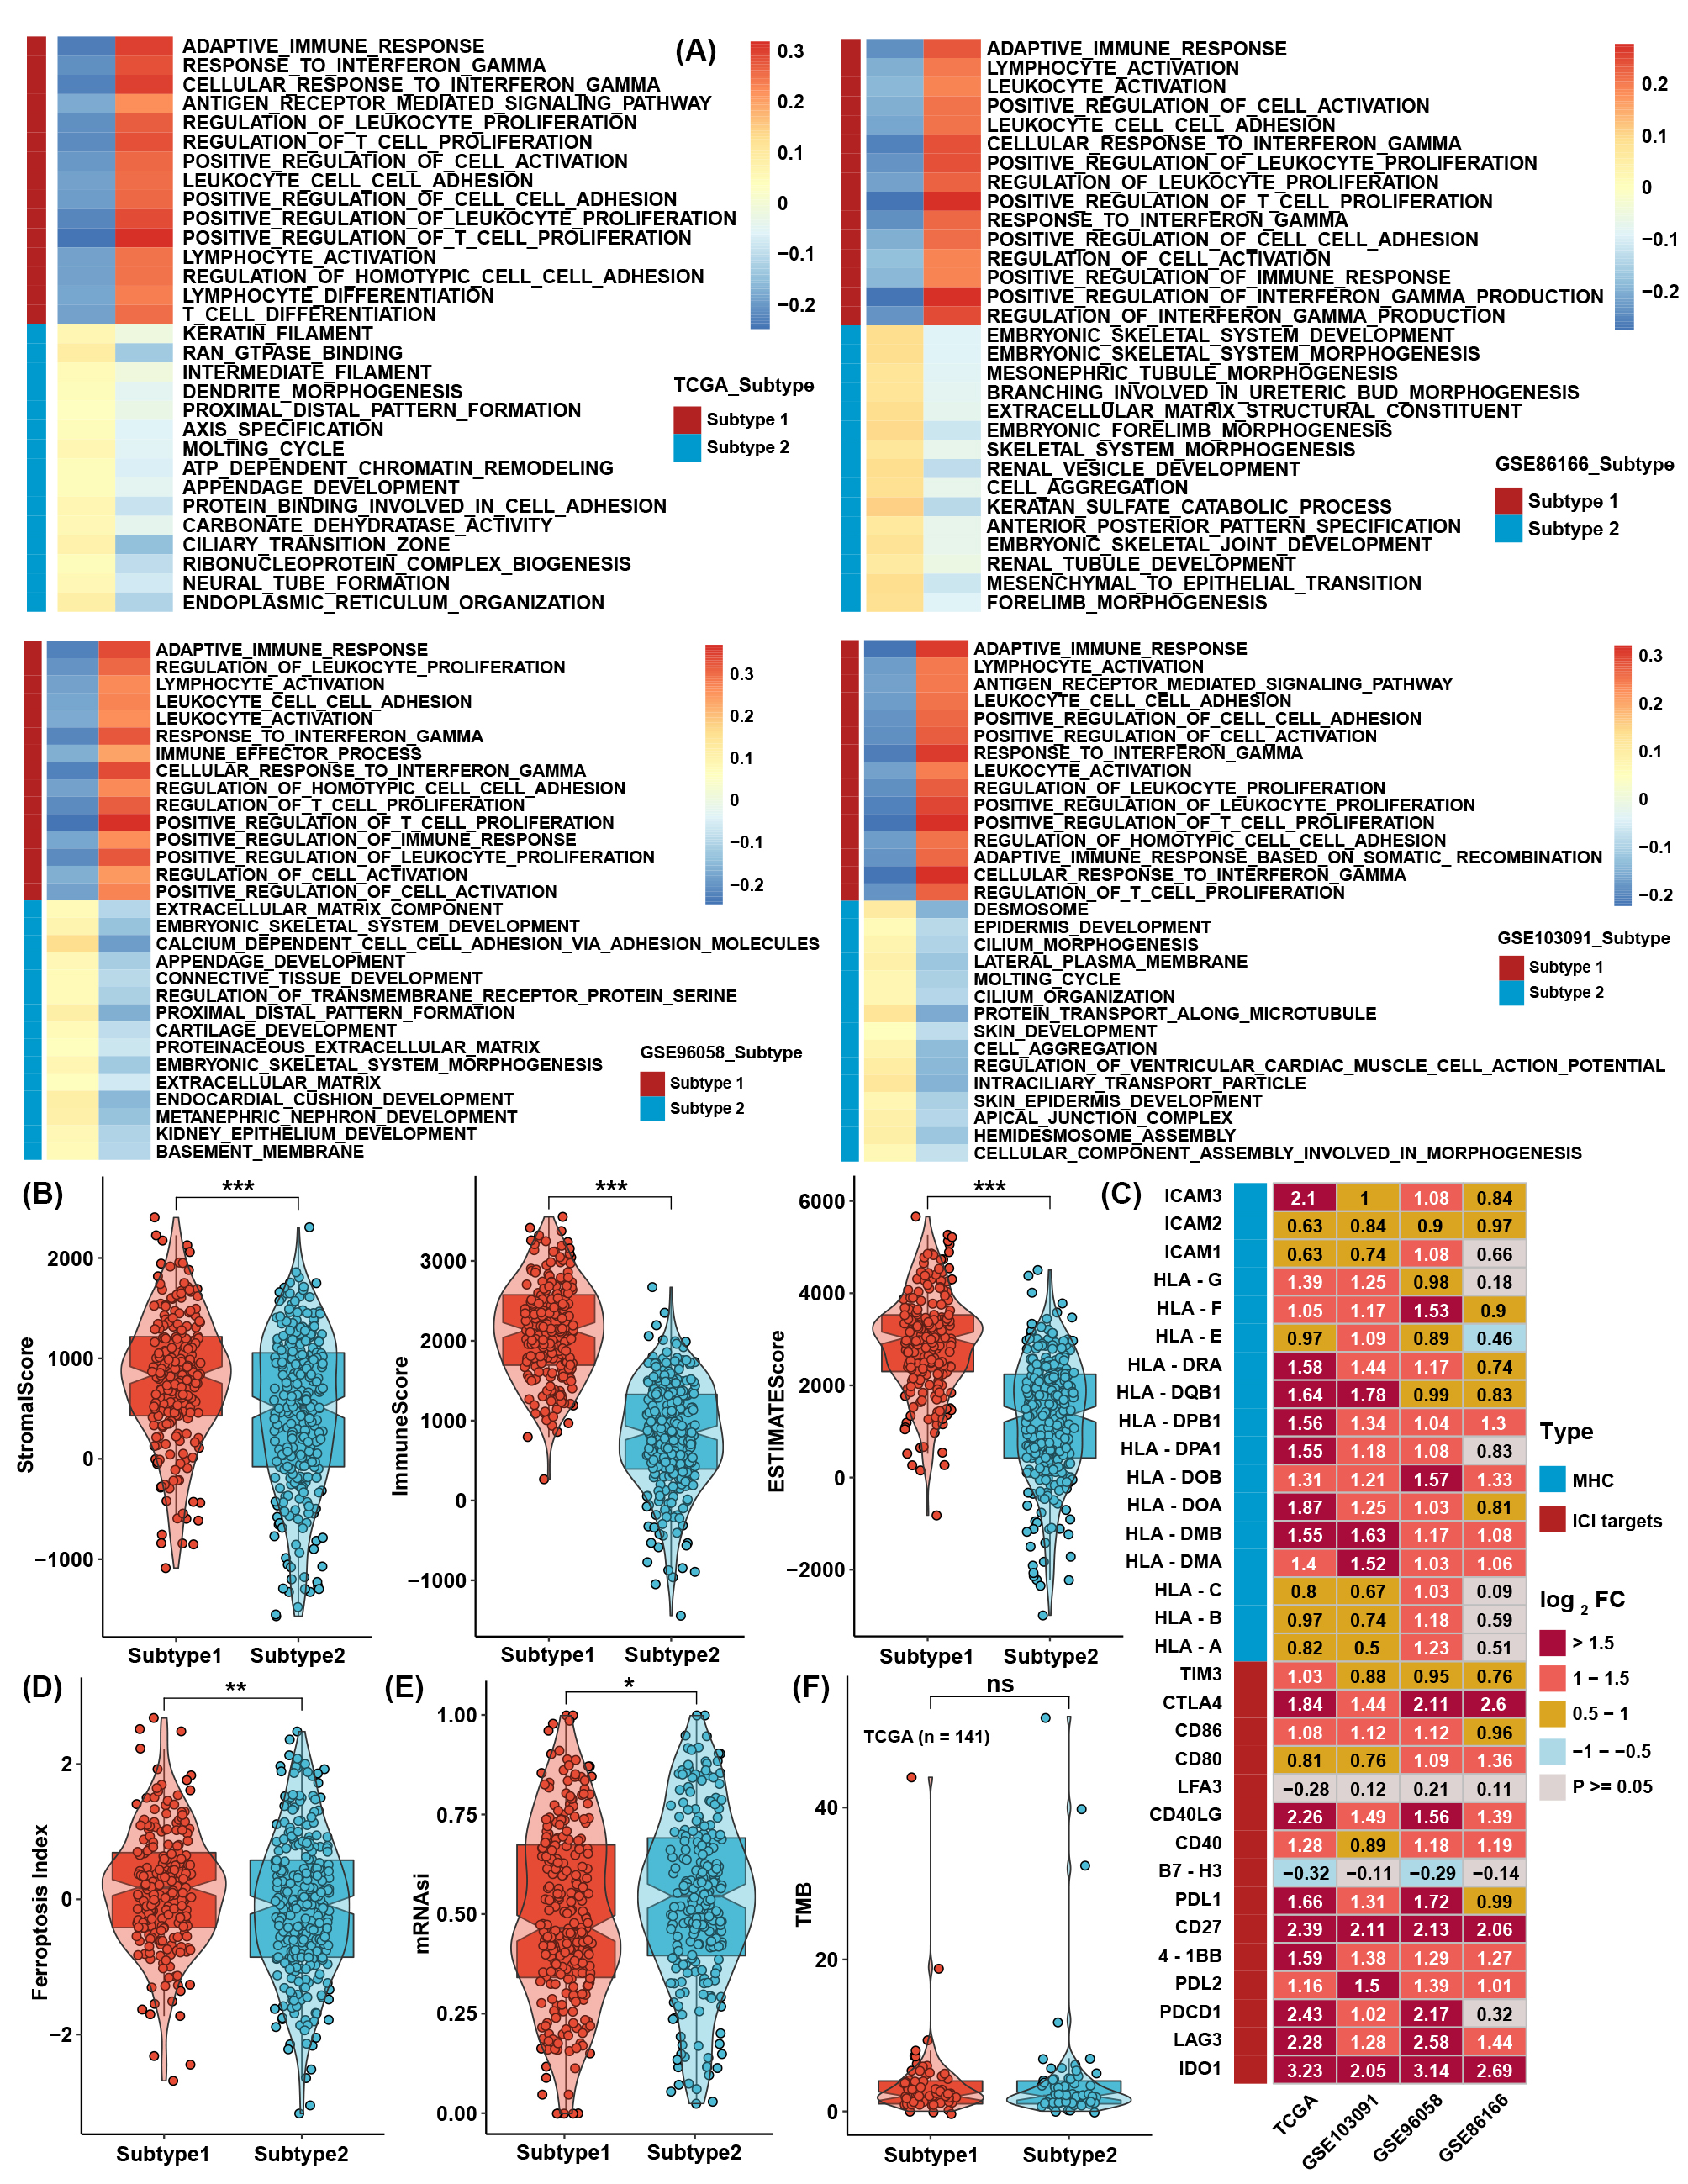
To further investigate the differences between the two TME subtypes, we considered analyzing the biological function variation in the conception of signaling pathways. GSVA showed that all immune-related pathways, such as the IL-2/STAT5, IL-6/STAT3, and interferon response pathways, were enriched in subtype 1, while the TGF-β-, NOTCH-, PI3K/AKT-, and EMT-related pathways were enriched in subtype 2 (Figure 2A-B). ssGSEA with curated signaling pathway signatures showed that the CD8 T effector- and immune checkpoint-related pathways were activated in subtype 1. In contrast, tumor progression-related pathways such as WNT and EMT were activated in subtype 2 (Figure 2C-D). Traditional GSEA was also conducted between subtypes in the four cohorts, which was consistent with the above results (Figure S3A). Using the ESTIMATE method, scores of stromal and immune cells were also higher in subtype 1 (Figure S3B). The expression levels of MHC molecules and immune checkpoint inhibitors (ICIs) are correlated with the activation of the antitumor immune response and the efficacy of immunotherapy. Most MHC molecules and ICIs were significantly different between the two subtypes and were especially higher in subtype 1 (Figure S3C). For a more comprehensive analysis of the two subtypes, we found that the ferroptosis index (FPI) and mRNA-based stemness index (mRNAsi) were higher in subtype 1 than in subtype 2. However, no significant difference was found in tumor mutation burden (TMB) (Figure S3D-F).
Moreover, based on ATAC-seq data from TCGA, differentially expressed peaks were identified between subtypes 1 and 2 (Figure 3E). GO analysis was processed on these differentially expressed peaks annotated by ChIPseeker, and the results showed that genes correlated with T-cell activation had higher chromatin activities in subtype 1. In comparison, genes correlated with the regulation of GTPase and cell morphogenesis possessed higher chromatin activities in subtype 2 (Figure 3F).
Generation of TME score and functional verification
To further investigate the underlying mechanisms between the two TME subtypes, differentially expressed gene (DEG) analysis was conducted in four TNBC cohorts. Taking the intersection of DEGs in four cohorts (Figure 3A-B), 236 TME-related DEGs were identified between TME subtypes, and all of them were upregulated in subtype 1 (Table S6; Figure 3C). GO analysis showed that DEGs were highly enriched in T-cell activation and cell adhesion pathways (Figure 3D). For further analysis, a continuous variable called the TME score by PCA was generated to quantify the different levels of TME in individual patients. The TME score could well reflect the differences in TME subtypes in TNBC cohorts, and the TME score was lower in subtype 1 (Figure S4A). Patients with low TME scores demonstrated a greater survival benefit than patients with high TME scores (Figure 3E-F). ssGSEA calculated with immune cell signature 1 showed that the infiltration levels of most immune cells were highly negatively associated with the TME score (Figure 3G), and ssGSEA calculated with immune cell signature 2 also verified that most of the immune cells were higher in the low TME score groups (Figure 3H). CIBERSORT analysis showed that as the TME score was reduced, the percentage of cytotoxic T cells increased (Figure 3I). GSVA showed that immune-related pathways, such as the IL-2/STAT5, IL-6/STAT3, and interferon response pathways, were negatively correlated with the TME score.
In contrast, glycolysis, the NOTCH signaling pathway, and protein secretion were positively correlated with the TME score (Figure S4B). ssGSEA with curated pathway signatures verified that the TME score was negatively linked with antigen processing machinery, CD8 T effector, and immune checkpoint and positively associated with WNT target pathways (Figure S4C). We show the genes involved in the above-curated pathway signatures with statistical significance in Figure S4D. Most of the genes involved in immune-related pathways were highly negatively correlated with the TME score. The stromal and immune scores calculated by ESTIMATE were undoubtedly negatively correlated with TME scores in all TNBC cohorts (Figure S4E). The low TME score group still had a higher FPI than the high TME score group, but the mRNAsi and TMB showed no significant differences (Figure S4F-H). Due to differences in FPI between TME subtypes and TME score groups, correlation analysis was conducted between TME score and the expression of ferroptosis-related genes. We found that the expression of TNFAIP3, SOCS1, IFNG, ATM, ALOX5, PML, ISCU, and GCH1 was significantly negatively correlated with TME scores in four TNBC cohorts (Figure S4I). The TME score showed no significant differences between the AJCC_T, AJCC_N, and stage groups, meaning that the TME score was a novel factor regardless of clinical traits (Figure S4J).
The role of the TME score in therapy efficacy
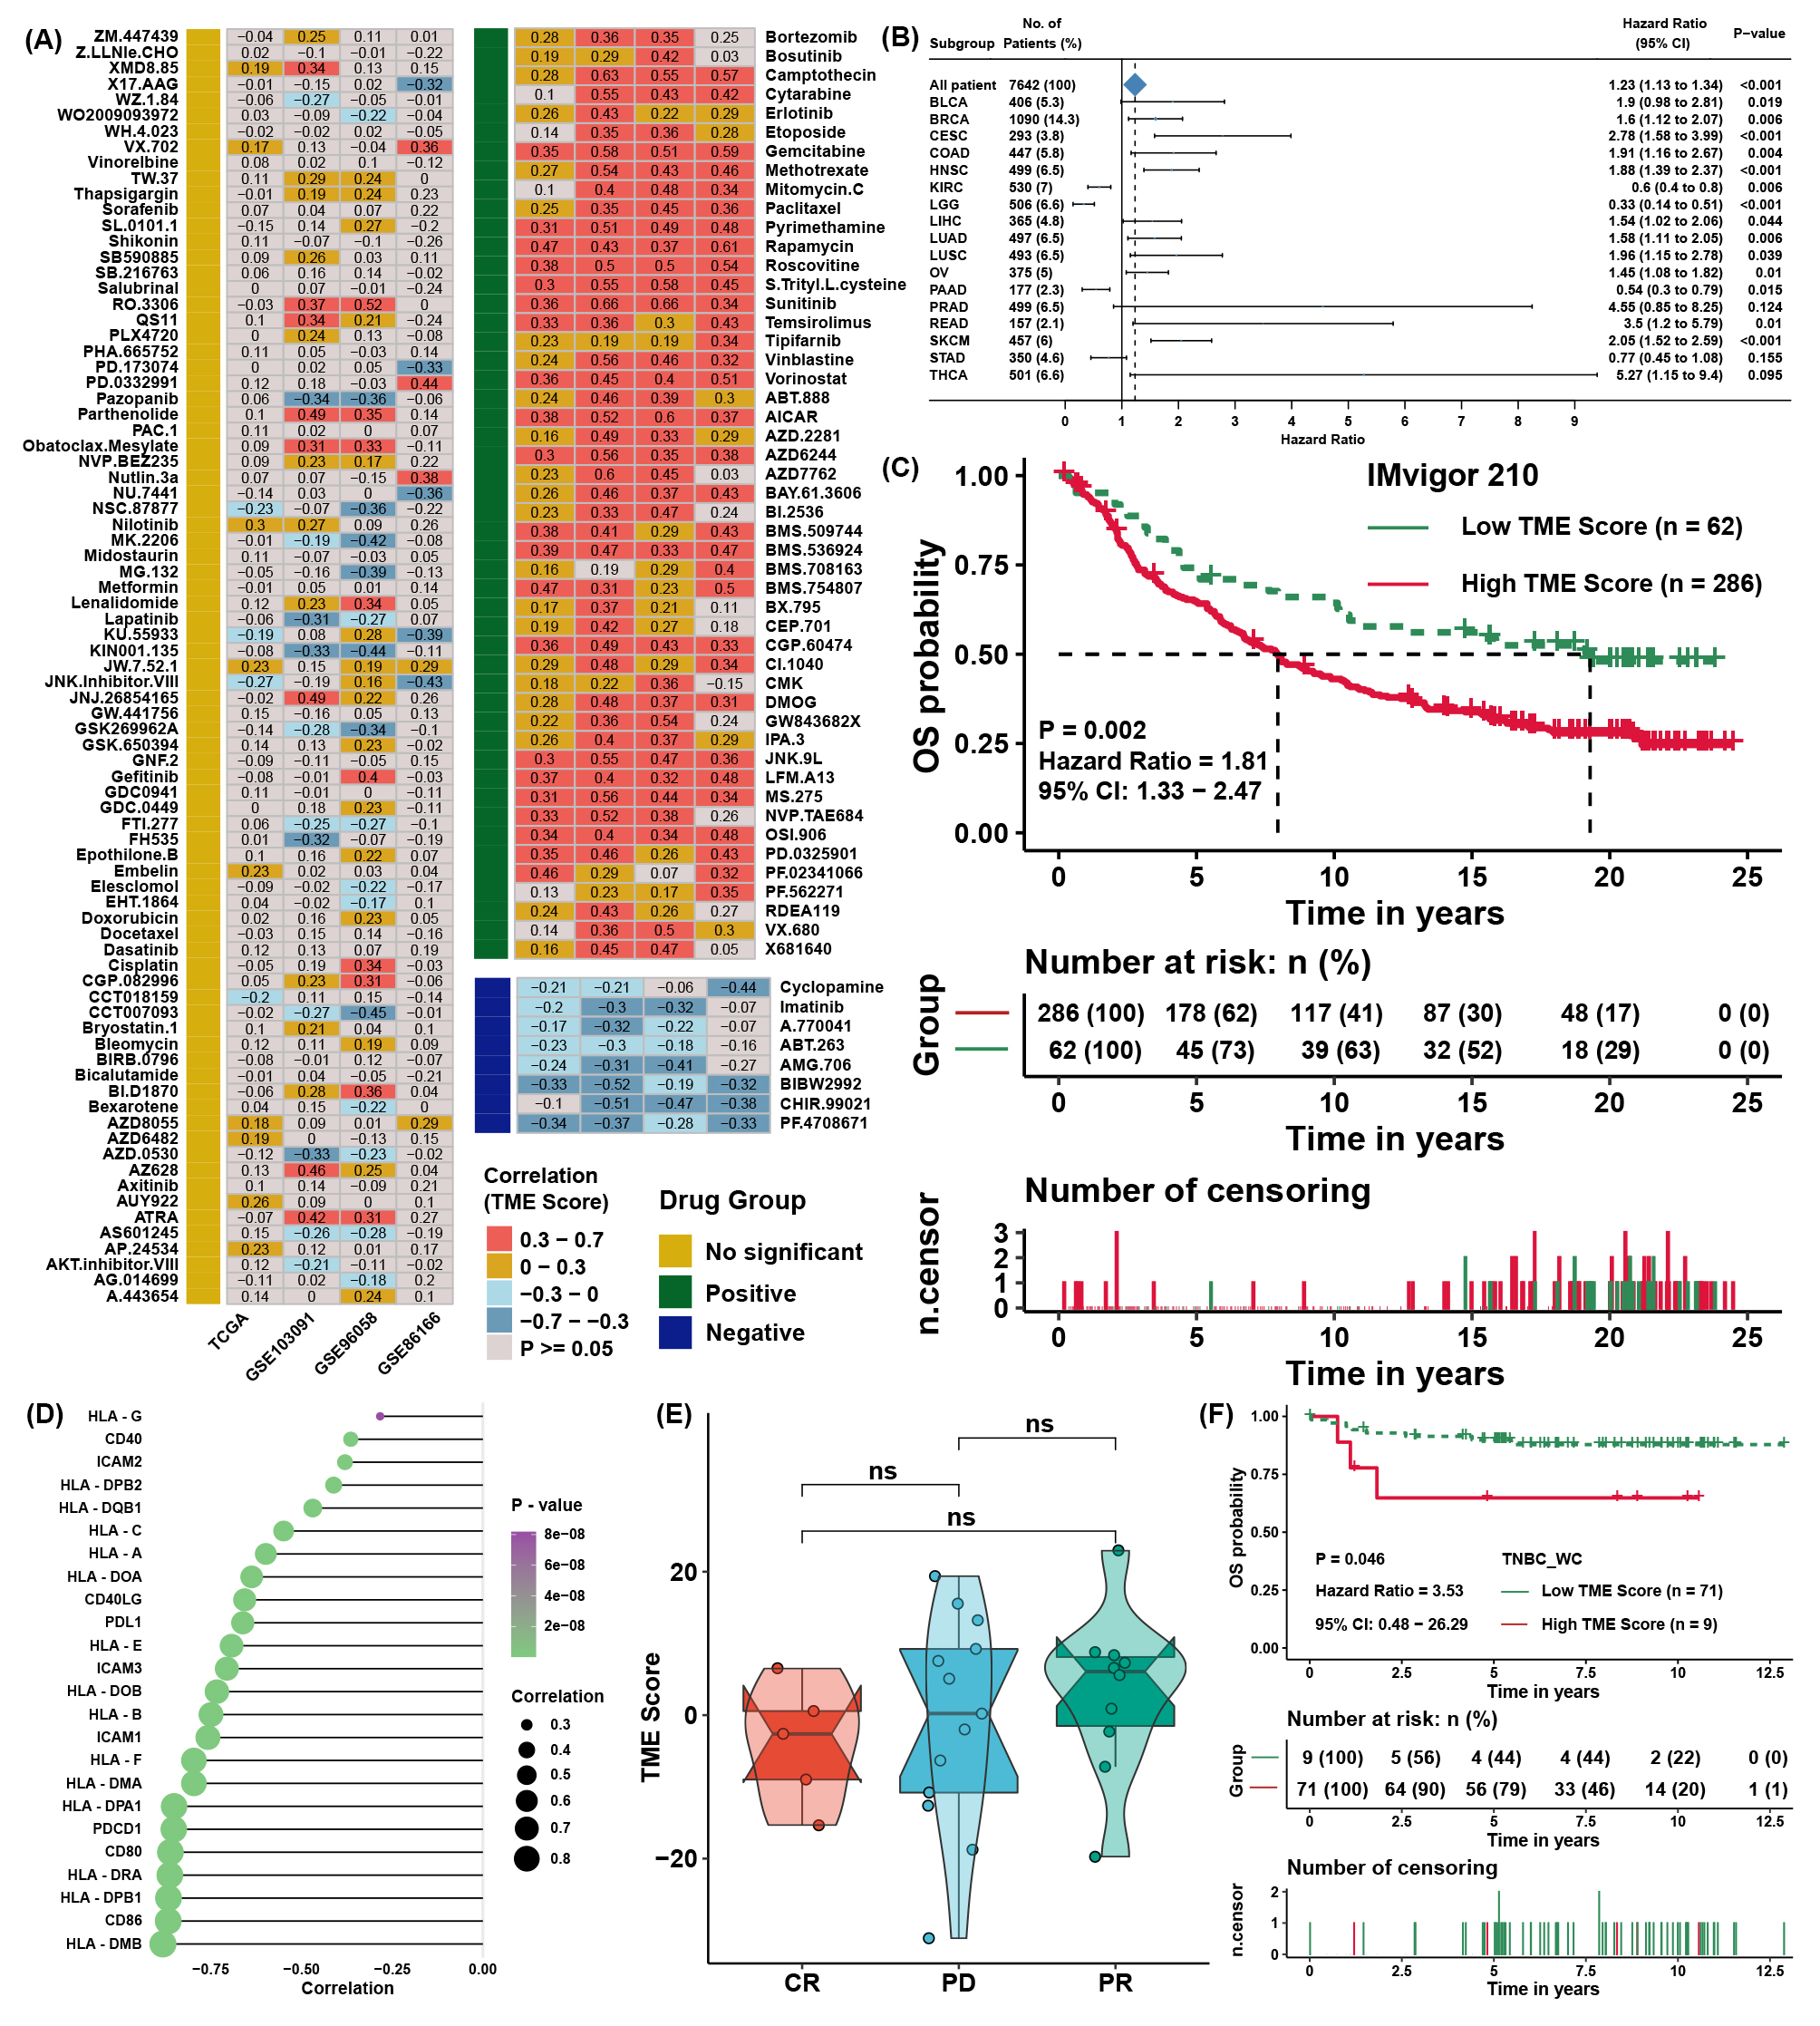
To explore the association between the TME score and drug response, we evaluated the estimated IC50 value of 138 drugs included in the GDSC database in four TNBC cohorts. Correlation analyses were conducted between the TME score and predicted IC50 values (Figure S5A). Drugs with significant differences in more than three cohorts were regarded as potential therapeutic drugs; we found that 8 drugs were sensitive to the high TME score group, and 49 drugs were sensitive to the low TME score group (Figure 4A). The TME score might logically be related to the efficacy of immunotherapy due to its apparent association with immune cell infiltration and activation. TIDE was utilized to predict the immunotherapy response of TNBC patients, and the TME score was lower in the immunotherapy response group (Figure 4B). Moreover, TIDE analysis showed that the TME score was apparently negatively correlated with markers of immunotherapy response and positively correlated with CAFs, myeloid-derived suppressor cells (MDSCs), and TAM M2 (Figure 4C). Lacking TNBC datasets that received immunotherapy, we selected three cohorts that received anti-PDL1, anti-PD1, and anti-MAGE-A3 therapy in bladder cancer (BLCA) and skin melanoma (SKCM) to verify the immunotherapy response prediction value of the TME score. First, TME scores were calculated across cancers in TCGA. TME scores were prognostic risk factors (Figure S5B) and were negatively correlated with immune cell infiltration levels in most cancer types, especially in BLCA and SKCM (Figure 4D). Then, we calculated the TME score in the three immunotherapy cohorts. Interestingly, we found that the TME score was also a risk factor in IMvigor210 (Figure S5C), and patients with a high TME score and low TMB presented the worst survival advantage (Figure 4E). Correlation analysis further validated that the TME score was negatively correlated with the expression of MHC, costimulatory, and adhesion molecules (Figure S5D) and immune cell infiltration levels (Figure 4F). Moreover, a higher TME score was associated with disease progression (PD) and desert-resistant phenotypes (Figure 4G-I). In the anti-MAGE-A3 cohort, the TME score was also negatively correlated with immune cell infiltration levels (Figure 4J) and was lower in the response group (Figure 4K). Similar results could be seen in the anti-PD1 cohort (Figure 4L), although the differences among response groups showed no significance (Figure S5E).
Verification of the TME score in the external validation TNBC cohort
The TME score was calculated as described above in 80 triple-negative breast cancer samples from the Western China Hospital (TNBC_WC) cohort. It was found that a higher TME score was related to the disease progression rate (Figure 5A) and poor survival probability (Figure S5F) of TNBC patients. ssGSEA also showed a strong correlation between the TME score and immune cell infiltration levels in TNBC_WC (Figure 5B) as well as the results of the ESTIMATE score (Figure 5C). Some MHC molecules and ICI targets were also negatively correlated with the TME score, especially PDL1 and PDCD1LG2 (Figure 5D). For pathway analysis, pathways that were associated with the TME score in TNBC_WC were almost the same as the results in the four training cohorts (Figure 5E). Correlation analysis showed that the TME score was positively correlated with the FPI and mRNAsi (Figure 5F). The response group predicted by TIDE analysis showed a lower TME score than the no response group (Figure 5G). Additionally, we predicted the drug IC50 by GDSC analysis and performed correlation analysis with the TME score (Figure 5H) and intersection drugs with the results in the training cohorts, as shown in Figure 5I. These results illustrated that the TME score was a novel and robust method to measure immune cell infiltration levels and therapy efficacy.
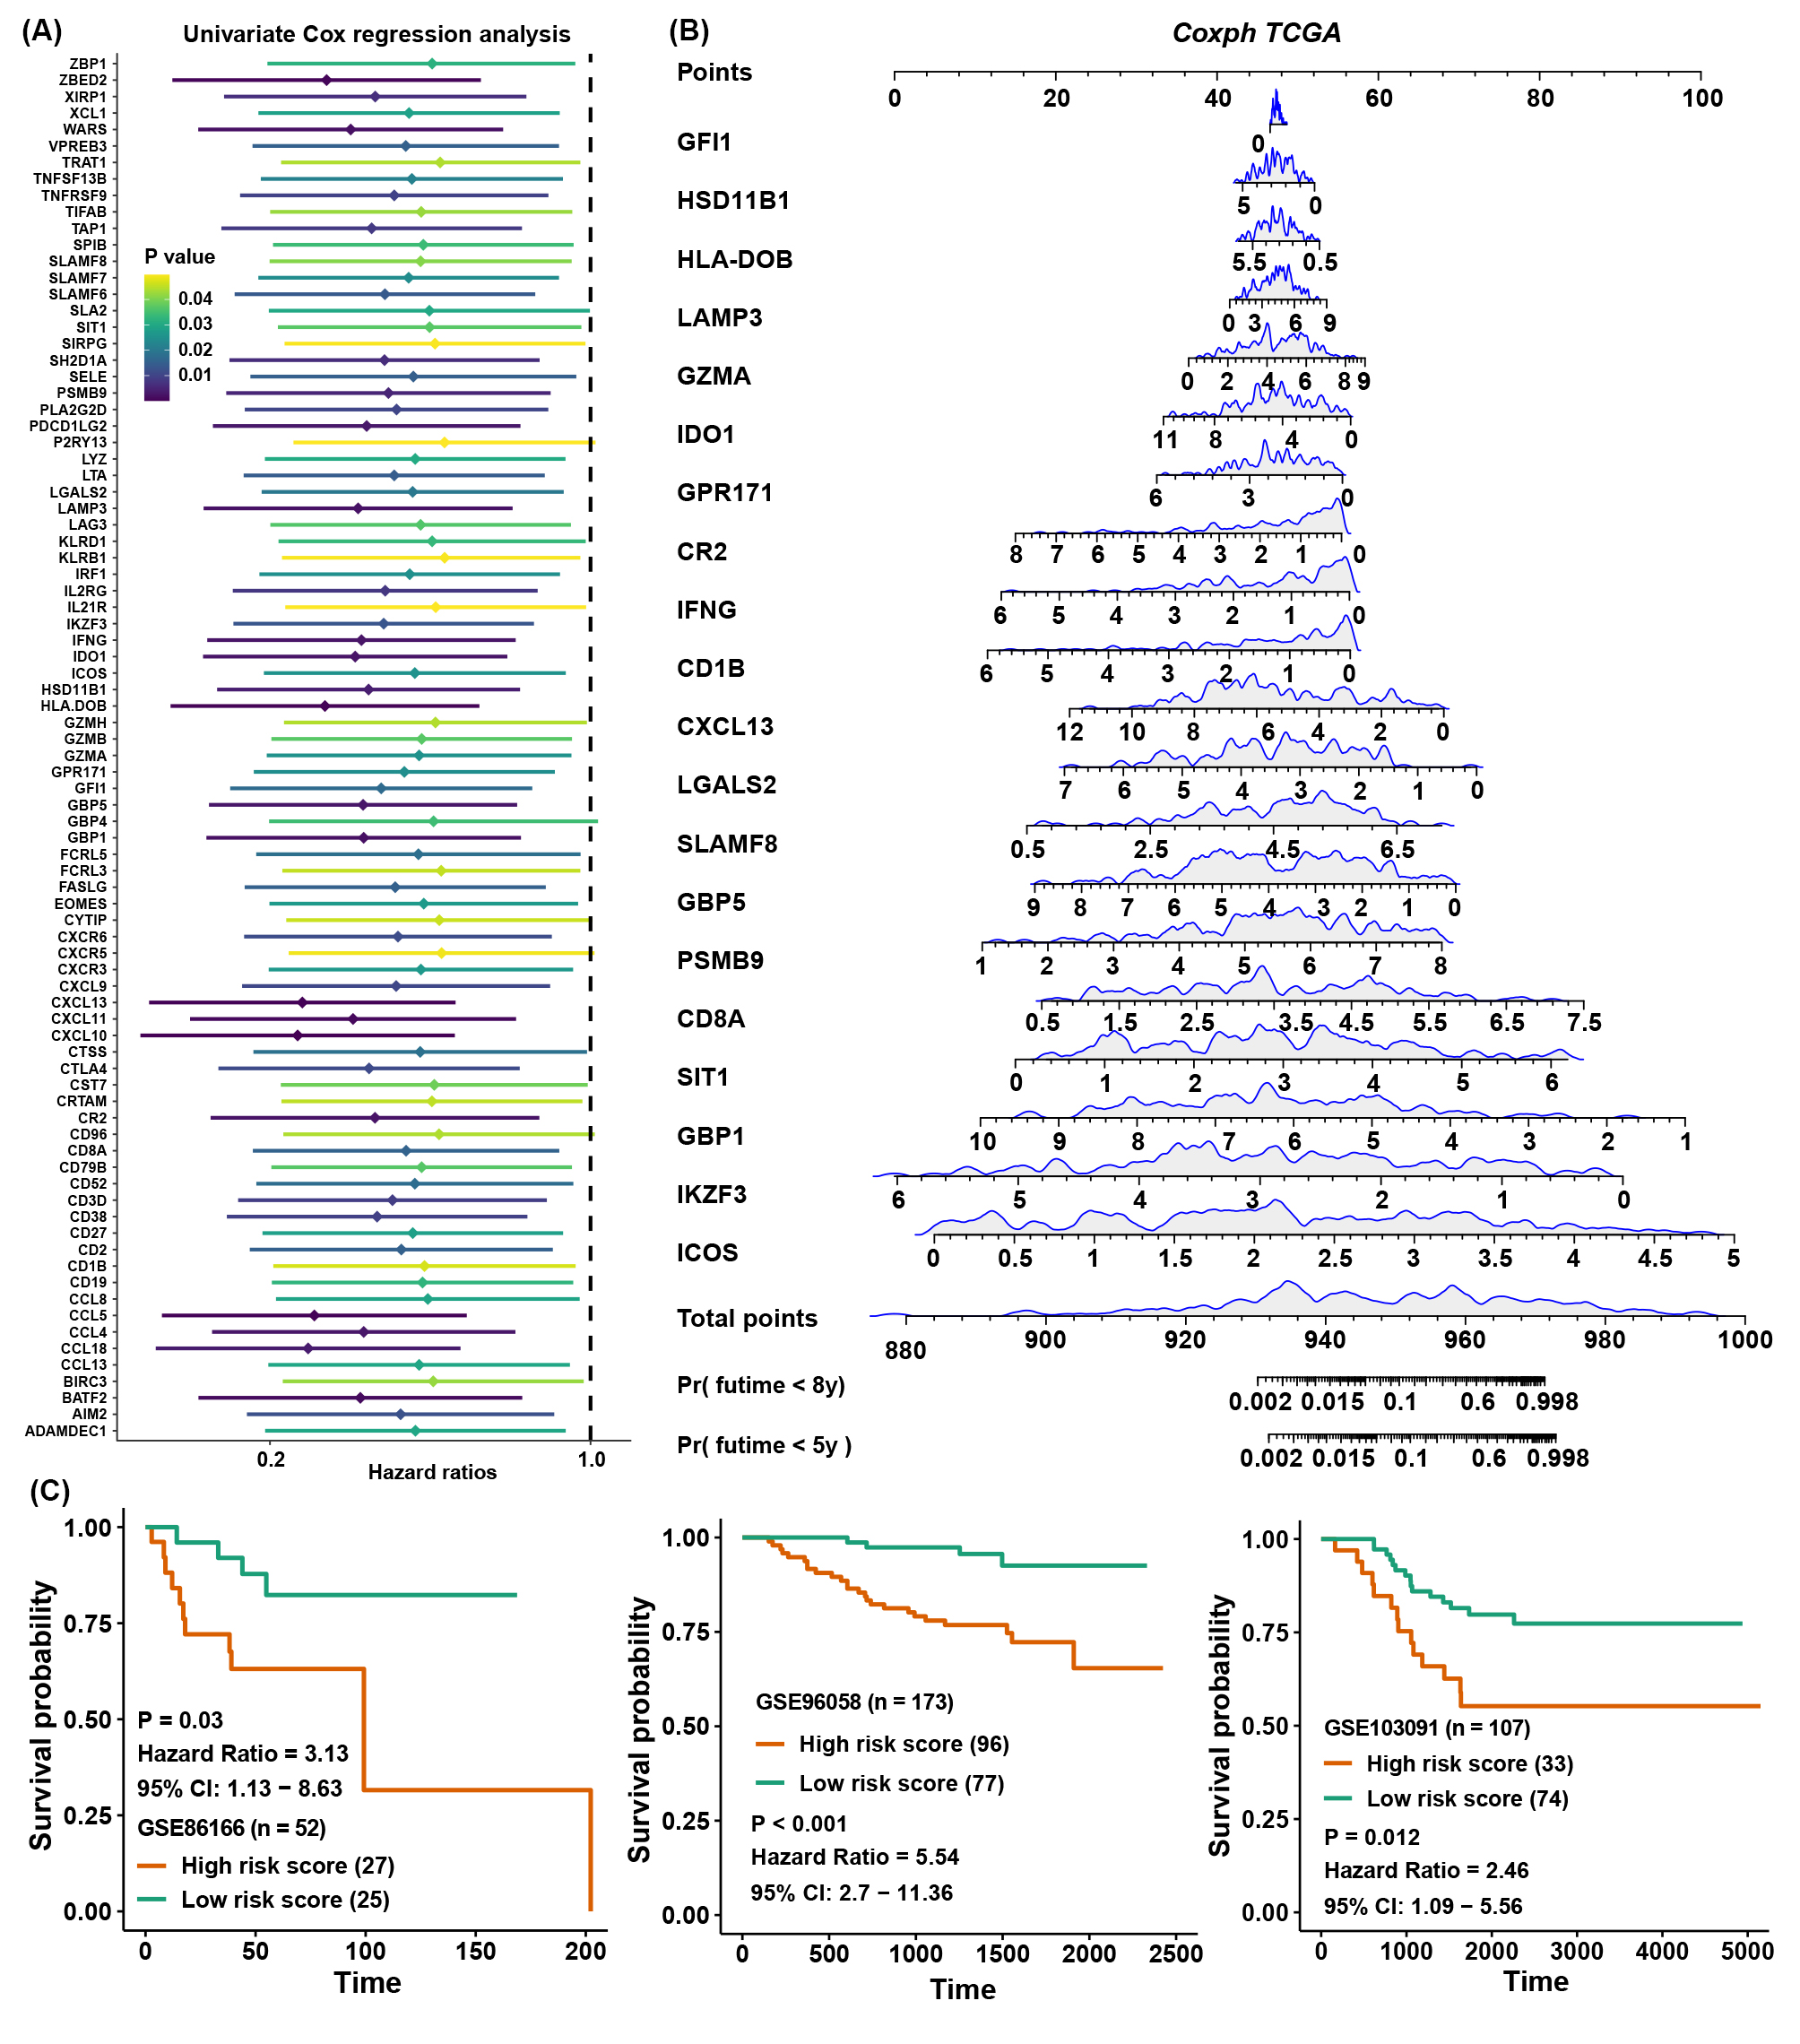
Prognostic signature construction and simplification of the TME score
Considering the accessibility of the TME score, we aimed to shrink the members of the TME score and simplify the formula modes to predict the prognosis of TNBC patients. First, survival analysis was processed for 236 TME-related DEGs in TCGA cohorts; 84 genes with a P value < 0.05 were selected for further research (Figure S6A). Here, iteration LASSO was then used to simplify the members of the TME score; after multiple attempts to reach the highest 5-year AUC, we finally constructed a prognostic signature with 20 members from TME score members (Table S7; Figure 6A). We could see that there were 20 genes with the most frequencies of occurrence in 1000 operation iterations in LASSO algorithms, and prognostic signatures with these 20 genes could reach a high area under the curve (AUC) of ROC for 5 years of survival in the TCGA cohort. To provide a convenient approach for predicting the survival probability of a patient with TNBC, we constructed predictive nomograms with the 20 genes generated above. We developed a nomogram based on the Cox regression model to predict the 5- and 8-year survival probability for TNBC patients (Figure S6B). The calibration plots for the 5- and 8-year survival showed an optimal agreement between the nomogram-predicted and observed OS, which was used to evaluate the accuracy of the prediction signature (Figure 6B). For validation of the prognostic value of the 20-gene signature, the patients in the high-risk group showed a worse prognosis than those in the low-risk group, and the same condition could be seen in other TNBC cohorts (Figure S6C). Before the prognostic signature was constructed, we conducted a correlation analysis between the TME score and the expression of 236 TME-related DEGs in four TNBC cohorts. In view of most genes highly correlated with the TME score, we supposed to simplify the TME score by these 20 genes. Surprisingly, the simplified TME score (sTME score) calculated based on the expression of these 20 genes was highly positively correlated with the TME score in the TNBC_WC cohort (Figure 6C), and patients in the high sTME score group also showed worse DFS than those in the low sTME score group (Figure 6D). Not unexpectedly, the correlation coefficients between the TME score and sTME score were almost close to 1 in other cohorts, which means they were virtually interchangeable (Figure 6E). However, the risk score showed no significance with the TME score, indicating that the risk score was a novel factor generated by the iterative LASSO regression model. Eventually, we set up a coexpression network for 20 genes, and we found strong correlations among them (Figure 6F). The visualization of attribute changes in individual patients using an alluvial diagram indicated that the TME score might be a powerful method to direct therapeutic efficacy or prognostic risk for TNBC patients (Figure 6G).