Animals and Experimental Protocols
Male C57BL/6 mice (aged12 weeks, 20-25 g) were purchased from Liaoning Changsheng Biotechnology Co., Ltd (license no: SYXK (Liao) 2017-0003; Benxi, China). All animals were housed in cages under specific pathogen-free (SPF) conditions at Jinzhou Medical University in standard cages (five mice per cage) with a 12-h/12-h light/dark cycle. The mice had free access to food and water, and their environment was maintained at a temperature of 22-24 ℃. Furthermore, the mice were allowed to adapt to the environment for one week before the experiment. A small-animal anesthesia system (RWD, R640) was used to anesthetize mice with 4.0% isoflurane (RWD Life Science) and maintained on 1.0–1.5% isoflurane. Mice were subjected to transient 1h MCAO followed by reperfusion as described previously. The neurological score was used to screen MCAO mice with scores of 2-3 for the next step[18]. All groups were then housed under SPF conditions before experiments.
ABTS free radical scavenging assay
Antioxidant activities of GSH, GSH-AuNPs, GSH-AuNPs were tested by ABTS scavenging assay. Briefly, the ABTS free radical was formed by ABTS (Solarbio, Beijing, China, BC4770) stock solution (5 mM, dissolved in PBS) reacted with manganese dioxide solution according to the previously described method. The different concentrations of GSH, GSH-AuNPs, GSH-AuNPs were mixed with ABTS free radical solution, and then the absorbance at 405 nm within 6 min was examined using a microplate reader.
Cell counting kit 8 cell toxicity experiment
PC12 cells were plated 1×10⁴ cells per well in a 96-well plate. Then materials were added into cells and incubate for 16 h in a 37 ºC, 5% CO2 incubator. 10 µL/well of cell counting kit 8 (CCK8) Solution (Abcam, Ab228554) was added to each well and protect from the light for 3 h at 37 ºC. Finally, the absorbance increase at 460 nm was measured.
Cell morphology
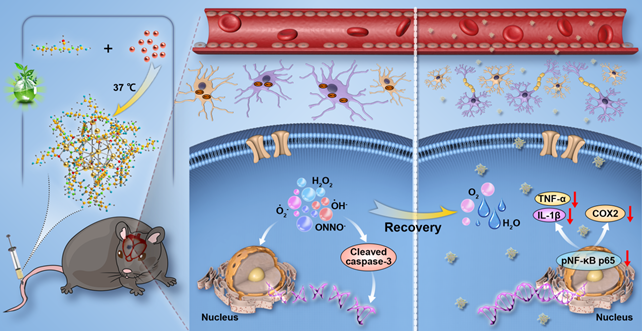
The internalization of GSH-AuNPs and GSH-AuNCs in PC12 after 24 h was detected by transmission electron microscope (TEM). The sample was fixed in 2.5% glutaraldehyde solution at 4 ℃ overnight, and then the sample was treated according to the following steps: The stationary solution was poured out and the sample was rinsed three times with 0.1 M, pH7.0 phosphoric acid buffer for 15 min. Then the sample was fixed with 1% osmic acid solution for 1-2 h. The osmic acid waste liquid was carefully taken out. The sample was rinsed with 0.1M, pH 7.0 phosphoric acid buffer three times. The sample was dehydrated with ethanol solution with gradient concentration (including 30%, 50%, 70%, 80%, 90%, and 95%) for 15 min, and treated with the mixture of embedding agent and acetone (Volume is mixed one to one) for 1 h, then treated with the mixture of embedding agent and acetone (Volume was mixed from three to one) for 3 h. Finally, the sample was treated with a pure embedding agent overnight. The embedded sample is obtained by embedding the permeated sample and heating it at 70 ℃ overnight. The samples were sliced in Leica EM UC7 ultra-thin slicer to obtain 70-90 nm slices. The slices were dyed with lead citrate dye and acetic acid dioxygen dye for 5 min respectively and then dried for microscopic observation.
Oxygen glucose deprivation model in vitro
The cell model of oxygen-glucose deprivation/ reoxygenation(OGD/R) injury was established followed as described before[19]. Briefly, after cell adherence, PC12 was washed with PBS 3 times and changed with EBSS at hypoxia incubator chamber (95% N2, 5% CO2) for 6 h. 1 μg/mL GSH, GSH-AuNPs, and GSH-AuNCs was added with 10% DMEM and incubated in the incubator (5% CO2, 21% O2) for 16 h.
Immunohistochemistry staining
PC12 cells and brain tissue slices (30 μm) were washed three times with 1× PBS for 5 min each, fixed with 4% Paraformaldehyde (PFA) for 30 min. Then they were permeabilized with 0.1% Triton X-100 for 30 min, blocked with sheep serum for 2 h, and incubated with primary antibody overnight at 4 ℃. On the second day, they were incubated with secondary antibodies at room temperature for 2 h and incubated with DAPI (Abcam, ab104139) for 30 min. Finally, they were observed and imaged with a fluorescent inverted microscope. Each step follows three times wash with PBS solution. The following primary antibodies were used: cleaved-caspase3 (Abcam, ab32042), ionized calcium-binding adaptor molecule-1 (Iba-1) (Abcam, ab283342), inducible nitric oxide synthase (iNOS) (Abcam, ab178945).
Flow cytometry
After constructing the OGD/R injured cell model, the cell was washed with PBS 3 times. The apoptosis detection kit was then used to follow the manufacturer’s instructions. The cells were stained with 7-AAD and FITC and analyzed by flow cytometry[20].
BBB passing rate experiment
Bend.3 (1.5×10⁵) was cultured on the upper layer (0.4 μm) until the transendothelial resistance reaches more than 300 Ω/cm2[21]. PC12 (1×10⁴) was cultured on the lower layer. After cell adherence, 1 μg/mL GSH-AuNPs or GSH-AuNPs was added for 3 h, 6 h, 12 h, 24 h. C57BL/6 mice were divided into two groups, one was caudal vein injection with FITC-PEG-GSH-AuNPs and another was caudal vein injection with FITC-PEG-GSH-AuNCs at 100 μL, 20 mg/kg. After 1 h, 2 h, 3 h, 6 h, 12 h, 24 h, the brain tissues were taken out. The gold content in PC12 and brain was detected by inductively coupled plasma mass spectrometry (ICP-MS) (Agilent ICP-MS 7800). In brief, the cell and brain were washed with PBS and transferred to a centrifugal tube. After 1 mL nitric acid was added, all liquid was transferred to another centrifugal tube. Then the sample was digested in the water bath for 40 min. Finally, a small volume of aqua regia was added to digest the sample completely and measured [22].
Western blotting
PC12 cells were physically sheared on ice using RIPA Lysis containing 1% PMSF buffer for 30 min to obtain protein. The supernatant was collected after centrifugation at 12000 rpm (25 min, 4 ℃). Then, these proteins were quantified by BCA reagents (Solarbio, Beijing, China, PC0020), and equivalent amounts of protein (40 µg) were separated on 12% SDS-PAGE gels, transferred to polyvinylidene fluoride (PVDF) membranes, and incubated with the appropriate primary antibodies overnight. The PVDF membranes were washed with TBST and incubated with secondary antibodies (1:10000; Proteintech, USA) for 120 min at room temperature. Finally, the bands were detected by BeyoECL Plus, and the signals were visualized via the Imaging System. The following primary antibodies were used: β-Tubulin (Abcam, ab6046), COX2 (Abcam, ab179800), TNF-α (Abcam, ab215188), IL-1β (Abcam, ab254360), pNF-κB p65 (Abcam, ab194726). The corresponding secondary antibody was employed and β-Tubulin as an internal control.
ROS scavenging ability in vivo and in vitro
PC12 cells (1 × 10⁵ cells / mL) were incubated in 24 well plates. After adhesion, each well was washed with PBS 3 times and stained by DCFH-DA (Solarbio, Beijing, China, D6470) as manufacturer’s instruction. The contents of Malondialdehyde (MDA) (Solarbio, Beijing, China, BC0020) and superoxide dismutase (SOD) (Solarbio, Beijing, China, BC0170) in brain tissue of MCAO mice were detected as manufacturer’s instruction. The brain tissue at the infarct site was obtained with a tissue homogenizer, centrifuged at 12000 rpm for 10 min to maintain the supernatant, and then detected.
2,3,5-triphenyltetrazolium chloride staining
After full perfusion with saline, the MCAO mice brain tissue was taken out and cut into 6 slices of 2mm. The first, fourth, fifth, and sixth slices were taken out for further staining. Then, brain slices were added with 2% 2,3,5-triphenyltetrazolium chloride (TTC) (Solarbio, Beijing, China, G3005) and incubated at room temperature for 15 min. After TTC staining, brain sections were fixed in 4% paraformaldehyde solution for analysis [23].
Brain edema volume
The brain was taken out to measure the overall weight. After 48 h dried in a 105 ℃ oven, the sample was taken out and measured the dry weight. The brain edema volume was calculated with formulation followed[24].

Hematoxylin-eosin & Nissl staining
Mice were randomly divided into 3 groups (n=3) as a saline group, 20 mg/kg GSH-AuNCs group, and 40 mg/kg GSH-AuNCs group. After caudal vein injection 100 μL every 24 h for 7 consecutive days, main organs (including heart, spleen, lung, liver, kidney, and brain) were collected, paraffin-embedded, and sliced into 3 μm sections. Then hematoxylin-eosin (H&E) (Solarbio, Beijing, China, G1121) was performed according to the and observed under the microscope. MCAO mice were administered for 24 h, then the brain tissue was taken out and performed H&E and Nissl (Solarbio, Beijing, China, G1434) staining followed manufactory’s instruction.
Morris water maze
The mice were trained 3 days before the test to exclude the mice with visual impairment and unable to swim. After 28 days of modeling, the water maze experiment was carried out. The first five days were the visible platform period. The time required for the mice to enter the water to the platform and stay for 2 s was calculated. If it exceeds 60 s, it shall be calculated as 60 s. The platform was removed on the sixth day, and the residence time in each quadrant and the number of crossings at the original platform were counted, referred to this article (Unbiased transcriptomic analyses reveal distinct effects of immune deficiency in CNS function with and without injury) [25].
In vivo imaging
The distributions of GSH-AuNPs and GSH-AuNCs were detected in different organs in wild mice and MCAO mice. C57BL/6 mice were divided into two groups, one was caudal vein injection with FITC-PEG-GSH-AuNPs and another was caudal vein injection with FITC-PEG-GSH-AuNCs at 100 μL, 20 mg/kg. At 1 h, 2 h, 3 h, and 6 h, the organs of control mice were dissected (including, spleen, lung, liver, kidney, and brain) and MCAO mice were dissected only at 3 h. Then the emitted brain fluorescence image was captured by IVIS Spectrum, PerkinElmer system to record the fluorescence distribution.
Detection of drug distribution in vivo
The administration in vivo was a caudal vein injection, and the dose was 20 mg/kg. After injection of GSH-AuNCs, orbital blood was taken at different periods, the gold content in blood was detected by ICP-MS, and the pharmacokinetic parameters were analyzed. We studied the pharmacokinetics of C57BL/6 mice in vivo according to the reported method [26]. Briefly, C57BL/6 mice were weighed and caudal vein injected with 100 μL of 20 mg/kg GSH-AuNCs. Blood was taken regularly from the ophthalmic vein. ICP-MS (Agilent ICP-MS 7800) was used to detect the gold content in blood, and pharmacokinetic parameters were analyzed.
Statistical analysis
Prism 6.0 software (GraphPad) was used for statistical analysis. In this study, the experiment was repeated at least 3 times, and all data were expressed as mean ± SD. The SPSS statistical program version 25 (IBM Corp., Armonk, NY) and one-way analysis of variance (ANOVA) were employed for multi-group comparison and statistical analysis. Differences in *P <0.05, **P <0.01, and ***P <0.001 were considered statistically significant.