Study participants
Demographics are presented in Table 1, more detailed information are shown in Supplement Table 1. Between CU and CI participants, there was no significant difference in age, while there were more females, longer time for education, and less prevalence of APOE e4 in the CU group. No significant differences were found between MCI and AD (subgroups of CI) in age, gender, education, or APOE e4. MMSE, Aβ42, hippocampal volume, temporal cortical thickness and FDG PET decreased sequentially, while CDRSB, amyloid and tau PET, CSF tau and NfL increased sequentially among CU, MCI, CI and AD groups. However, there was no significance in NfL between MCI and AD. As plasma NfL level was reported to be positively associated with age (ρ=0.471, p<0.01)16-17, we divided participants into younger and older groups using a median split (age=72.25y) and found there was a significant difference in NfL levels between the resulting groups (p<0.001). Therefore, the prevalence of (N)+ using NfL was likely to vary by age in the present cohort, so we calculated the cut-point based on age stratification.
Biomarker relationships
Cut-points were defined as CSF Aβ42 <880 ng/L (A1), amyloid PET >1.1 SUVR (A2), p-tau > 21.11 ng/L (T1), ITC tau PET >2.122 SUVR (T2), Braak V/VI tau PET >1.938 SUVR (T3), adjusted hippocampal volume <-0.4477 cm3 (N1), temporal meta-ROI thickness <2.9214 mm (N2), CSF t-tau > 233.6 ng/L (N3), FDG PET meta-ROIs <1.2599 SUVR (N4), plasma NfL in younger participants >30.35 ng/L and in older participants >36.45 ng/L. Similar cutoffs were obtained using the 90% sensitivity for AD, while mean ± 2 SD from Aβ-negative CU controls resulted in more conservative cutoffs (Supplement Table 2).
Continuous biomarkers within each component were correlated: CSF Aβ42 vs amyloid PET (ρ=-0.671; Figure 1A), p-tau vs ITC tau PET (ρ=0.379) and Braak V/VI (ρ=0.380), as well as between the 2 tau PET measures (ρ=0.851; Figure 1B–D); hippocampal volume vs temporal cortical thickness (ρ=0.584), vs FDG PET (ρ=0.448), and vs NfL (ρ=-0.395); temporal cortical thickness vs FDG PET (ρ=0.426), and vs NfL (ρ=-0.321); and FDG PET vs NfL (ρ=-0.326). There were weak correlations between CSF t-tau and other neurodegeneration biomarkers: CSF t-tau vs hippocampal volume (ρ=-0.239), vs temporal cortical thickness (ρ=-0.215), vs FDG PET (ρ=-0.145, p<0.05) and vs NfL (ρ=0.188; all p<0.001 except as specially marked; Figure 1E–N).
Using binary data, there was a substantial agreement between amyloid biomarkers (Figure 1A), between the 2 tau PET measures (Figure 1B-D); and a moderate agreement between the 2 MRI imaging measures (Figure 1E). Fair agreement was seen between p-tau and tau PET (Figure 1B-C), between MRI imaging measures, FDG PET and NfL (Figure 1G, H, J, K, N), while slight agreement between CSF t-tau and other neurodegeneration biomarkers (Figure 1F, I, L, M).
Prevalence measures in CU participants
Prevalence for AT(N) categories in CU and CI participants are summarized in Figure 2, Figure 3 and Supplement Table 3-4. When only considering A and T in CU, A-T- were the most common categories (range 43.5% [A1T1; 95% confidence interval, 36.6%-50.5%] to 62.0% [A2T2; 95% confidence interval, 55.0%-68.8%]). Comparing A biomarkers, slightly more were negative when using CSF Aβ42 than amyloid PET. Positivity in T was highest when using CSF p-tau both in the case of A+ or A-, while the prevalence of T+ was much less when using tau PET (Figure 2A). These results indicate that using CSF p-tau may greatly increase the positive rate of T component compared to tau PET in CU participants.
When adding (N) biomarkers, the most prevalent categories was A-T-(N)- (range 26.1% [A2T1(N)5; 95% confidence interval, 18.7%-33.3%] to 50.8% [A2T2(N)2; 95% confidence interval, 44.1%-58.0%]). Although there were 8 possible categories in each AT(N) variants, several categories were lacking or had very low frequencies (Figure 3A), including A+T+(N)+, A+T-(N)+ and A-T+(N)+ when using MRI imaging and FDG PET, as well as A+T+(N)-, A+T-(N)+ and A-T+(N)- in the combination of CSF p-tau and t-tau, since strong correlation (ρ=0.980, p<0.001) and almost perfect agreement (κ=0.876; concordance=93.8%) between them18. Among the different biomarkers for (N), CSF t-tau and plasma NfL were the most prevalent biomarkers resulting in (N)+ cases (Figure 3A).
Prevalence measures in CI participants
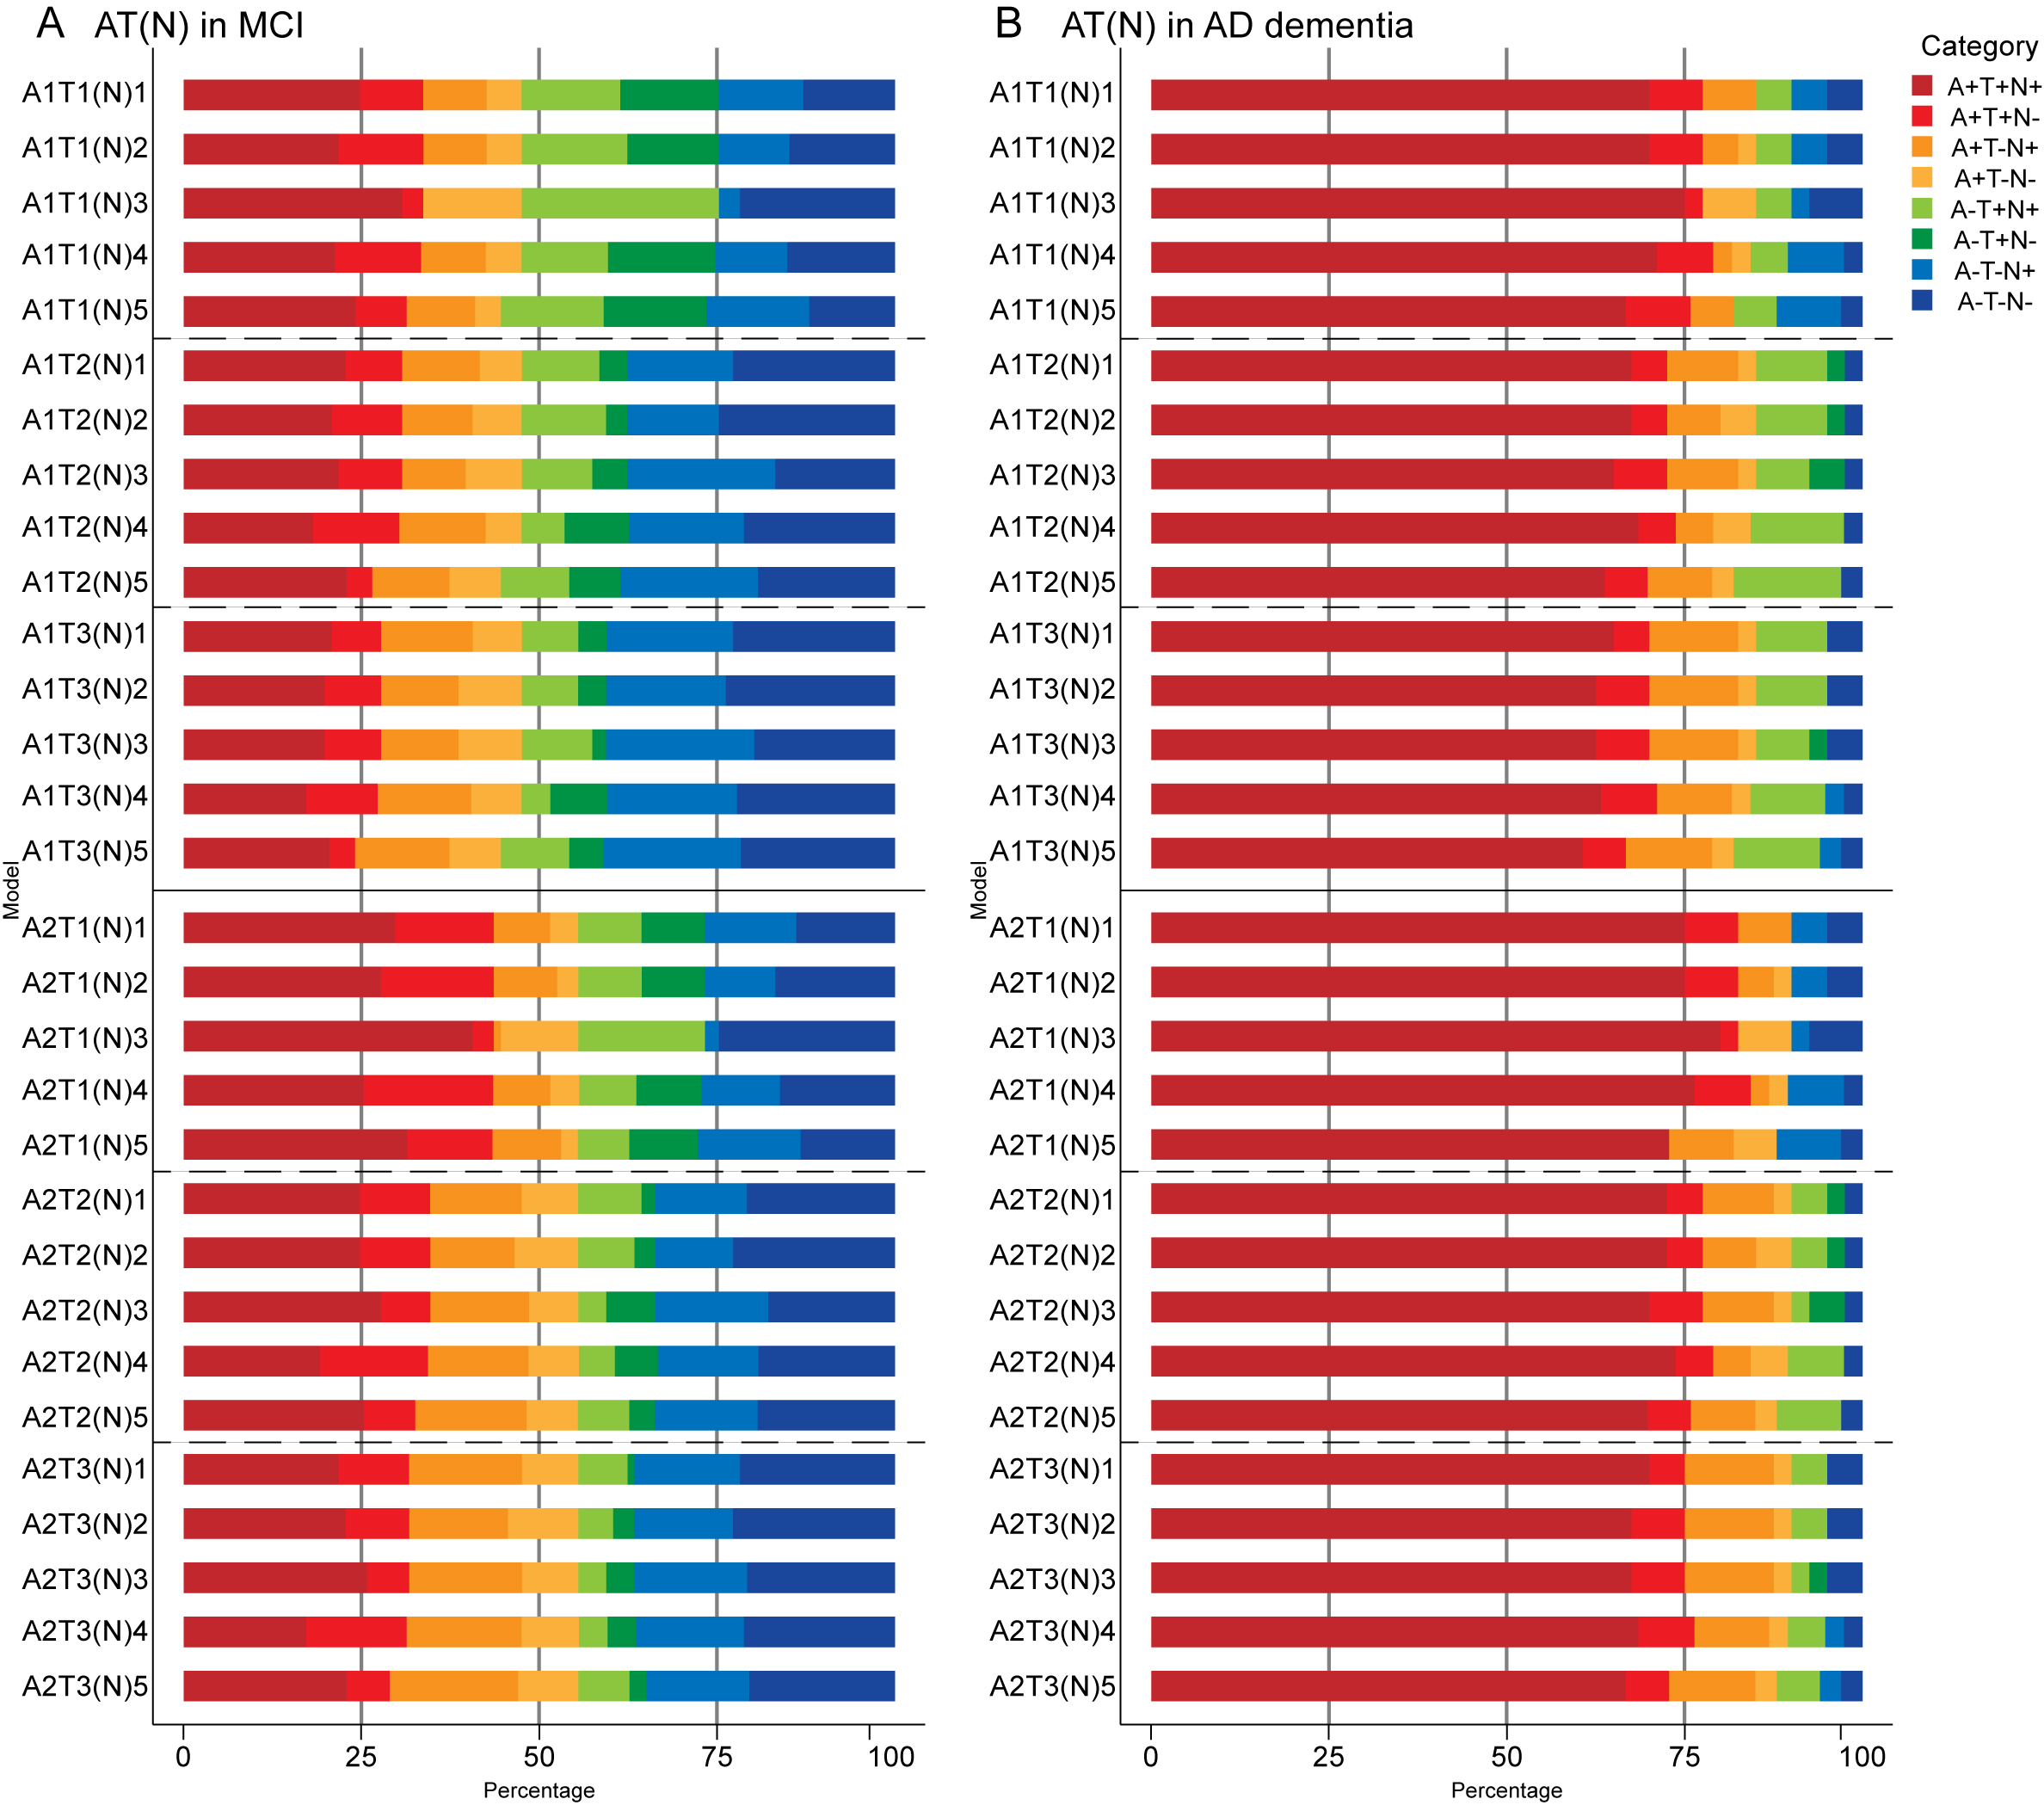
A+T+ was the main category when only using A and T biomarkers in CI (range 39.7% [A1T3; 95% confidence interval, 31.8%-48.4%] to 54.6% [A2T1; 95% confidence interval, 45.7%-63.5%]). A and T categories of different AT(N) variants in CI demonstrated similar trends to CU (i.e., higher prevalence of A+ using amyloid PET and lower prevalence of T+ using tau PET) (Figure 2B). There were significant differences in A and T categories between 2 subgroups of CI (Fisher exact test, all p <0.001). In MCI, A-T- were the most common categories when using tau PET in Braak V/VI (Figure 2C). In AD, A+T+N+ accounted for about 75% (range 70% [A1T3; 95% confidence interval, 55.8%-85.3%] to 82.5% [A2T1; 95% confidence interval, 69.8%-93.3%]); the difference from other groups was the lower prevalence of T+ using CSF p-tau than tau PET in the case of A- (Figure 2D).
When adding (N) biomarkers, the most prevalent categories was A+T+(N)+ (range 29.9% [A1T3(N)4; 95% confidence interval, 23.3%-38.6%] to 51.8% [A2T1(N)3; 95% confidence interval, 43.2%-60.3%]), and the frequencies of T+(N)- and T-(N)+ in the combination of CSF p-tau and t-tau were relatively low (Figure 3B). As mentioned above, A-T-N- was the main category when using tau PET in Braak V/VI combined with some N biomarkers (A1T3[N]1, A1T3[N]2, A1T3[N]4, A1T3[N]5 and A2T3[N]4) in MCI (Supplement Figure 1A). AD group had the most A+T+N+ (range 60.6% [A1T3(N)5; 95% confidence interval, 44.1%-76%] to 80% [A2T1(N)3; 95% confidence interval, 67.6%-92.1%]) among 3 groups. Again, several categories were lacking or had low frequencies (A-T+N-, A-T-N+ when using tau PET) (Supplement Figure 1B). The prevalence of all the (N) biomarkers resulting in (N)+ cases was approximative, except it was relatively low when using FDG PET in CI (Figure 3B).
Longitudinal cognition
Overall findings for longitudinal cognition using continuous predictors are summarized in Figure 4, Figure 5 and Supplement Table 5-7. In CU participants, age and education significantly affected cognition (age, p=0.027 and education, p=0.048 in CDRSB; age, p=0.025 and education, p<0.001 in MMSE), consistent with previous findings19-20. When using a single AT(N) biomarker to predict cognitive changes, exclusively MRI imaging contributed significantly ([N]2 in CDRSB, [N]1 in MMSE; Figure 4G, H). The best AT(N) variants capturing changes in cognition in CDRSB and MMSE were A2T3[N]2 (R2=7.84%) and A2T1[N]1 (R2=12.29%) respectively, but not all included biomarkers contributed significantly (Figure 4B, E). For the marginal R2 in CU participants relatively low, we considered whether random effects (i.e., individual heterogeneity) accounted for more variance. Then we calculated conditional R2 using MRI imaging biomarkers ([N]2 for CDRSB and [N]1 for MMSE). Adding individual heterogeneity and slope for time as the random effect, conditional R2 increased to 19.32% and 33.55% in CDRSB and MMSE respectively. These results indicated that longitudinal cognition in CU participants was mainly associated with individual characteristics; and MRI imaging measurements were the best biomarkers to predict cognitive changes.
In CI participants, individual characteristics were not significantly associated with cognitive decline. Almost all single AT(N) biomarkers could predict longitudinal cognition except CSF p-tau (p=0.061) and t-tau (p=0.051) in CDRSB, and marginal R2 using MRI imaging and tau PET was relatively higher than others. The AT(N) variants combining CSF Aβ42, tau PET, and temporal cortical thickness were the best predictors in both CDRSB and MMSE, and almost all included variables contributed significantly (Figure 5B, C, E, F). Then we found the interaction between time and AT(N) variants significantly improved the goodness of model fit (AIC and BIC) using paired t test (p<0.001 in CDRSB and MMSE), and interactions dominated the main effects. Again, CSF Aβ42, tau PET, and temporal cortical thickness were the best in both scales (CDRSB: A1T2[N]2, R2=52.76%; A1T3[N]2, R2=52.24%; MMSE: A1T3[N]2, R2=50.84%; A1T2[N]2, R2=50.25%) and all interactions were significant (Figure 5, G-J).
Sensitivity analyses
We repeated the AT(N) prevalence analyses using alternative cut-points (Supplement Table 8). Using cutoffs from 90% sensitivity for AD, except for more amyloid positivity using CSF Aβ42 in CU participants, other results were in concordance with main cutoffs. However, cut-points defined by mean ± 2 SD from Aβ-negative CU controls were more conservative. There was the least tau positivity using CSF rather than PET, and temporal cortical thickness in all participants was negative.