Mitochondrial genomes of Lepidoglyphus destructor and Gohieria fusca
We determined the complete mitochondrial genomes of L. destructor (GenBank accession number: MT075728) and G. fusca (GenBank accession number: MN608156), with lengths of 14,663 bp and 14,741 bp, respectively. Both contained the typical set of 13 protein-coding genes (PCGs), 22 transfer RNAs (tRNAs), two ribosomal RNAs (rRNAs), and (Table 1). The overall base composition of the entire L. destructor mitogenome consisted of 25.0% A, 39.2% T, 15.2% C, and 20.6% G. In G. fusca, the overall base composition of the entire mitogenome consisted of 25.8% A, 38.4% T, 15.8% C, and 20.1% G. In both species, the nucleotide composition had the same AT bias (64.2%). The combined protein-coding sequence lengths in the two species were 10,785 bp and 10,827 bp, respectively. In the G. fusca mitogenome, 11 protein-coding genes used standard start codons known as ATN. In addition, several unorthodox initiation codons were used. Atp8 initiated with GTG, and nad3 started with codon TTG (Table 1). In L. destructor, 12 protein-coding genes used standard start codons, and nad3 starts with codon TTG (Table 1).
Table 1. Mitochondrial genome organization of Lepidoglyphus destructor and Gohieria fusca. Int = intergenic nucleotides; negative numbers indicate overlapping nucleotides between adjacent genes.
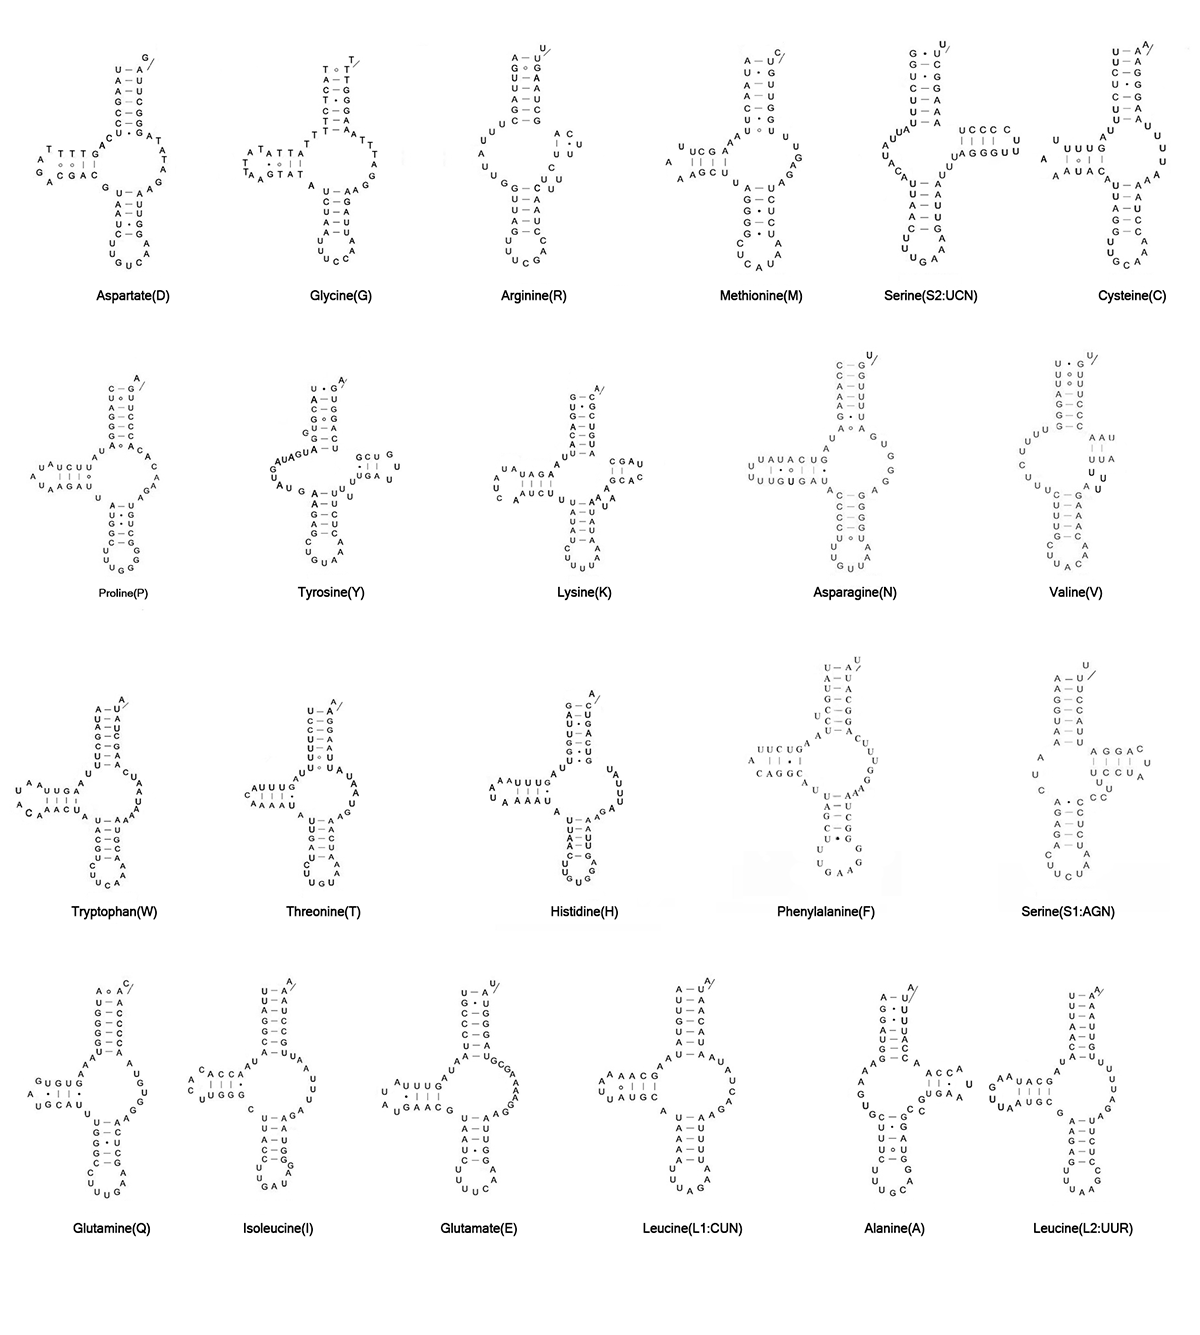
Mitogenomes of L. destructor and G. fusca have been predicted to have the full set of tRNA genes. The putative mt tRNA genes were highly truncated in both L. destructor (46 to 61 bp) and G. fusca (48 to 61 bp). Only trnK showed the typical cloverleaf in these two species (Fig. S1, S2). Other tRNAs showed the reduction of tRNA-D- and/or T-arms. In L. destructor, we identified 21 tRNAs using automated prediction. We determined the trnV manually by alignment with homologous sequences in other astigmatid mites based on their anticodon and secondary structure. In G. fusca, we identified 19 tRNA genes using automated prediction. We identified the other three tRNA genes (trnN, trnV, and trnA) manually.
The novel feature of the largest non-coding region
Two large (>50 bp) non-coding regions (NCRs) could be identified in the L. destructor and G. fusca mitogenomes (Table 2). In L. destructor, the largest noncoding region (LNR, 813 bp) had an overall AT content of 68.4% and could be divided into two domains, domain I (463 bp) and domain II (350 bp), based on AT content and stem-loop structures (Fig. 1A). Domain I was on the J-strand at the 3’ end of trnF and had an AT content of 62.2%. A peculiar feature of this domain is the presence of a stem-loop structure with a length of 432 bp and short sequences (5’-GGGGGTAGGGG and CCCCTACCCCC-3’) (Fig. 1A I-box). Domain II was on the J-strand at the 5’ end of the trnS1 gene. The AT content was 78.9%, which was more AT-rich than domain I. Comparative sequence analysis of this domain identified conserved sequences, one microsatellite-like AT-repeat element, and several stem-loop structures (Fig. 1). In the mitochondrial genome of G. fusca, the LNR was 861 bp long and had an overall AT content of 70.7%. The LNR also could be divided into two domains. Domain I had a stem loop structure with a length of 435 bp (Fig. 1A). The short sequences (5’-GGGGGTAGGGG and CCCCTACCCCC-3’) were not found in domain I. The AT contents of domain I and domain II were 57.3% and 86.6%, respectively. The conserved sequences, one microsatellite-like AT-repeat element, and several stem-loop structures, were found in domain II. In total, we found the feature of two domains in both species from Glycyphagoidea.
Fig. 1. Conserved sequence blocks and secondary structures of the largest non-coding region in astigmatid mites. (A) Mapped on L. destructor, G. fusca, and Acalvolia sp. The domain I (striped box) and domain II (white box) are marked. The conserved sequences in domain I and the conserved palindromic sequences in domain II are shown in underlined letters. The A+T content of two domains is indicated. (B) Mapped on Aleuroglyphus ovatus, Caloglyphus berlesei, Rhizoglyphus robini, Tyrophagusputrescentiae, Dermatophagoides pteronyssinus,D. farinae, Psoroptes cuniculi, Ardeacarus ardeae, Carpoglyphus lactis, Sarcoptes scabiei, and Trouessartia rubecula (after revision). The conserved palindromic sequences are shown in underlined letters. Accession numbers of the analyzed sequences are reported in Table 6.
To investigate whether the feature of two domains existed in other astigmatid mites, we conducted a comparative analysis of non-coding regions from all available Astigmatid mitogenomes (Table 2). In astigmatid mites, most reported mitogenomes feature a compact structure that usually contains two conserved site-specific NCRs (except for Ty. longior, H. blomquisti, and H. feroniarum) and several nonconserved NCRs. These conserved site-specific NCRs are located between trnF-trnS1 and trnW-nad1 with high AT content (the average content is 84.8.0% and 71.9%, respectively). The LNR is usually located in trnF-trnS1, and the length of this region averages 420 bp. The three longest conserved NCRs are in L. destructor, G. fusca, and Acalvolia sp. (813, 861, and 753 bp, respectively). The shortest NCRs located in trnF-trnS1 is only 76 bp in Sarcoptes scabiei.
Table 2. Distribution of NCRs in the astigmatid mites mitochondrial genomes.
Note: Non-coding regions marked with a star are assumed to be putative control regions. The data for Trouessartia rubecula, Histiostoma blomquisti, and H. feroniarum in the table are after our revision.
Note that the several conserved sequences in domain II of L. destructor and G. fusca, including microsatellite-like (AT)n and several hypothetical stem-loop structures, were observed in the NCRs between trnF-trnS1 for most reported astigmatid mitogenomes (Fig. 1B). These conserved sequences were reported in the LNRs for Acaroidea species (Aleuroglyphus ovatus, Caloglyphus berlesei, Rhizoglyphus robini, and Tyrophagusputrescentiae), Pyroglyphidae species (Dermatophagoides pteronyssinus and D. farinae), Hemisarcoptoidea species (Acalvolia sp., Carpoglyphus lactis), and Sarcoptoidea (Psoroptes cuniculi) [22, 24-26]. In addition, we also found these conserved sequences in Pterolichoidea (Ardeacarus ardeae). Additionally, we observed microsatellite-like (AT)n sequence in the LNR in Sarcoptoidea (Sarcoptes scabiei) and Analgoidea (Trouessartia rubecula).
The other conservative non-coding region was located in trnW-nad1, and the length of this region averaged 72 bp (Table 2). The longest reached 273 bp in Acalvolia sp.. The shortest was in Ardeacarus ardeae, with only 29 bp. A similar sequence [5’-(G)nTA(G)n -3’] was found in the NCR of most available astigmatid mites (including the Tr. rubecula and the H. feroniarum after reannotation), except for Ardeacarus ardeae. A similar sequence [5’-(G)nTA(G)n -3’] also was found in domain I of the LNR for L. destructor and Acalvolia sp., except domain I of the LNR for G. fusca. This sequence, [5’-(G)nTA(G)n -3’], seemed to be conserved in most available astigmatid mites.
Additionally, some astigmatid mites also exhibited other nonconservative NCRs (Table 2). Both H. blomquisti and H. feroniarum had one nonconservative NCR, and several stem-loop structures were found in these NCRs. The sequences and the stem-loop structures did not seem to be conserved.
Compared with the other described astigmatid mite NCRs, only Acalvolia sp. (Astigmata, Hemisarcoptoidea) showed a similar feature of two domains in the LNR. In Acalvolia sp.,the LNR also could be divided into two domains: a 469 bp fragment of domain I and a 284 bp fragment of domain II. The AT contents of domain I and domain II were 71.6% and 84.9%, respectively. In domain I, we found short sequences (5’-GGGGGTAGGGG and CCCCTACCCCC-3’) and a stem-loop structure. The conserved sequences among astigmatid mites were found in domain II (Fig. 1A).
As described earlier, the feature of two domains for the LNR was found only in L. destructor, G. fusca, and Acalvolia sp. among all available astigmatid mites.
Reannotation of four tRNA genes for Histiostoma blomquisti
In terms of previous study for H. blomquisti, the smallest four tRNAs (trnA, trnS2, trnR, and trnV) could only be annotated manually, but the remaining tRNAs (trnC, trnF, and the other 16 tRNAs) were identified using more than a manual approach [27]. To find more probable structures, we reannotated four tRNAs (trnC, trnA, trnF, and trnS2) based on the mitogenome from our analysis. We identified trnF and trnS2 manually, and verified trnC and trnA based on the minimum free energy (MFE).
Our trnF identified by manual sequence alignment was more conservative, showing fewer mismatches in the acceptor stem. This tRNA lies on the J-strand at the 3′ end of nad5. Without predictions from tRNA search programs, we manually retrieved a tentative trnS2 from the sequence of previous study [27]. Similarly, we manually inferred the putative trnS2 to be a D-loop with fewer mismatches on stems. As a common phenomenon in Astigmatina, this D-loop was extremely truncated (43 bp). Compared with H. feroniarum and other astigmatid species, trnS2 in our study was more conserved (Table 3).
Table 3. The alignment of nucleotide sequences of four mitochondrial tRNA genes
(trnS2, trnW, trnF, and trnI) in five reported astigmatid species in four different superfamilies.
Whenever contradictory predictions occurred, we calculated the minimum free energy (MFE) as a proxy. According to the MFE, we determined trnC and trnA in our study. These were more probable as having fewer mismatches on stems and arms (Fig. 2). After being amended, trnC apparently shared 54bp nucleotides with the adjacent trnP, these two genes overlapped and were on opposite strands (Table S1).
Fig. 2 Secondary structures of trnC and trnA for Histiostoma blomquisti and trnC, trnV, and trnQ for Histiostoma feroniarum in our study.
Note: Bars indicate Watson-Crick base pairings; dots and circles represent GU pairs and mismatched pairs, respectively. *Hb and *Hf are obtained in this study. MFE indicated the minimum free energy value.
Because of the trnF occupancy, the boundaries of nad5 in H. blomquisti changed. Due to the tRNA reannotation, the NCRs also were changed. In a previous study, the NCRs were located in rrnS-trnV, trnF-trnA. After the revision, one conserved site-specific NCR was identified between trnF-trnS1, with high AT content. The other NCR was still located in rrnS-trnV, with the length increased to 1598 bp (Table 2).
Reannotation of six tRNA genes for Histiostoma feroniarum
In previous work, 16 of 22 tRNA genes (trnC, trnV, trnQ, trnF, trnW, trnI, and 10 other tRNAs) were predicted using tRNA programs; the other six were identified manually [18].
In this study, we used manual annotation to reannotate trnF, trnW, and trnI of H. feroniarum. Our trnF for H. feroniarum was identified by manual alignment and was conserved with the reannotated trnF in H. blomquisti (Table 3). In our analysis, trnW was reannotated by sequence alignment. This sequence also had fewer mismatches (Table 3). In the previous study, the D-loop trnI with the less common anticodon sequence AAU was reported in H. feroniarum [18], but D-loop trnI had never been reported in other Astigmatina. Our trnI was reannotated manually based on anticodon sequences and secondary structures. In our study, we also observed the less common anticodon sequence AAU. We inferred this reannotated trnI to be a TV-loop structure. This sequence was aligned to H. blomquisti but was the only other remaining member of Histiostomatoidea. The reannotated trnI presented considerable similarity (Table 3).
To select the most probable tRNAs, minimum free energy (MFE) was calculated for three tRNA genes (trnC, trnV, trnQ). We found smaller MFE values than in previous annotations. In our study, trnC was retrieved between trnS2 and trnP, and trnV was retrieved between 12S and 16S, whereas the positions were coincidentally the opposite from those predicted by Xue et al. [18]. Our trnC had common anticodon sequences GCA among astigmatid mites, whereas the previously described trnC used ACA instead of GCA in anticodon sequences. When we calculated MFE, both trnC and trnV in our study were more thermodynamically stable (Fig. 2). After reannotation, the trnV had 52 bp overlapping with the contiguous rrnS on the same chain. Notably, the previously described trnQ was annotated on the J-strand at the 3’ end of nad5 [18], but many mismatches on stems and arms were found in this position. In fact, most nucleotides of trnQ among Astigmatina were highly conserved, and when located on the N-strand downstream of trnS1, the reannotated trnQ had a smaller MFE.
After amendment of the tRNA genes, the boundaries of nad2 of H. feroniarum changed because of trnI occupancy. We also observed changes to the rrnL size of H. feroniarum on account of trnW occupancy (Table S1). With alignment by Clustal W 2.0, the rrnL boundaries of the two Histiostoma species were more conserved. In addition, we changed one position of the NCR because of the reannotation of trnW and trnI. After the revision, we could identify one conserved site-specific NCR with high AT content between trnW and nad1.
Notably, the reannotations of H. blomquisti and H. feroniarum mitogenomes led to the mtDNA gene order for both Histiostoma species sharing the gene arrangement of a possible common ancestor of astigmatid mites, excluding the different locations of non-coding regions (Fig. 3).
Fig. 3. Mitochondrial gene arrangements in the sarcoptiform mites. The arrow pointing to the right represents the (+)-strand, and the arrow to the left the (−)-strand. Translocated or inverted genes are color-coded (green: inversion and translocation; pink: translocation; yellow: inversion). rRNA genes are in blue. The possible common ancestor among astigmatid mites is found in different genera and families. Species marked with a star: tRNAs reannotated in our study. Species marked with a triangle: the gene order in previous studies.
Retrieving the “lost” mt tRNA genes in Trouessartia rubecula
In Trouessartia rubecula, Esteban et al. predicted tRNAs based solely on the MITOS WebServer, and five tRNA genes (trnA, trnE, trnI, trnY, and trnV) were not identified [23]. In protein annotation, the common start codon is ATN, but the cox1 gene start codon of T. rubecula is the uncommon TCT. T. Rubecula was reported to contain three D-loop sequences. The lengths of these non-coding regions are abnormally short, and the location of these region is different from the common non-coding regions.
In the current study, we used tRNAscan-SE, ARWEN, and MITOS 2 to predict the missing trnE, trnI, and trnY, and we annotated trnA and trnV using manual comparison. The secondary structure with the smallest constrained MFE was considered to be the most likely one (Fig. 4). We verified the tRNA genes of the two sarcoptiform mites by comparison of secondary structures and conserved nucleotide sequences with several Astigmatina species (Table 4). Nucleotides that pair at the arms (acceptor arm, D arm, anticodon arm, and T arm) are underlined in the figure. We analyzed the codon usage in the mt protein-coding genes of the 17 species of astigmatid mites to see whether and how the corresponding codons of the “lost” tRNA genes were used. Overall, the codon use was similar between Tr. rubecula and other astigmatid mites (Fig. 5).
Note: Bars indicate Watson Crick base pairings; dots and circles represent GU pairs and mismatched pairs, respectively. MFE indicated the minimum free energy value.
Table 4 The alignment of nucleotide sequences of two mitochondrial tRNA genes (trnA and trnV) in six species: Conserved nucleotides are shaded in gray across these five mites.
Note: Nucleotides that pair at the arms (acceptor arm, D arm, anticodon arm, and T arm) are underlined. Sequences of anticodons are in boldface. Aleuroglyphus ovatus (Ao), Caloglyphus berlesei (Cb), Rhizoglyphus robini (Rr), Dermatophagoides farinae (Df), Ardeacarus ardeae (AA), and Trouessartia rubecula (TR) in our study.
Fig. 5 Relative synonymous codon usage (RSCU) and codon numbers of 22 amino acids (a, c, d, e, f, g, h, i, k, l1, l2, m, n, p, q, r, s1, s2, t, v, w, and y) in the mitochondrial (mt) genomes of astigmatid mites. The X-axis indicates the astigmatid mites; the Y-axis indicates the RSCU or total number of codons. The blue column indicates the codons that are complimentary to the anticodons of their corresponding mt tRNA. The red, green and purple columns indicate the imperfect, synonymous codons to the anticodons of their corresponding mt tRNA genes.
After revision, we reannotated the position of the cox1 gene. The reannotated cox1 gene had a length of 1536 bp and had ATA as the initiation codon rather than the uncommon start codon TCT identified in a previous study. The result from BLASTn supported our boundaries for cox1. The LNR (301 bp in length) was arranged in the same way as most LNRs in the available sequences for astigmatid mites.
New insight into astigmatid mitochondrial gene arrangement
Compared with Limulus polyphemus as the hypothetical ancestor of arthropods, gene orders were rearranged in the mitogenomes of 17 astigmatid mites (Fig. 3). We found that the mitogenomes of 13 astigmatid mites from six superfamilies (Glycyphagoidea, Acaroidea, Analgoidea, Sarcoptoidea, Pterolichoidea, and Hemisarcoptoidea) shared a consistent gene order, indicating that this gene arrangement was from the possible common ancestor of astigmatid mites. The mitogenomes of Histiostoma blomquisti, Histiostoma feroniarum, and Acalvolia sp. represented three types of gene arrangements resulting from the different locations of the non-coding regions from the gene arrangement of the possible common ancestor of astigmatid mites (Fig 3). The mt gene order of Tyrophagus longior was rearranged compared with other astigmatid mites because of tRNA loss.
Phylogenetic analysis
We constructed a phylogenetic tree based on a nucleotide data set from 13 mt PCGs of 17 astigmatid mites. The ML and BI analyses showed fully consistent topologies, and we provided the percentage of the bootstrap support at each node. The phylogenetic tree showed that the monophyly of Glycyphagoidea recovered with strong support (BPP = 1 and BSP = 100%), as well as the monophyly of Acaroidea, Hemisarcoptoidea, and Histiostomatoidea (Fig. 6). The monophyly of two superfamilies, Analgoidea and Sarcoptoidea, was always rejected. The logical next steps would be the integration of more astigmatina mitogenomes, including species from each of the six superfamilies.
Fig. 6 Phylogenetic tree inferred from mitochondrial genome sequences using maximum likelihood and Bayesian methods. Branch lengths presented here follow the Bayesian methods analysis. Node numbers indicate Bayesian posterior probabilities (BPP) and maximum likelihood bootstrap proportions (BSP). * indicates clades with BSP <70%.