1. Year of registration
We first examined the Year of Registration (Fig. 2 and Additional File 5). For the India-only subset there was a slow beginning in 2007, a jump in 2009, a steady rise until 2011, followed by an uneven plateau until 2016, with a jump again in 2017 and a drop in 2018. The India-etc started slowly, jumped up in 2009, plateaued until 2012, saw a drastic drop in 2013, and then remained subdued until a large spike in 2017, and a drop in 2018. In both sets, the low figures for 2018 essentially reflected only the first three months’ registrations. With both the India-only and the India-etc sets, there was about a two-and-a-half fold increase (from 163 to 392 cases and from 31 to 81 cases, respectively) from 2016 to 2017.
2. Phase of trial
Next, we explored the Phase of Trial field (Fig. 3 and Additional File 6). The options for this field were Phase 1, Phase 1/2, Phase 2, Phase 2/3, Phase 3, Phase 3/4, Phase 4, N/A (not available) and PMS.
For the India-only set, Phase 3 trials were the most numerous, with 421 (25%) cases, followed by Phase 4 (386 trials, or 23%), Phase 2 (123, 7%), Phase 1 (62, 4%) and Phase 3/4 (59, 4%) trials. There were also low numbers of PMS studies (55, 3%), and Phase 2/3 (37, 2%) and Phase 1/2 (17, 1%) trials. Notably, there were 495 (30%) trials for which phase information was N/A.
The India-etc set followed a somewhat different trend. In decreasing order they were Phase 3 (429, 71%), Phase 2 (102, 17%) and Phase 4 (31, 5%) trials. There were also low numbers for Phase 3/4 (14, 2%), Phase 1/2 (12, 2%), Phase 2/3 (9, 2%) and Phase 1 (1, 0.2%) trials. Although there were no PMS studies, there were eight (1%) cases for which phase information was N/A.
3. Sites of study
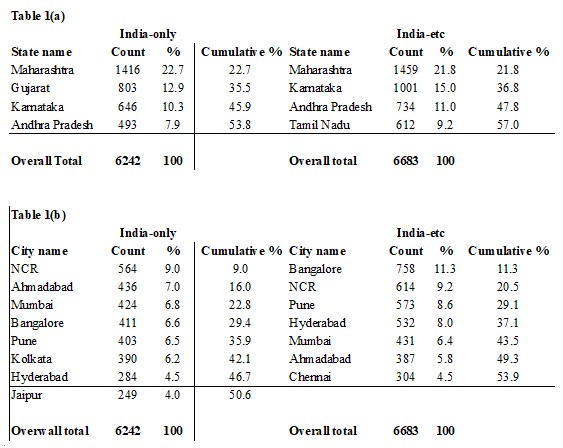
We next looked at Sites of Study (Table 1, Additional File 7 and Additional File 8). For the India-only set, four states accounted for over 50% of the sites. These were Maharashtra (1,416 trials, or 23%), Gujarat (803, 13%), Karnataka (646, 10%), and Andhra Pradesh (493, 8%). Within these states, the cities that accounted for 50% or more of the trials were, respectively, (i) Pune (403 or 29%) and Mumbai (391, 28%); (ii) Ahmadabad (435, 54%); (iii) Bangalore (407, 63%); and Hyderabad (284, 58%). A total of 11 states or union territories accounted for 90% of the trial sites. Aside from the four states listed above, these were Delhi (8%), Uttar Pradesh (7%), West Bengal (7%), Tamil Nadu (6%), Rajasthan (5%), Chandigarh (3%), and Pondicherry (1.5%).
Table 1. For the 1,655 India-only and the 606 India-etc trials (a) the top states and (b) the top cities in which, cumulatively, 50% or more of the trials took place.
Next, we set aside the state-wise point of view, and looked at the distribution of trial sites among cities and towns (hereafter, cities) directly. The India-only trials were hosted by 164 cities, of which eight accounted for 50% or more of the sites. These were the National Capital Region, or NCR, (564, or 9%), Ahmadabad (436, 7%), Mumbai (424, 7%), Bangalore (411, 7%), Pune (403, 7%), Kolkata (390, 6%), Hyderabad (284, 5%), and Jaipur (249, 4%). Except for NCR (which comprises cities from different states), Kolkata and Jaipur, all of these cities belong to the four top-listed states.
For the India-etc set, too, four states accounted for over 50% of the sites. These were Maharashtra (1,459 trials, or 22%), Karnataka (1,001, 15%), Andhra Pradesh (734, 11%), and Tamil Nadu (612, 9%). Within these states, the cities that accounted for 50% or more of the trials were, respectively, (i) Pune (573 or 39%) and Mumbai (411, 28%); (ii) Bangalore (749, 75%), (iii) Hyderabad (532, 73%), and (iv) Chennai (304, 50%). A total of 11 states or union territories, including ‘null’, accounted for 90% of the trial sites. Aside from the four listed above, these were Gujarat (9%), Delhi (7%), Rajasthan (5%), Uttar Pradesh (4%), West Bengal (4%), Null (4%), and Kerala (3%).
We then set aside the state-wise point of view, and looked at the distribution of trial sites among cities directly. The India-etc trials were hosted by 121 cities, of which seven accounted for 50% or more of the sites. These were Bangalore (758, or 11%), NCR (614, or 9%), Pune (573, 9%), Hyderabad (532, 8%), Mumbai (431, 6%), Ahmadabad (387, 6%), and Chennai (304, 5%). Except for NCR and Ahmadabad, all of these cities belong to the four top-listed states.
Coming specifically to the case of Phase 3 trials, the India-only and India-etc sets of trials took place in 130 and 112 cities respectively (Additional File 8). 50% or more of the trials took place in eight and seven cities, respectively, and the four cosmopolitan cities of Bangalore, Hyderabad, Mumbai, and NCR were on both these lists.
4. Details of ethics committees
Trials may have taken place at multiple sites, for which the trialists may have taken approval from multiple ethics committees. Therefore we looked at the Details of Ethics Committee field (Fig. 4 and Additional File 9), and examined how many ethics committees were required to approve a given trial. We noted a maximum of 61 committees for an India-only trial and 66 ethics committees for an India-etc trial. Although the maximum values were broadly similar, the distribution of the number of ethics committees per trial was quite different. For the India-only set, 71% of the trials had just one committee, whereas for the India-etc set, it was required for just 6%. Finally, whereas the India-only set had 156 (9%) trials with more than 10 ethics committees, the India-etc set had 227 (38%).
5. Details of Principal Investigator
We went on to ask how many doctors were involved as Principal Investigators (PIs) and which of them had run the most trials. For this, we examined the field Details of Principal Investigator or overall Trial Coordinator (multi-center study) and our findings are reported in Fig. 5 and Additional File 10.
After obtaining the list of PIs, the names were cleaned up by removing prefixes and by accounting for obvious variants of a given name. We then examined the distribution of the number of trials run per PI. A PI was not listed for 90 (5%) of the India-only set, and 245 (40%) of the India-etc set. We excluded these trials in the calculations of this section.
There were 1,131 PIs associated with the truncated set of 1,565 India-only trials. Of these, 946 (84%) PIs had run a single trial. A mere 110 (10%) had run two, and there was a steady decrease in the fraction of PIs who had run more than two trials. Seven PIs had run 10 or more (10, 10, 11, 13, 13, 16 and 39) trials, with a maximum of 39 trials run by a single PI. Four of these seven PIs were affiliated to local pharma companies and three to public hospitals. 75% of the trials had been run by PIs who had run 1–2 trials each.
There were 180 PIs associated with the truncated set of 361 India-etc trials. Of these, 132 (73%) PIs had run a single trial. A mere 28 (16%) had run two, and there was a steady decrease in the fraction of PIs who had run more than two trials. Four PIs had run 10 or more (10, 21, 33 and 44) trials, with a maximum of 44 trials run by a single PI. All four PIs were affiliated with well known multinational pharma companies. 52% of the trials had been run by PIs who had run 1–2 trials each.
6. Details of primary sponsors
We went on to determine the identity of the primary sponsors of the India-only and India-etc trials, and also the classification of these sponsors. For this, we examined the field Primary Sponsor, and its sub-fields.
We first determined the identity of the primary sponsors of the 1,655 India-only set of trials (Additional File 11). The raw data indicated that there were 965 unique sponsors. However many organizations were represented by variants of their names, and after manually correcting for these errors, there were 580 unique sponsors. The top 10 sponsors were the All India Institute of Medical Sciences, Delhi (4.2%), the Jawaharlal Institute of Postgraduate Medical Education and Research (3.9%), Null (3.6%), the Postgraduate Institute of Medical Education and Research (3.6%), Ajanta Pharma Limited (3%), Cadila Healthcare Ltd (2.4%), the Tata Memorial Center/Tata Memorial Hospital (2.2%), Cipla (2.1%), Indican Council of Medical Research (1.9%), and Christian Medical College, Vellore (1.9%). These sponsors accounted for 29% of the trials in this set.
Next we examined the classification of the primary sponsors of this set of trials (Additional File 12). The sponsors fell into 139 categories, including 131 variants of ‘Others’. However many organizations were classified in two or more ways. After manually correcting for these errors, we identified 99 categories, include 88 variants of ‘Others’. The top five categories were Pharmaceutical industry-Indian (29.4%), Research institution and hospital (22.2%), Government medical college (16.3%), Private medical college (5.7%), and Pharmaceutical industry-Global (4.6%).
We went on to determine the identity of the primary sponsors of the 606 India-etc set of trials (Additional File 13). The raw data indicated that there were 272 unique sponsors. However many organizations were represented by variations of their names, and after manually correcting for these errors, there were 178 unique sponsors.
The top 10 sponsors were Novartis Healthcare (11.9%), Pfizer (7.4%), Sanofi Synthelabo India (4.5%), Novo Nordisk (4.0%), AstraZeneca (3.5%), Merck Sharp and Dohme (3.3%), Boehringer Ingelheim Pharmaceuticals (2.6%) Gilead Sciences (2.3%), Novo Nordisk India (2.3%), and GlaxoSmithKline Pharmaceuticals (2.1%). These sponsors accounted for 44% of the trials in this set.
We next examined the classification of the primary sponsors of this set of trials (Additional File 14). The sponsors fell into 13 categories, include seven variants of ‘Others’. However many organizations were classified in two or more ways. After manually correcting for these errors, we identified 11 categories of sponsors, include five variants of ‘Others’. The top five categories were Pharmaceutical industry-Global (91.7%), Government funding agency (2.6%), Pharmaceutical industry-Indian (1.8%), Research institution (1.2%), and Research institution and hospital (1.2%).
In both sets of data, except for sponsors classified as ‘Indian’ or ‘Global’, there was no separate identification of whether an organization was foreign or Indian.
7. Number of subjects from India and elsewhere in India-etc trials
For the 606 India-etc set of trials we then looked at the fraction of trial participants from India, out of the total for a given trial, phase-wise. As mentioned in section 2, Phases 1 (1 trial, or 0.2%), 2 (102, 17%), 3 (429, 71%) and 4 (31, 5%) accounted for 563 (93%) trials (Additional File 15). The remaining 43 (7%) trials comprised phases 3/4, 1/2, 2/3 and N/A trials, which we did not investigate.
Within Phases 1, 2, 3 and 4, separately we examined the planned recruitment from India, as a fraction of the total recruitment. The data was binned as follows: 0–20%, 21–40%, 41–60%, 61–80% and 81–100% (Fig. 6 and Additional File 15). There was only one Phase 1 trial, and this was in the 0–20% bin. For the Phase 2–4 trials, most did not exceed 40%, and for each of these phases, less than 10% of the trials exceeded 60%.
Overall, the planned recruitment from India exceeded 60% of the total in 29 trials. The break-up was 10, 17 and two trials in Phases 2, 3 and 4 respectively. An examination of the sponsors of these trials shows that in Phases 2, 3 and 4, 4 (40%), 3 (17.6%) and zero (0%) trials, respectively, were sponsored by Indian, or Indian-origin, companies (Additional File 15). Two trials (one each in Phases 2 and 3) were sponsored by foreign non-profits.
We went on to examine the planned versus actual recruitment from India (Additional File 16). Out of 606 trials, for 310 (51%) this calculation could not be done because they were neither completed nor terminated. Further, for 281 (46%) trials, the CTRI records were not updated with the final numbers. For 13 (2%) trials, both the planned and final numbers were available. In most of these cases, the two numbers were similar. However, in one case the fraction from India jumped from 10% (planned) to 100% (actual), and in another from 60% to 80%.
8. Details of the countries co-hosting the India-etc trials
By definition, the India-etc trials took place in India and one or more other countries. We identified the top 10 co-host countries of these trials (Additional File 17): USA (co-hosted 65% of the trials), Russian Federation (49%), Germany (48%), Canada (46%), Poland (43%), Spain (42%), UK (41%), Italy (39%), France (38%) and Hungary (36%). We also examined the distribution of how many countries were involved per trial. 9% of the trials ran in two countries, 17% in 3–5, 19% in 6–10, 14% in 11–15, and 42% in more than 15 countries (Fig. 7 and Additional File 17).