
Abstract
This paper introduces a novel mass timber construction (MTC) system and presents the results of an initial exploration of its structural performance. This system is called Interlocking Glued Solid Timber (IGST) and employs standard-sized solid timber joists, glued together in overlapping patterns. Diagonal cuts are utilised in order to bond adjoining elements. For the purposes of the tests described in this paper, a total of 70 spruce joists were collected at a sawmill and categorised via dynamic modulus of elasticity measurements. Materials testing provided the compressive strength perpendicular to the grain and the shear strength parallel to the grain. Three different types of IGST prototypes were manufactured and tested to failure in a four-point bending test. An additional two series were tested, one of solid joists and one of a glued joist. Three-dimensional finite element models (FEM) were also developed to perform numerical analyses. The results demonstrated that the ultimate capacity of one type of IGST prototype was very similar to that of a solid joist of equal cross-section. As the IGST prototype is scalable, it allows for applications similar to other MTC systems. Finally, the FEMs were generally accurate in predicting the performance of the IGST assemblies, thus allowing them to be used to simulate performance.
1 Introduction
Mass timber construction (MTC), typically considered to refer to engineered wood systems such as glued laminated timber (glulam), laminated veneer lumber (LVL), and cross-laminated timber (CLT) has seen considerable advances in recent years [1, 2]. Beyond the well-known benefits of timber as a renewable material with high strength-to-weight ratio and good insulation properties [3], MTC has also been shown to offer lower whole lifecycle environmental impact in comparison to concrete and steel [4, 5]. In current MTC research and practice, CLT holds a dominant role with significant advances over the past two decades [6], though some concerns about the overall awareness of the material amongst the greater design community remain [7, 8]. Nonetheless, the potential of MTC remains strong, with a capacity not only for low- and mid-rise buildings, where it is currently typically employed, but also for high rise, as conceptual studies demonstrate [9, 10].
The aim of this paper is to introduce a novel MTC system and present the results of initial analytical, computational, and experimental work towards its development. We call this system Interlocking Glued Solid Timber (IGST) and we envisage it as a potential alternative and/or complement to both glulam and CLT, which could also be employed effectively in platform frame systems. We consider that, with further improvement and optimisation, it can deliver larger cross-sections, with greater spans. Simultaneously, it builds on parallel developments, such as those in glued solid timber.
1.1 The concept
IGST employs standard-sized solid timber joists as constituent elements, glued together in overlapping patterns, in order to form large-scale engineered wood members. Moreover, elements are glued in two dimensions: IGST layers are assembled by gluing on the z axis (applying the glue on the xy planes), and then these layers are glued together to form a complete element, gluing along the y axis (applying the glue on the xz plane), as demonstrated in Fig. 1.

The IGST concept. a Built-up of the IGST layers from diagonally-cut components, glued on the xy surfaces). b Gluing of layers (glued on the xz surfaces). c Example of small IGST element
In contrast to glulam and CLT, IGST does not utilise finger joints, but simple diagonal cuts to bond adjoining elements. In the work described in this paper, a diagonal cut with a 4:1 slope across the x–z axes was selected, however, different types of cut, as well as different orientations can be used.
By utilising standard softwood joists, and thus significantly bigger cross-section sizes than typical glulam and CLT laminations, IGST requires fewer glued interfaces achieving both glue economy and less manufacturing time. Moreover, finger joints usually act as weak points in highly stressed areas (e.g. tensile zones in bent beams), where they de facto represent a crack-similar vertical discontinuity, only limitedly overcome by the presence of glue, although this effect can be somewhat reduced via appropriate finger sizing. In contrast, the overlapping of the members is used to achieve strength across the length. Finally, it is envisaged that the use of standard softwood joists would provide inventory flexibility to manufacturers, as the constituent elements of an IGST member could be sourced from the standard stock and sold independently if needed.
Related concepts, precedents to IGST, include structural finger-jointed timber [11], glulam and glued solid timber [12], block glulam [13], as well as commercial products such as Bilam and Trilam beams [14]. However, as the concept is new, it was deemed necessary to examine the performance of the core mechanisms behind IGST, namely the performance of the diagonal joint, both in isolation, and as part of a composite member. For that purpose, an experimental programme was set up, supplemented by analytical and computational work. As a first step, the manufacturing of small prototypes was performed in laboratory conditions so that all the steps of the process could be easily controlled; the prototypes were then mechanically tested. The experimental results and the accompanying theoretical analysis, are presented here. The industrialization potential of the product should be also evaluated and studied in a later stage.
2 Materials and methods
2.1 Specimens and manufacturing information
A total of 70 spruce (Picea abies) joists of nominal cross section 48 × 100 mm2 were collected in a sawmill. Their dynamic modulus of elasticity was measured by a ViSCAN grading machine (ViSCAN-portable by MiCROTEC): each piece was placed on supports and a percussion provided the excitation necessary to cause vibration; the natural frequency of vibration was measured by a non-contact laser interferometer. The weight and dimensions were also measured and the dynamic modulus of elasticity was by the formula described in Eq. (1), originally suggested for use in timber by Kollmann and Krech [15]:
where f is the natural frequency of vibration, L the length of the timber piece and ρ is the density, calculated by the timber weight divided by its volume. The joists were ranked according to their dynamic modulus; they were arranged in 5 quality groups with 14 pieces each, in order of ascending stiffness, i.e. group number 1 was the one with the lowest stiffness and group number 5 the highest.
One joist from each group was kept for material testing, as described in Sect. 2.2. The rest of the joists were used for the manufacturing of the beams in the main testing programme, as per Sect. 2.3.
The manufacturing of the IGST involved several steps: firstly, the monoaxial members were produced by gluing the diagonal cuts; then the solid and jointed joists were edge-glued; finally, the layers obtained were face-glued to form the beam. Before gluing, the joists were kept in a climatic chamber at 20 °C and 65% of relative humidity for conditioning; then planed and glued soon after. A polyurethane adhesive (PUR) (HB 440, Purbond) was used for the various joints. The gluing conditions were differentiated between diagonal gluing and edge/face gluing: the adhesive quantities were 150 g/m2 (spread on both surfaces) and 200 g/m2 (spread on one surface) respectively for diagonal and edge/face gluing; the pressing times were 100 min and 2.5 h, respectively; pressures were 0.8 and 0.7 MPa, respectively. Due to the limited size of the laboratory press, the maximum length of the specimens was 1.2 m.
2.2 Material testing programme
Two series of material tests were conducted, in order to establish core material properties: compression perpendicular to the grain, and shear parallel to the grain. The moisture content of all samples was also measured.
2.2.1 Compressive strength perpendicular to the grain
The tests to determine the compressive strength perpendicular to the grain were conducted according to ISO 3132 [16]. A total of 50 tests were conducted, 10 for each joist group. The specimens had a cross-section of approximately 20 × 20 mm perpendicular to the grain and a length of 30 mm along the grain. The end surfaces were appropriately prepared so that they were plane and parallel to one another. As the ring orientation has a significant impact on the tested compressive strength [17], the tests were distributed so that there was a variety of angles between the ring orientation and the load: parallel to the load (0°), at an angle to the load (45°), and perpendicular to the load (90°). The aim was to have a roughly equal distribution between the three angles in the ten tests (3–4–3 respectively).
Prior to testing, the two dimensions of the bearing area were measured with a digital calibre, then the specimen was located on the plate of a universal testing machine (Mod. 5567, produced by Instron, load capacity 50 kN, load cell accuracy ± 0.5%) and the load was applied continuously, at a constant rate of movement of the loading head, such as the proportional limit was reached in approximately 1.5 ± 0.5 min.
ISO 3132 utilises the load–deflection curve for the calculation of the proportional limit, using the following approach:
The angle between the load–deflection curve and the load axis (vertical axis), at the elastically linear segment of the load–deflection curve is identified.
For the non-linear segment of the load–deflection curve, the angle between the tangents at consecutive points of the load–deflection curve and the load axis (vertical axis) are identified.
At the first point in the non-linear segment where the angle between the tangent and the load axis is greater than 50% of the respective value in the elastically linear part, the ordinate on the load axis is taken as the load to the proportional limit.
The conventional compressive strength was then calculated as the ratio between the load at the proportional limit and the bearing area of the specimen.
The mean compressive strength perpendicular to the grain fc,90 was 4.70 MPa (CoV = 0.23) for specimens with an angle 0° between ring orientation and load, 2.74 MPa (CoV = 0.17) for specimens with an angle of 45°, and 4.10 MPa (CoV = 0.24) for specimens with an angle of 90°.
Overall, the samples had a mean compressive strength perpendicular to the grain fc,90 = 3.74 MPa, with a Coefficient of Variation (CoV) of 0.38, and a mean moisture content of 11.6%.
2.2.2 Shear strength parallel to the grain
The tests to determine the ultimate shear stress parallel to the grain were conducted according to ISO 8905 [18]. A total of 150 tests were conducted, 30 for each joist group. The specimens had a stressed area of approximately 45 × 50 mm2.
As before, the dimensions of each specimen were measured before the test by a digital calibre; after the proper positioning of the specimen, the load was applied at a constant rate of movement of the loading head till the failure was reached. The maximum load (the load at failure) was recorded by the machine and the shear strength was calculated as the ratio of the load at failure and the area of the specimen.
Overall, the samples had a mean shear strength fv = 7.46 MPa, with a Coefficient of Variation of 0.19, and a mean moisture content of 12%.
2.3 Beam testing programme
Five series of tests were conducted. These were of increasing geometric and manufacturing complexity, in order to establish the performance of the constituent elements, the diagonal glued joint, the overlap of the members, and different cut configurations. The experiment series were:
Series A: Single continuous joist (C) (Fig. 2a).
Fig. 2 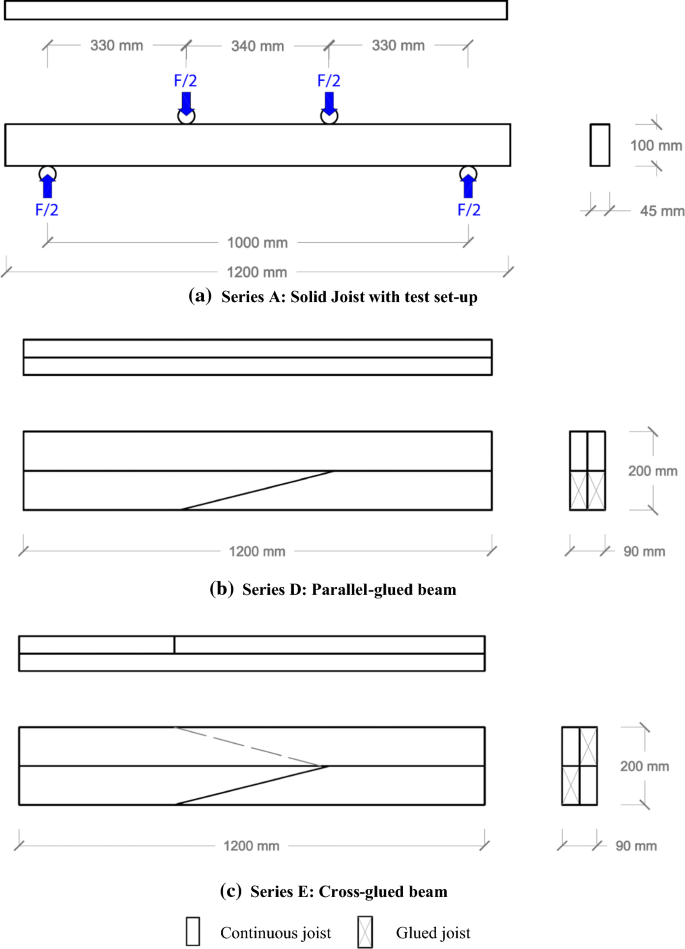
Specimen arrangements for the experiments: Series A, D, and E
Series B: Diagonally cut joist with glued joint (G).
Series C: Two superimposed joists; a continuous joist over a one cut-and-glued.
Series D: Four joists, consisting of two layers of superimposed joists, glued along their length, arranged so the cuts and the C & G joists are parallel.
Series E: Four joists, consisting of two layers of superimposed joists, glued along their length, arranged so the cuts and the C & G joists are cross-facing (Fig. 2b).

Drawings of all the test series can be found in the supplementary material.
Each test series consisted of five tests, with each test utilising a specimen from one of the different joist quality groups. As such, all series tested samples from all joist groups, allowing for comparisons between them, ensuring that the variability and the quality of the raw material was roughly the same for all the test series.
The tests performed were four-point bending tests. The testing apparatus was a Z600 universal testing machine (produced by Zwick-Roell, load capacity 600 kN, load cell accuracy 1%); the deformations were measured via HBM inductive displacement transducers with an accuracy of 0.1%. The specimens were tested at 1 m spans, with the loading applied at 330 mm distances from the end of the span (Fig. 2a).
In series A and B, the tests were used in order to derive bending stiffness (Modulus of Elasticity-MOE), and then the bending strength (Modulus of Rupture-MOR). In series C to E, the tests were used to establish the shear strength, though some mixed failure modes were observed, including compression perpendicular to the grain, as will be discussed further on.
The global static modulus of elasticity was calculated according to Eq. (2) of EN 408 [19], with the assumption of infinite shear rigidity; the displacement was measured in the tension side, referred to the entire span. EN 408 provides two methods for the determination of the static modulus of elasticity in bending, defined as the “local” (Elocal) and “global” (Eglobal) modulus. In the Elocal determination method the mid-span deflection is measured; it represents the pure bending deflection, without taking into account any shear effects. The Eglobal determination method provides the measurement of the total deflection, combining bending and shear deformation.
The local static modulus of elasticity was calculated according to Eq. (1) of EN 408; the local displacement was measured on both the lateral sides of the beam, along the neutral axis with a gauge 240 mm long. The bending strength parallel to the grain was calculated according to Eq. (17) of EN 408.
2.4 Numerical model
A three-dimensional finite element model was constructed to perform numerical analyses and yield the elastic properties of a homogeneous orthotropic material for each MOE test. Although a two-dimensional model could have been employed with the use of shell elements for this set of analyses, the three-dimensional model was preferred because future work includes the execution of numerical analyses with material nonlinearity; it was, thus, deemed preferable to use the same model for these two related studies.
The open source finite element solver code_aster [20] was used to perform the linear analyses, linear both in terms of material stress–strain and strain–displacement relations, while the open source simulation platform Salome [21] was used to create the geometry and the mesh of the numerical model. Three-dimensional, 8-noded, linear solid elements were used to represent the wood boards.
The dimensions of the numerical model were based on the average characteristic dimensions of all the specimens. Thus, the height of the cross-section was equal to 97.5 mm for Series A and B and equal to 195 mm for Series C, D and E. The width of the cross section was equal to 45 mm for Series A, B and C and equal to 90 mm for Series D and E. The length of the beam was equal to 1173 mm. Due to geometric and loading symmetry, only half of the beam was considered in the numerical model restraining the horizontal displacement of the vertical section at the middle of the beam. The vertical force and the vertical reaction force were both applied at the respective upper and lower horizontal areas of the beam according to the actual configuration.
One of the features of code_aster is the possibility to perform parameter identification studies to find the optimal values of user-defined parameters so as to match numerical predictions from finite element simulations with experimental results. In this study, a two-parameter identification scheme was applied using the mid-span and total deflections measured for each specimen at the corresponding acting force. A similar approach has been presented in [22]. The first parameter was the MOE parallel to grain E0 of a single homogeneous material, while the second parameter was the shear modulus for planes parallel to grain G0. The MOE perpendicular to grain E90 was considered instead as a constant fraction of E0 (E0/E90 = 30) and the rolling shear modulus G90 as a constant fraction of G0 (G0/G90 = 10). The three Poisson’s ratios were considered equal to 0.35. For each test, these two parameters were identified so as to yield the same mid-span and total deflections measured for the same acting force.
3 Experimental results
3.1 Modulus of elasticity
For a solid and a basic glued joist, the Modulus of Elasticity (MOE) was measured via the four-point bending test. The mean global MOE for the solid joist was Eg,mean = 10.4 GPa (CoV = 0.12), while the mean global MOE values for the glued joist were Eg,mean = 9.6 GPa (CoV = 0.15). The respective mean local MOE values were 14.7 GPa (CoV = 0.14) for the solid joist and 13.5 GPa (CoV = 0.19) for the glued joist. According to the Student-t test (\(\alpha = 0.05\)) the values related to Series A and B were statistically not different (in couples) (p > 0.2).
3.2 Loading at rupture
The mean loading at rupture was 19,516 N for Series A (45 × 100 mm cross-section), 18,430 for Series B (45 × 100 mm cross-section), 43,383 N for Series C (45 × 200 mm cross-section), 91,035 N for Series D (90 × 200 mm cross-section), and 102,112 N for Series E (95 × 200 mm cross-section).
Figure 3 shows load–deflection curves for each type of Series, indicative of the typical behaviour of the tested beams.

Load-deflection curves of the tested Series A to E
With regard to failure modes, it should be noted that, while the Series A and B showed clear failure in bending, Series C to E demonstrated a variety of failure modes. Specimen C1 failed due to lateral-torsional buckling, after which appropriate lateral restraints were placed on the following tests.
For Series C to E, the prevalent failure modes were either shear along the length, or shear combined with compression perpendicular to the grain at the supports. This was mainly due to the fact that the testing arrangement offered limited length, and thus the span-to-depth ratio was 5, much lower than the value of 18 recommended by EN 408.
4 Discussion
4.1 Comparisons with an analytical model
4.1.1 Comparison with solid timber-equivalent to the Eurocodes
As stated in the introduction, the main intention of the IGST concept is to provide a mass-timber alternative to glulam, with a more economical manufacturing process. The objective of the overlapping process is to allow for large cross-sections and spans, enhancing the strength of the final member, with fewer weak points compared to finger-jointing. One method to assess the success of the concept is to compare the performance of the specimens with the respective theoretical performance of a solid timber member of the same dimensions, as predicted from analytical models. The intention is to identify the efficiency of the interlocking/overlapping system: if an IGST member achieves similar strength as a solid member of the same strength class would, it would suggest that the system indeed performs well and is worthy of further optimisation and research.
For the purposes of this comparison, Eurocode 5 (EC5) was utilised [23]. According to the settings of the grading machine used to measure the dynamic modulus of elasticity of the solid joists, the material could be graded as C24, and the material properties used in the calculations are derived from this strength class, utilising the properties given in EN 338 [24]. The calculations were performed with a specially customised version of Teretron [25], a software application for structural timber design to Eurocode 5 [26].
As the testing was undertaken in a laboratory environment, the loads at failure measured experimentally are compared with the theoretical capacities of the members utilising safety factors of 1.0. Moreover, in order to have a meaningful comparison between the analytical model and the experimental results, the strength values used in these calculations are the means. As EN 338 provides characteristic, and not mean values, an empirical factor of 1.3 was used to derive mean values for C24 timber. Therefore, for all strength values below it should be assumed that:
where fmean the mean strength value used in the calculations, fk the characteristic strength value according to EN 338.
The relevant failure modes investigated are bending about the y–y axis, beam shear, and bearing (compression perpendicular to the grain). The maximum load was calculated for each failure mode.
The load at which the beam reaches its bending capacity was calculated according to Eq. (3), following Clause 6.1.6 of EC5.
where fm the mean bending strength about the y–y axis, Wyy the elastic section modulus about the y–y axis, L the span of the beam.
The load at which the beam reaches its shear capacity was calculated according to Eq. (4), following Clause 6.1.7 of EC5.
where Vmax the maximum shear force at failure, fv,k the mean shear strength, Aef the effective area in shear.
The effective area in shear was calculated according to Eq. (5).
where kcr the cracking factor taken as kcr = 0.67, b the width of the cross-section, h the depth of the cross-section.
The load at which the beam reaches its bearing capacity was calculated according to Eq. (6), following Clause 6.1.5 of EC5.
where: kc,90 a factor taking into account the load configuration, the possibility of splitting and the degree of compressive deformation, fc,90 the mean compressive strength perpendicular to the grain, Aef the effective contact area perpendicular to the grain.
Factor kc,90 has been taken as 1.5, when the distance between the loads l1 has been greater than 2 h, and 1.0 when it has been lower, following Clause 6.1.5(4) of EC5 for a member on discrete supports.
The effective contact area Aef has been determined according to Clause 6.1.5(1), where:
where b the width of the member, lef the effective contact length parallel to the grain.
The effective contact length parallel to the grain is given by the following equation.
where lb the actual contact length at the bearing, l1 an increase on the end side of the member, l2 an increase towards mid-span.
The length increases l1 and l2 are given by the following equations:
where a the distance between the support and the end of the member, lb the contact length at the bearing, lclear the clear distance between the bearing and the loading points.
According to this EC5-based analytical model, Series A and B fail in bending (load at failure Fk = 14 kN) while Series C, D, and E are likely to fail in either shear (load at shear failure for Series D & E Fk = 81.5 kN) or compression perpendicular to the grain (load at shear failure for Series D & E Fk = 76 kN) as the values are of similar magnitude. These predictions are in line with the observations mentioned above, where specimens also failed either in shear, or in combined shear and compression perpendicular to grain.
These theoretical values for a solid C24 member can be compared with the experimentally observed loads at failure for the beam Series that were tested. The results are shown in Table 1. It can be observed that Series E in particular achieves a ratio very similar to that of Series A, which is indeed a solid component. Moreover, the glued joint of Series B achieves a performance comparable to that of the solid material (6% lower). It should be noted, however, that this comes from a small number of tests, with significant variation, and more experiments would be needed to establish the performance of the joint comprehensively.
4.1.2 Comparison with the values obtained via material testing
A second set of comparisons can be made between the stresses developed at the experimentally tested IGST specimens at failure, and the strength values obtained for the source material at the materials testing phase described in Sect. 2.2. The methodology used to calculate these stresses follows Eurocode 5 as above, using the effective areas of the cross-section for shear and compression perpendicular to the grain.
The EC5 model was employed in order to account for size effects and failure modes due to local stresses. Analytical models intended for structural design, such as that of Eurocode 5, aim to provide an effective design tool while still using the material properties derived from smaller specimens. As such, it was considered that a comparison between the stresses at failure of the IGST test series and the smaller specimens utilised for the materials testing, would need to employ a design-focused analytical model (in this case based on EC5) for the former in order to be meaningful.
Table 2 shows a comparison between the stresses at failure for test series C to E, and the strength values parallel to the grain obtained via material testing.
It can be observed that the performance and variability of the IGST members is generally satisfactory, and roughly on par with solid timber members of the same cross-section. It should also be added that the shear strength used for comparison is substantial, due to the type of test performed. Shear tests with larger specimens, such as those mandated in EN 408, would have likely led to lower shear strengths, and thus even higher percentages in Table 2. It is indicative that EN 384 [27] caps the characteristic shear strength of solid timber to 4 MPa, corresponding roughly to a mean strength of 5.2 MPa.
More interestingly, the cross-glued pattern (Series E) showed a small but consistent increase in strength compared to the parallel glued members (Series D); indeed, all of the cross-glued specimens performed better than their parallel-glued counterparts made of the same boards.
Table 2 also demonstrates that, as expected, the experimental ultimate strength of the specimens was higher than the proportional limit identified in the materials testing. This helps explain the discrepancy between the predicted failure mode in the analytical model, which suggests failure due to compression perpendicular to the grain, and the experimentally observed failure, which was typically either in shear, or in mixed shear with compression perpendicular to the grain.
4.2 Comparisons with the numerical model
As the testing arrangement did not allow for bending testing according to EN 408, the performance of the specimens can be gauged indirectly via the numerical model. This was utilised in order to provide values for the MOE and the shear modulus parallel to the grain. The mean modulus of elasticity E0,mean was 14.89 GPa for Series A, 13.32 GPa for Series B, 9.03 GPa for Series C, 9.06 GPa for Series D, and 11.31 GPa for Series E. The mean shear modulus G0,mean was 306 MPa for Series A, 270 MPa for Series B, 442 MPa for Series C, 348 MPa for Series D, and 353 MPa for Series E.
Figure 4 shows the probability density function (pdf) of the elasticity modulus based on a log-normal distribution. It can be observed that Series E performs relatively well, achieving a MOE of roughly 75% as that of the solid joist. The difference between Series A and D is considerable, however, with the latter achieving only 60% of the MOE of the former.

Plot of the probability density function for the modulus of elasticity parallel to grain
These values can be compared to the static local MOE values derived from first principles for Series A and B, in order to get some insights into the credibility of the results. Table 3 shows this comparison; the very good agreement between the values derived from the experiments and the numerical simulation suggests that the results could be accurate for the more complex assemblies of Series C to E.
A similar comparison can be made between the stresses at failure according to the numerical model, and the stresses at failure calculated basing on experimental results. Figure 5 shows the shear stresses τxz for series E at mean failure load, according to the numerical model.

Shear stresses of Series E at Mean Failure Load
The numerical simulations are in agreement with the analytical model and the experimental observations with regard to the failure type: bending failure for Series A and B, and shear or compression perpendicular to the grain failure for Series C to E. This suggests that the FEA model can be used to derive rough estimates of the performance of variants of the IGST model.
5 Conclusions and future work
The objective of the experimental project presented in this paper was to manufacture and test a series of prototypes of a novel concept we call Interlocking Glued Solid Timber. The key components that define the performance of IGST are the glued joint and the orientation of the overlap of the members.
The experimental programme covered both aspects. The capacity of the glued joint in isolation was tested against bending. Due to testing limitations, the bigger prototypes with overlapping members reached their capacity in either shear or compression perpendicular to the grain. The key results of the testing programme were:
The glued joint had a capacity in bending that was very similar to that of a solid joint of the same cross-section of the same materials. The mean bending strength at failure of the glued joints was 95% of the mean bending strength of the solid, uncut, joists.
Two types of full IGST prototypes were tested, Series D, with parallel-glued arrangement, and Series E, with a cross-glued arrangement. The cross-glued arrangement performed better than the parallel-glued arrangement, reaching rupture at a load that was 12% higher at mean value. This superiority was consistent across all samples, as all the cross-glued samples failed at a higher load than their counterpart parallel-glued samples of the same board.
The full IGST prototypes achieved capacities at shear and compression perpendicular to the grain that are generally on par with glulam equivalents. The parallel-glued samples had a mean shear strength equal to 145% of the characteristic value of C24, while the cross-glued samples had a mean shear strength equal to 163% of the characteristic value of C24. Given the manufacturing limitations, it is possible that these strengths would be even higher with factory-level manufacturing precision.
A finite element model has proven generally accurate in predicting the performance of the IGST assemblies. According to the numerical simulation, the cross-glued samples have a static local MOE of 75% of the source joists, while the parallel-glued samples perform less well, with an MOE of 61%.
The work presented in this paper is simply the first stage in the development of IGST and is meant to act as an initial exploration than a fully-developed proof-of-concept. The results have demonstrated the potential of the concept and suggest that further development can lead to useful outcomes. Future work will concentrate on addressing the limitations in the programme presented here, and explore more possibilities on IGST arrangements and joints. A new testing programme is currently in development, in order to perform bending tests on IGST samples according to EN 408. Moreover, a small number of alternatives for the glued joist will be investigated, exploring different layouts and orientations.
References
Fleming P, Smith S, Ramage M (2014) Measuring-up in timber: a critical perspective on mid- and high-rise timber building design. Archit Res Q 18(1):20–30
Harte AM (2017) Mass timber: the emergence of a modern construction material. J Struct Integr Maint 2(3):121–132
Porteous J, Kermani A (2013) Structural timber design to Eurocode 5. Wiley, Hoboken
Robertson AB, Lam FCF, Cole RJ (2012) A comparative cradle-to-gate life cycle assessment of mid-rise office building construction alternatives: laminated timber or reinforced concrete. Buildings 2(3):245
Liu Y, Guo H, Sun C, Chang W-S (2016) Assessing cross laminated timber (CLT) as an alternative material for mid-rise residential buildings in cold regions in China: a life-cycle assessment approach. Sustainability 8(10):1047
Brandner R, Flatscher G, Ringhofer A, Schickhofer G, Thiel A (2016) Cross laminated timber (CLT): overview and development. Eur J Wood Wood Products 74(3):331–351
Espinoza O, Trujillo VR, Mallo MF, Buehlmann U (2015) Cross-laminated timber: status and research needs in Europe
Laguarda Mallo MF, Espinoza O (2015) Awareness, perceptions and willingness to adopt cross-laminated timber by the architecture community in the United States. J Clean Prod 94((Supplement C)):198–210
Kuilen JWGVD, Ceccotti A, Xia Z, He M (2011) Very tall wooden buildings with cross laminated timber. Proc Eng 14((Supplement C)):1621–1628
Ramage M, Foster R, Smith S, Flanagan K, Bakker R (2017) Super Tall Timber: design research for the next generation of natural structure. J Archit 22(1):104–122
CEN, EN 15497:2014 Structural finger jointed solid timber. Performance requirements and minimum production requirements, 2014
CEN, EN14080:2013 Timber structures. Glued laminated timber and glued solid timber. Requirements, 2013
Aicher S, Stapf G (2014) Block glued glulam-bridges, beams, and arches. In: Salenikovich A (ed) Proceedings of the World Conference on Timber Engineering (WCTE 2014). Quebec City, Canada
Weinberger-Holz (2015) Best of Wood, Reichenfels, Austria. https://www.weinberger-holz.at/en/downloads/?513978290. Accessed 6 Feb 2019
Kollmann F, Krech H (1960) Dynamische messung der elastischen holzeigenschaften und der dämpfung ein beitrag zur zerstörungsfreien werkstoffprüfung. Holz als Roh-und Werkstoff 18(2):41
ISO, ISO 13061-7:2014 Physical and mechanical properties of wood—test methods for small clear wood specimens—Part 7: Determination of ultimate tensile stress perpendicular to grain, ISO, 2014
Ethington RL, Eskelsen V, Gupta R (1996) Relationship between compression strength perpendicular to grain and ring orientation. For Prod J 46(1):84
ISO, ISO 8905: 1988 Sawn timber—Test methods—determination of ultimate strength in shearing parallel to grain, ISO, 1988
CEN, BS EN 408:2010+A1:2012. Timber structures. Structural timber and glued laminated timber. Determination of some physical and mechanical properties, CEN, 2012
Code_aster, 2018. https://www.code-aster.org. Accessed 16 April 2018
Salome-Meca, 2018. https://www.code-aster.org/spip.php?article146. Accessed 16 April 2018
Christovasilis IP, Brunetti M, Follesa M, Nocetti M, Vassallo D (2016) Evaluation of the mechanical properties of cross laminated timber with elementary beam theories. Constr Build Mater 122:202–213
CEN, EN 1995-1-1:2004+A2:2014 Eurocode 5: Design of timber structures—Part 1-1: General—common rules and rules for buildings, CEN, 2014
CEN, EN 338:2016—Structural timber—Strengthclasses, 2016
Teretron—Software for Structural Timber Design to Eurocode 5, 2017. www.teretron.com. Accessed 6 Feb 2019
Patlakas P (2015) Development of a software application for timber design. Proc Inst Civ Eng 168(6):23–28
CEN, EN384:2016—Structural timber—Determination of characteristic values of mechanical properties and density, BSI, London, 2016
Acknowledgements
The authors want to thanks Paolo Burato, Paolo Pestelli, and Graziano Sani for the support during the laboratory testing.
Author information
Authors and Affiliations
Corresponding author
Ethics declarations
Conflict of interest
The authors declare that they have no conflicts of interest.
Human and animal rights
The work presented here did not involve Human Participants and/or Animals.
Informed consent
The work presented here did not involve Human Participants.
Additional information
Publisher's Note
Springer Nature remains neutral with regard to jurisdictional claims in published maps and institutional affiliations.
Electronic supplementary material
Below is the link to the electronic supplementary material.
Rights and permissions
Open Access This article is distributed under the terms of the Creative Commons Attribution 4.0 International License (http://creativecommons.org/licenses/by/4.0/), which permits unrestricted use, distribution, and reproduction in any medium, provided you give appropriate credit to the original author(s) and the source, provide a link to the Creative Commons license, and indicate if changes were made.
About this article

Cite this article
Patlakas, P., Brunetti, M., Christovasilis, I. et al. Structural performance of a novel Interlocking Glued Solid Timber system. Mater Struct 52, 27 (2019). https://doi.org/10.1617/s11527-019-1324-2
Received:
Accepted:
Published:
DOI: https://doi.org/10.1617/s11527-019-1324-2