
ABSTRACT
Hydrogeologic information is still scarce in the Amazon region being required more studies for improving the understanding of local hydrogeologic contexts. The goal of this paper, focused on the Urucu Oil Province, Brazilian Central Amazon, is to quantitatively estimate groundwater resources of the Içá-Solimões Aquifer System (ISAS) in the region. The work focuses on a balance between availability and water demand, considering current and future uses, contributing to a sustainable and integrated use of groundwater. Cartographic, lithologic and geophysical logs were analyzed coupled with ISAS hydraulic data (transmissivity, hydraulic conductivity, and storativity) and its local aquifer geometries, as well as the potentiometric surface map to estimate values of total and renewable groundwater resources, sustainable yields, and well-field facility capacities. Results showed the portion of the Içá-Solimões Aquifer System has a total groundwater resource of 0.45 km3. As there is a groundwater consumptive projection to 2050 close to 2.7 x 10⁻³ km3 yr–1 and the aquifer system has a sustainable yield of 3 x 10⁻³ km3 yr–1, the current resource allocation for future consumption rate appears to be sustainable.
Keywords:
Hydrogeology; Aquifer system; Groundwater resources; Amazon
RESUMO
A informação hidrogeológica ainda é escassa na região amazônica, sendo necessários mais estudos para melhorar a compreensão dos contextos hidrogeológicos locais. O objetivo deste artigo, focado na Província Petrolífera de Urucu, Amazônia Central brasileira, é estimar quantitativamente os recursos hídricos subterrâneos do Sistema Aquífero Içá-Solimões (SAIS) na região. O trabalho concentra-se no equilíbrio entre a disponibilidade e a demanda de água considerando os usos atuais e futuros contribuindo para um uso sustentável e integrado das águas subterrâneas. Análises cartográficas, litológicas e geofísicas foram feitas em conjunto com dados hidráulicos do SAIS (transmissividade, condutividade hidráulica e coeficiente de armazenamento) e suas geometrias aquíferas locais, bem como mapa de superfície potenciométrica para estimar valores de recursos hídricos subterrâneos totais e renováveis, rendimentos sustentáveis e capacidades de instalações de campo. Os resultados mostraram que a porção do Sistema Aquífero Içá-Solimões tem um recurso total de água subterrânea de 0,45 km3. Como há uma projeção de consumo de água subterrânea para 2050 perto de 2,7 x 10⁻³ km3 ano–1 e o sistema aquífero tem um rendimento sustentável de 3 x 10⁻³ km3 ano–1, a atual alocação de recursos para a taxa de consumo futuro parece ser sustentável.
Palavras-chave:
Hidrogeologia; Sistema aquífero; Recursos hídricos subterrâneos; Amazônia
INTRODUCTION
Many of the world’s largest aquifers are locally affected by the depletion of groundwater supplies, such as the Ogallala Aquifer of the central US (Kazmann, 1988Kazmann, R. G. (1988). Modern hydrology. Columbus: National Water Well Association Publication.), the Guarani Aquifer System, shared by Brazil, Argentina, Paraguay and Uruguay (Hirata et al., 2010Hirata, R., Zoby, J. L. G., & Oliveira, F. R. (2010). Água subterrânea: reserva estratégica ou emergencial. In C. Bicudo, J. Tundisi & M. Scheuenstuhl (Eds.), Águas do Brasil: análises estratégicas (Cap. IX, pp. 149-161). São Paulo: Instituto de Botânica.), and the Great Artesian Basin in Australia (Harrington & Cook, 2014Harrington, N., & Cook, P. (2014). Groundwater in Australia, National Centre for Groundwater Research and Training, Australia. Adelaide: The National Centre for Groundwater Research and Training. Retrieved in 2017, September 10, from http://www.groundwater.com.au/media/W1siZiIsIjIwMTQvMDMvMjUvMDFfNTFfMTNfMTMzX0dyb3VuZHdhdGVyX2luX0F1c3RyYWxpYV9GSU5BTF9mb3Jfd2ViLnBkZiJdXQ/Groundwater%20in%20Australia_FINAL%20for%20web.pdf
http://www.groundwater.com.au/media/W1si...
).
Rational use of groundwater avoids undesirable impacts that may be economic (excessively lowered water levels and the attendant increased pumping lifts and associated energy costs); geotechnical (collapses or land subsidence, damaging roads, private and public buildings, or buried pipelines); social and legal (damages to consumers); environmental (aquifer contamination, resulting in water of low quality), and river base flow maintenance (certainly relevant in the Amazon region).
When determining how much water can safely be exploited from an aquifer system, the concept of “safe yield” has been used. However, there is no consensus about meaning and parcels from the aquifer this concept involves, so a terminology that can be applied universally is needed. Traditionally, safe yield has been defined as “[…] the amount of water which can be withdrawn from a groundwater basin annually without producing an undesirable result” (Todd, 1959Todd, D. K. (1959). Groundwater hydrology. New York: John Wiley & Sons., p. 200), or as those that “[…] do not vary according to the annual rainfall and allow a groundwater stable exploitation in several years” (Feitosa et al., 2008Feitosa, F. A. C., Manoel Filho, J., Feitosa, E. C., & Demetrio, J. G. A. (2008). Hidrogeologia: conceitos e aplicações (3. ed.). Rio de Janeiro: CPRM/LABHID., p. 662).
According to Sophocleous (1997Sophocleous, M. (1997). Managing water resources systems: why “safe yield” is not sustainable. Ground Water, 35(4), 561. http://dx.doi.org/10.1111/j.1745-6584.1997.tb00116.x.
http://dx.doi.org/10.1111/j.1745-6584.19...
, 1998Sophocleous, M. (Eds.). 1998. Perspectives on sustainable development of water resources in Kansas (Bulletin, No. 239). Lawrence: Kansas Geological Survey., 2000Sophocleous, M. (2000). From safe yield to sustainable development of water resources: the Kansas experience. Journal of Hydrology, 235(1-2), 27-43. http://dx.doi.org/10.1016/S0022-1694(00)00263-8.
http://dx.doi.org/10.1016/S0022-1694(00)...
), other researchers contributed to the evolution of the term. Domenico (1972)Domenico, P. (1972). Concepts and models in groundwater hydrology. New York: McGraw-Hill. offered an expanded view of safe yield that included concern for available water, economics of pumping, quality, and water rights. Recently, the emphasis has shifted to “sustainable yield” (Alley & Leake, 2004Alley, W. M., & Leake, S. A. (2004). The journey from safe yield to sustainability. Ground Water, 42(1), 12-16. PMid:14763613. http://dx.doi.org/10.1111/j.1745-6584.2004.tb02446.x.
http://dx.doi.org/10.1111/j.1745-6584.20...
; Maimone, 2004Maimone, M. (2004). Defining and managing sustainable yield. Ground Water, 42(6-7), 809-814. PMid:15584295. http://dx.doi.org/10.1111/j.1745-6584.2004.tb02739.x.
http://dx.doi.org/10.1111/j.1745-6584.20...
; Seward et al., 2006Seward, P., Xu, Y., & Brendock, L. (2006). Sustainable groundwater use, the capture principle, and adaptive management. Water S.A., 32(4), 473-482.) that can be derived from conservation of mass principles (Kalf & Woolley, 2005Kalf, F. R. P., & Woolley, D. R. (2005). Applicability and methodology of determining sustainable yield in groundwater systems. Hydrogeology Journal, 13(1), 295-312. http://dx.doi.org/10.1007/s10040-004-0401-x.
http://dx.doi.org/10.1007/s10040-004-040...
), related to the traditional water budget formula that expresses the relationship between inflow (I) and outflow (O) rates (L3T–1) and water in storage for an aquifer (∆S, L3) of a given time (t, T): I – O = ∆S/t.
So, if O > I, ∆S is depleted and then groundwater level falls. If I = O, the water levels remain static because there is no gain or loss in storage. Inflows would include rainfall recharge, artificial recharge, runoff and stream/lake leakage, while outflows include springs, evapotranspiration, base flow, and drains. Discharge from wells upsets this equilibrium by producing a loss from ∆S as well as long low recharge rate periods which also may affect consequently natural downstream discharges such as springs.
However, climate change can result in sea level rises, or changes in hydrologic cycles, resulting in the final amount of water in an aquifer system, and hence in a few uncertainties that must be recognized and considered into a holistic approach (Meyland, 2011Meyland, S. J. (2011). Examining safe yield and sustainable yield for groundwater supplies and moving to managed yield as water resource limits become a reality. WIT Transactions on Ecology and the Environment, 145, 813-823. http://dx.doi.org/10.2495/WRM110731.
http://dx.doi.org/10.2495/WRM110731...
).
Groundwater is a key component in the hydrologic cycle in the Amazon region and constitutes an expressive reservoir of excellent quality water, which can be used for various human purposes (Galvão et al., 2012Galvão, P. H. F., Demétrio, J. G. A., Souza, E. L., Pinheiro, C. S. S., & Baessa, M. P. M. (2012). Hidrogeologia e geometria dos aquíferos das formações cretáceas Içá e Solimões, Bacia Paleozoica do Solimões, na região de Urucu, Amazonas. Revista Brasileira de Geociencias, 42(Suppl. 1), 141-152.) (except were layers containing coal or organic matter, which may significantly impact water quality). Nevertheless, potential overexploitation and other forms of quantitative and qualitative human impact may have negative consequences in the protection and conservation of the regional resources.
Hydrogeologic information in the Brazilian Amazon region is still scarce, being restricted only to the aquifers of the Içá, Solimões, and Alter do Chão formations. The studies are concentrated particularly in the cities of Manaus, state of Amazonas (Souza, 2003Souza, E. L. (2003). Comentários sobre “Avaliação dos impactos antropogênicos no ciclo da água na Amazônia” de Souza, Rocha e Cohen, com ênfase nas águas subterrâneas. In L. E. Aragón & M. Clusener-Godt (Eds.), Problemática do uso local e global da água na Amazônia (1. ed. Vol. 1, pp. 107-114). Brasília: UNESCO-NAEA.; Rocha et al., 2006Rocha, E. J. P., Ribeiro, J. B. M., & Forsberg, B. (2006). Avaliação da taxa de infiltração superficial em clareiras na Amazônia. In Anais do XIV Congresso Brasileiro de Meteorologia. São Paulo: Sociedade Brasileira de Meteorologia.; Souza & Verma, 2006Souza, L. S. B., & Verma, O. P. (2006). Mapeamento de aquíferos na cidade de Manaus/AM (zonas norte e leste) através de perfilagem geofísica de poço e sondagem elétrica vertical. Revista de Geologia, 19(1), 111-127.) and Belém, Marajó, Monte Alegre, Alter do Chão, and Santarém, state of Pará (Reis et al., 1977Reis, C. M., Tancredi, A. C. F. N. S., Matsui, E., & Salati, E. (1977). Caracterização das águas da região de Marajó através de concentrações de O-18 e D. Acta Amazonica, 7(2), 209-222. http://dx.doi.org/10.1590/1809-43921977072209.
http://dx.doi.org/10.1590/1809-439219770...
; Tancredi, 1996Tancredi, A. C. F. N. S. (1996). Recursos hídricos subterrâneos de Santarém: fundamentos para uso e proteção (Tese de doutorado). Centro de Geociências, Universidade Federal do Pará, Belém.; Lopes, 2005Lopes, E. C. S. (2005). Estudos hidrogeoquímicos e geofísicos da região da braquidobra de Monte Alegre/PA (Dissertação de mestrado). Programa de Pós-graduação em Geologia e Geoquímica, Centro de Geociências, Universidade Federal do Pará, Belém.; Rocha & Horbe, 2006Rocha, L. C. R., & Horbe, A. M. C. (2006). Contaminação provocada por um depósito de lixo no aquífero Alter do Chão em Manaus/AM. Acta Amazonica, 36(3), 307-312. http://dx.doi.org/10.1590/S0044-59672006000300003.
http://dx.doi.org/10.1590/S0044-59672006...
).
In the Central Amazon region, where the rainforest density and the hard access result in low human occupations, also result in incipient hydrogeologic studies, limited only in the Urucu Oil Province, where the Petrobras company’s Geologist Pedro de Moura Operational Base (GPMOB) is located. In the region, a hydrogeologic characterization has already been carried out, determining the aquifer geometries, as well as the evaluation of hydraulic connections between groundwater and surface waters, where a complex aquifer system was recognized, named Içá-Solimões Aquifer System – ISAS (Galvão, 2011Galvão, P. H. F. (2011). Caracterização hidrogeológica dos aqüíferos da formação Solimões na base operacional geólogo Pedro de Moura, província petrolífera de Urucu (AM) (Dissertação de mestrado). Programa de Pós-graduação em Geociências, Universidade Federal de Pernambuco, Recife.; Galvão et al., 2012Galvão, P. H. F., Demétrio, J. G. A., Souza, E. L., Pinheiro, C. S. S., & Baessa, M. P. M. (2012). Hidrogeologia e geometria dos aquíferos das formações cretáceas Içá e Solimões, Bacia Paleozoica do Solimões, na região de Urucu, Amazonas. Revista Brasileira de Geociencias, 42(Suppl. 1), 141-152.; Souza et al., 2013Souza, E. L., Galvão, P. H. F., Pinheiro, C. S. S., Baessa, M. P. M., Demétrio, J. G. A., & Brito, W. R. R. (2013). Síntese da hidrogeologia nas bacias sedimentares do Amazonas e do Solimões: sistemas aquíferos Içá-Solimões e Alter do Chão. Revista Geologia USP. Série Científica, 13(1), 107-117. http://dx.doi.org/10.5327/Z1519-874X2013000100007.
http://dx.doi.org/10.5327/Z1519-874X2013...
, 2015Souza, E. L., Galvao, P., Almeida, R., Pinheiro, C., Baessa, M., & Cabral, M. (2015). Stable isotopes studies in the Urucu Oil Province, Amazon Region, Brazil. Journal of Water Resource and Protection, 7(3), 131-142. http://dx.doi.org/10.4236/jwarp.2015.73011.
http://dx.doi.org/10.4236/jwarp.2015.730...
).
The goal of this work is to estimate by using Feitosa et al. (2008)Feitosa, F. A. C., Manoel Filho, J., Feitosa, E. C., & Demetrio, J. G. A. (2008). Hidrogeologia: conceitos e aplicações (3. ed.). Rio de Janeiro: CPRM/LABHID. equations and in situ data the groundwater resources of the ISAS within the GPMOB limits to optimize the exploitation and consumptive uses to guarantee its sustainability. The study area is considered a good laboratory working area because it is completely isolated from other types of occupations. As there is total control of the well-field facility pumping rates, with no extra-unknown well exploitations from other areas, the results calculated can be considered more reliable.
SITE DESCRIPTION
The study area Geologist Pedro de Moura Operational Base (GPMOB) [BOGPM - Base Operacional Geólogo Pedro de Moura] is in the Urucu Oil Province, state of Amazonas, Brazil, 650 km southwest from Manaus, the state capital (Figure 1). This province has a daily production of about 1,200 tons of natural gas, including 40 thousand barrels of oil, being a true enclave in the middle of the Central Amazon rainforest (Petróleo Brasileiro S/A, 2016Petróleo Brasileiro S/A – Petrobras. (2016). Urucu: completamos 30 anos na Amazônia com gestão responsável. Rio de Janeiro. Retrieved in 2017, September 10, from http://www.petrobras.com.br/fatos-e-dados/urucu-completamos-30-anos-na-amazonia-com-gestao-responsavel.htm
http://www.petrobras.com.br/fatos-e-dado...
). It is an area of about 120 km2 inserted in the Urucu river watershed, a tributary of the Solimões river (Lima et al., 2008Lima, S. O. F., Martins, M. B., Prudente, A. C., Montag, L. F. A., Monnerat, M. C., & Cabral, P. R. (2008). Biodiversidade na Província Petrolífera de Urucu (pp. 26-39). Rio de Janeiro: Petrobras/Cenpes.). The context of the Urucu river is important, as the north of the GPMOB is delimited by the river (Figure 1).

Locations of the entire study area GPMOB (small map at the top right of the figure), the pumping wells, and the main occupied areas (zooms A and B for more details) (modified from Google Earth, 2018Google Earth. (2018). Provincia Petrolífera de Urucu. Retrieved in 2018, July 20, from http://www.earth.google.com
http://www.earth.google.com... ).
The region has high precipitation (ranging from 2250 to 2750 mm yr–1), where the rainy season begins in October, with the highest levels of precipitation in January, February, and March. The annual mean temperature is 25°C (seasonal fluctuation of about 1°C), while the relative humidity is high, between 85-90%. Topographically, the elevation varies between 70 and 90 meters above sea level (Galvão, 2011Galvão, P. H. F. (2011). Caracterização hidrogeológica dos aqüíferos da formação Solimões na base operacional geólogo Pedro de Moura, província petrolífera de Urucu (AM) (Dissertação de mestrado). Programa de Pós-graduação em Geociências, Universidade Federal de Pernambuco, Recife.).
Geologically, the GPMOB is in Cretaceous and Tertiary-Quaternary sediments, represented by the following formations, from bottom to top: 1) Alter do Chão Formation: composed of coarse grained friable sandstones in the deeper strata, deposited in a continental environment (Caputo et al., 1971Caputo, M. V., Rodrigues, R., & Vasconcelos, D. N. N. (1971). Litoestratigrafia da Bacia do Amazonas. Belém: Petrobras. Relatório interno., 1972Caputo, M. V., Rodrigues, R., & Vasconcelos, D. N. N. (1972). Nomenclatura estratigráfica da Bacia do Amazonas: histórico e atualização. In Anais do 26º Congresso Brasileiro de Geologia (Vol. 3, pp. 35-46). Belém: SBG.), conglomerates (Daemon, 1975Daemon, R. F. (1975). Contribuição à datação da Formação Alter do Chão, bacia do Amazonas. Revista Brasileira de Geografia, 5, 58-84.), interspersed with thin layers of clayey material (Carvalho et al., 2014Carvalho, J. D. S., Tomasella, J., Shiraiwa, S., & Araujo, R. L. C. (2014). Stratigraphic aspects of the Alter do Chão formation in the northern region of Manaus, based on geoelectric information. Brazilian Journal of Geophysics, 32(1), 61-70. http://dx.doi.org/10.22564/rbgf.v32i1.397.
http://dx.doi.org/10.22564/rbgf.v32i1.39...
). The top of this formation is estimated to be Neo-Cretaceous, by correlation with the Amazonas sedimentary basin (Price, 1961Price, L. I. (1961). Sobre os dinossáurios do Brasil. Anais da Academia Brasileira de Ciências, 33(3-4), xxviii-xxix.); 2) Solimões Formation: unconformably overlies the Alter do Chão Formation and it is constituted of laminated mudstones, lignites layers, and fine to coarse grained sandstones (Caputo et al., 1972Caputo, M. V., Rodrigues, R., & Vasconcelos, D. N. N. (1972). Nomenclatura estratigráfica da Bacia do Amazonas: histórico e atualização. In Anais do 26º Congresso Brasileiro de Geologia (Vol. 3, pp. 35-46). Belém: SBG.; Caputo, 1984Caputo, M. V. (1984). Stratigraphy, tectonics, paleoclimatology and paleogeography of northern basins of Brasil (PhD thesis). University of California, Santa Barbara.). The formation is estimated to be Miocene/Pliocene, where the depositional environment is meandering fluvial with abandoned channels (Cruz, 1987Cruz, N. M. C. (1987). Quitinozoários da Bacia do Solimões, Brasil. Belém: CPRM/Petrobras. Relatório interno.); and 3) Içá Formation: unconformably overlies the Solimões Formation and it is characterized by fine to medium grained sandstones and siltstones, with occasional conglomerates (Nogueira et al., 2003Nogueira, A. C. R., Arai, M., Horbe, A. M., Silveira, R. R., & Silva, J. S. (2003). A influência marinha nos depósitos da Formação Solimões na região de Coari (AM): registro da transgressão miocênica na Amazônia ocidental. In Resumos Expandidos do 8º Simpósio de Geologia da Amazônia. Manaus: SBG. CD-ROM.).
Regarding the hydrogeology, in general, the Solimões Aquifer System (SAS) is constituted by sandstones, conglomerates, argillites and pelitic limestones presenting a maximum thickness of 2,200 m, where the average well discharge is about 28 m3/h. The SAS in some areas is normally associated hydraulically with the upper Içá Aquifer, resulting in a unique system named Içá-Solimões Aquifer System (ISAS). The Alter do Chão Aquifer System occurs below the Solimões Formation, composed of sandstones and argillites, reaching a maximum thickness of 1,250 m. The mean well discharge is 54 m3/h (Agência Nacional de Águas, 2007Agência Nacional de Águas – ANA. (2007). Águas subterrâneas: um recurso a ser conhecido e protegido. Brasília: Secretaria de Recursos Hídricos e Ambiente Urbano, Ministério do Meio Ambiente. Retrieved in 2018, August 25, from http://www.mma.gov.br/estruturas/167/_publicacao/167_publicacao28012009044356.pdf
http://www.mma.gov.br/estruturas/167/_pu...
).
In the GPMOB, where the ISAS providing 100% of the water needs for the province, is characterized by fine to coarse grained sandstones and clay lenses from the Solimões and Içá formations. The ISAS can reach depths of 100-120 m (with average thicknesses of 50 m). Due to local intercalations between sandstones and clay lenses, an individualization of two aquifers hydraulically connected can occur, constituting an unconfined-confined aquifer system. The mean local values of transmissivity (T), hydraulic conductivity (K), and storativity (S) are 3 x 10⁻³ m2 s–1 (260 m2 d–1), 10–4 m s–1 (8.6 m d–1) and 5 x 10⁻⁴, respectively (Galvão et al., 2012Galvão, P. H. F., Demétrio, J. G. A., Souza, E. L., Pinheiro, C. S. S., & Baessa, M. P. M. (2012). Hidrogeologia e geometria dos aquíferos das formações cretáceas Içá e Solimões, Bacia Paleozoica do Solimões, na região de Urucu, Amazonas. Revista Brasileira de Geociencias, 42(Suppl. 1), 141-152.).
The potentiometric surface indicates groundwater flow directions towards the Urucu River. A cone of depression in the center of the GPMOB is observed, due to high pumping rates (see Galvão et al., 2012Galvão, P. H. F., Demétrio, J. G. A., Souza, E. L., Pinheiro, C. S. S., & Baessa, M. P. M. (2012). Hidrogeologia e geometria dos aquíferos das formações cretáceas Içá e Solimões, Bacia Paleozoica do Solimões, na região de Urucu, Amazonas. Revista Brasileira de Geociencias, 42(Suppl. 1), 141-152.). Right below the ISAS, the Solimões Aquiclude is constituted of a 150-180 m thick clay layer. This aquiclude contacts the confined Alter do Chão Aquifer characterized by coarse sandstones, good porosity, and high permeability. However, in the region, this confined aquifer is characterized by groundwater with high values of electrical conductivity and salinity, due to its significant depths (> 300 m deep, Galvão, 2011Galvão, P. H. F. (2011). Caracterização hidrogeológica dos aqüíferos da formação Solimões na base operacional geólogo Pedro de Moura, província petrolífera de Urucu (AM) (Dissertação de mestrado). Programa de Pós-graduação em Geociências, Universidade Federal de Pernambuco, Recife.).
MATERIAL AND METHODS
First, a previous analysis of Petrobras database was made, presenting the following information: cartographic bases; lithologic (well depths, water table levels, pumping rates etc.) and geophysical well logs (resistivity, spontaneous potential and gamma ray); lithological and geophysical oil well logs (depth data available up to 450 m).
It was also analyzed the ISAS hydraulic data (hydraulic parameters: T, K, and S; geometry configuration: unsaturated and saturated aquifer thicknesses) established in previous researches performed at the GPMOB (Galvão, 2011Galvão, P. H. F. (2011). Caracterização hidrogeológica dos aqüíferos da formação Solimões na base operacional geólogo Pedro de Moura, província petrolífera de Urucu (AM) (Dissertação de mestrado). Programa de Pós-graduação em Geociências, Universidade Federal de Pernambuco, Recife.; Galvão et al., 2012Galvão, P. H. F., Demétrio, J. G. A., Souza, E. L., Pinheiro, C. S. S., & Baessa, M. P. M. (2012). Hidrogeologia e geometria dos aquíferos das formações cretáceas Içá e Solimões, Bacia Paleozoica do Solimões, na região de Urucu, Amazonas. Revista Brasileira de Geociencias, 42(Suppl. 1), 141-152.; Souza et al., 2013Souza, E. L., Galvão, P. H. F., Pinheiro, C. S. S., Baessa, M. P. M., Demétrio, J. G. A., & Brito, W. R. R. (2013). Síntese da hidrogeologia nas bacias sedimentares do Amazonas e do Solimões: sistemas aquíferos Içá-Solimões e Alter do Chão. Revista Geologia USP. Série Científica, 13(1), 107-117. http://dx.doi.org/10.5327/Z1519-874X2013000100007.
http://dx.doi.org/10.5327/Z1519-874X2013...
, 2015Souza, E. L., Galvao, P., Almeida, R., Pinheiro, C., Baessa, M., & Cabral, M. (2015). Stable isotopes studies in the Urucu Oil Province, Amazon Region, Brazil. Journal of Water Resource and Protection, 7(3), 131-142. http://dx.doi.org/10.4236/jwarp.2015.73011.
http://dx.doi.org/10.4236/jwarp.2015.730...
). These previous studies, coupled with those developed on this paper, the groundwater resources of the ISAS within the GPMOB limits were estimated, being described methodologically below. Such estimations were made for two specific areas: 1) Area A (60 km2), the smallest one, but where almost the well-field facility is located (22 wells out of 24); and 2) Area B (450 km2), which covers the entire GPMOB area (Figure 2).

Locations and dimensions of the areas A and B for groundwater resource and estimations. Area A, despite smaller in size (60 km2), is where most of the pumping wells are located. Area B covers the entire GPMOB area (450 km2) (modified from Google Earth, 2018Google Earth. (2018). Provincia Petrolífera de Urucu. Retrieved in 2018, July 20, from http://www.earth.google.com
http://www.earth.google.com... ).
In terms of georeferencing, the coordinate system used was Universal Transverse Mercator (UTM) projection, Zone 20 S, datum SAD 69, with units in meters.
Total groundwater resources
Considering the Içá-Solimões Aquifer System as semi-confined (Galvão et al., 2012Galvão, P. H. F., Demétrio, J. G. A., Souza, E. L., Pinheiro, C. S. S., & Baessa, M. P. M. (2012). Hidrogeologia e geometria dos aquíferos das formações cretáceas Içá e Solimões, Bacia Paleozoica do Solimões, na região de Urucu, Amazonas. Revista Brasileira de Geociencias, 42(Suppl. 1), 141-152.), the total groundwater resources can be estimated by the sum of confined (Vp) and saturated (Vs) aquifer resource parcels, method based on the Feitosa et al. (2008)Feitosa, F. A. C., Manoel Filho, J., Feitosa, E. C., & Demetrio, J. G. A. (2008). Hidrogeologia: conceitos e aplicações (3. ed.). Rio de Janeiro: CPRM/LABHID. Equation 1:
where: Ac is the confined aquifer area (L2); S is the storativity (dimensionless); Δh is the water level above the top of the confined aquifer; A is the area of aquifer occurrence (L2); ƞe is the effective porosity (%); b is the mean saturation thickness of an aquifer.
The values adopted for Ac, S, Δh, b were calculated by Galvão et al. (2012)Galvão, P. H. F., Demétrio, J. G. A., Souza, E. L., Pinheiro, C. S. S., & Baessa, M. P. M. (2012). Hidrogeologia e geometria dos aquíferos das formações cretáceas Içá e Solimões, Bacia Paleozoica do Solimões, na região de Urucu, Amazonas. Revista Brasileira de Geociencias, 42(Suppl. 1), 141-152., in a research developed in the study area (Figure 3). As there was no information about ƞe of the ISAS in the region, a representative value of sand and clay equal to 10% was adopted (Table 1) based on the geological material found during three stratigraphic drillings within the GPMOB, which was characterized as a sand containing predominance of clay.
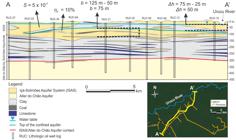
Hydrogeologic section (A-A’) indicating average values adopted for groundwater estimations (modified from Galvão et al., 2012Galvão, P. H. F., Demétrio, J. G. A., Souza, E. L., Pinheiro, C. S. S., & Baessa, M. P. M. (2012). Hidrogeologia e geometria dos aquíferos das formações cretáceas Içá e Solimões, Bacia Paleozoica do Solimões, na região de Urucu, Amazonas. Revista Brasileira de Geociencias, 42(Suppl. 1), 141-152.).
Effective porosity values for some lithological materials, according to Driscoll (1987)Driscoll, G. (1987). Groundwater and wells (2nd ed.). St. Paul: Johnson Division..
Renewable groundwater resources
The estimation of renewable resources can be done indirectly by analyzing the aquifer potentiometric surface map coupled with its transmissivity, hydraulic gradient, and length of a regular potentiometric contour. This type of analysis can be made through the Equation 2 of Natural Aquifer Discharge (NAD), a derivation of Darcy’s Law (Feitosa et al., 2008Feitosa, F. A. C., Manoel Filho, J., Feitosa, E. C., & Demetrio, J. G. A. (2008). Hidrogeologia: conceitos e aplicações (3. ed.). Rio de Janeiro: CPRM/LABHID.):
where: T is the transmissivity (L2T–1); i is the hydraulic gradient (dimensionless); L is the length of a regular potentiometric contour (L).
The T value adopted was the calculated by Galvão et al. (2012)Galvão, P. H. F., Demétrio, J. G. A., Souza, E. L., Pinheiro, C. S. S., & Baessa, M. P. M. (2012). Hidrogeologia e geometria dos aquíferos das formações cretáceas Içá e Solimões, Bacia Paleozoica do Solimões, na região de Urucu, Amazonas. Revista Brasileira de Geociencias, 42(Suppl. 1), 141-152.. Values of i and L were collected from the potentiometric surface map (Figure 4). For this, water table measurements were made in 24 pumping wells on May 2009 (all well pumps were turned off for at least 24 hours before measurements). The UTM coordinates and terrain elevations, provided by Petrobras, coupled with the water tables measured, were later organized in an Excel sheet (Table 2). As in some areas there are hydraulic connections between both semi-confined and confined aquifers (lack of clayey layers), significant differences in hydraulic heads were not observed, resulting only in one potentiometric surface map, not being necessary separate maps for semi-confined and confined aquifer.
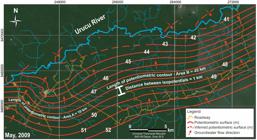
Potentiometric surface map (May 2009) and lengths of potentiometric contour considered for the calculations of the renewable resources (modified from Galvão et al., 2012Galvão, P. H. F., Demétrio, J. G. A., Souza, E. L., Pinheiro, C. S. S., & Baessa, M. P. M. (2012). Hidrogeologia e geometria dos aquíferos das formações cretáceas Içá e Solimões, Bacia Paleozoica do Solimões, na região de Urucu, Amazonas. Revista Brasileira de Geociencias, 42(Suppl. 1), 141-152.).
Data of coordinates, terrain elevations, and depth to water table (DWT) for hydraulic head (h) observations in May 2009. The coordinate system used was Universal Transverse Mercator projection, Zone 20, datum SAD 69, with units in meters.
The terrain elevation subtracted from its respective water table corresponds to the hydraulic head (h). The interpolation of all calculated hydraulic heads generates the potentiometric surface. For this, UTM coordinates and h values were imputed in the Surfer software, where a map of h isolines was generated by using a kriging interpolation. This primary map was subsequently adjusted in the CorelDraw software, resulting in the final potentiometric surface map (Figure 4).
Sustainable yields
For this study, the authors adopted the generalized definition for sustainable yield as “[…] the amount of water which can withdraw from a groundwater basin annually without producing an undesirable result” (Todd, 1959Todd, D. K. (1959). Groundwater hydrology. New York: John Wiley & Sons., p. 200), “[…] including concern for available water, economics of pumping, quality and water rights” (Domenico, 1972Domenico, P. (1972). Concepts and models in groundwater hydrology. New York: McGraw-Hill., p. 43).
However, the definition of such negative effect is complex, going through issues of all nature, from hydraulic, social, economic, and legal aspects. Thus, the decision on what number to adopt as sustainable yield should be based on conservative values at the beginning of quantification, especially in areas with low data (such as the Amazon region), so that this yield become sustainable and productive in the future. Such quantification must inevitably undergo reevaluations throughout the process as knowledge of the aquifer system evolves.
As Feitosa et al. (2008)Feitosa, F. A. C., Manoel Filho, J., Feitosa, E. C., & Demetrio, J. G. A. (2008). Hidrogeologia: conceitos e aplicações (3. ed.). Rio de Janeiro: CPRM/LABHID. comment in the book Hydrogeology: concepts and applications, sustainable yields depend on many restrictive factors, and even variations of time, been redefined by different authors (see summarized list in chronological order of key authors and concepts in Kalf & Woolley, 2005Kalf, F. R. P., & Woolley, D. R. (2005). Applicability and methodology of determining sustainable yield in groundwater systems. Hydrogeology Journal, 13(1), 295-312. http://dx.doi.org/10.1007/s10040-004-0401-x.
http://dx.doi.org/10.1007/s10040-004-040...
). Thus, it is acceptable to adopt an arbitrary percentage value of the total groundwater resources that can vary from case to case, and in time. This value can be quantified by decision makers based on a set of technical, social, economic, and database factors. In the case of the GPMOB, due to its context of hydrogeological knowledge and limited database, the arbitrary and conservative value of 20% for the ISAS total resources was adopted for an exploitation estimation until 2050 (i.e. 20% divided by 32 years from 2018). This value should be reevaluated as new data about local aquifer is developed.
Well-field facility capacities
Well-field facility capacities can be considered as those in which there is already a significant exploitation, which involve two types: potential facility and effective facility (Feitosa et al., 2008Feitosa, F. A. C., Manoel Filho, J., Feitosa, E. C., & Demetrio, J. G. A. (2008). Hidrogeologia: conceitos e aplicações (3. ed.). Rio de Janeiro: CPRM/LABHID.). Potential facility is the possible groundwater volume to be extracted considering a maximum and continuous pumping rate from all well-field located within a study area (24/24 hours). Effective facility is the groundwater volume that has been effectively extracted, with a pumping regime less than 24/24 hour. The pumping wells at GPMOB do not work 24 hours per day, because there is an automatic shutdown controller installed on each well that turns off its pump when water tanks are completely full, which result in a daily average of 6 hours of pumping for each well, number adopted for this study.
RESULTS
Total groundwater resources
For the calculation of the confined aquifer resource parcel (Vp), the confined aquifer area (Ac) considered was 60 km2, corresponding to the area A (Figure 2), where almost the well-field facility is located (22 wells out of 24). The storativity (S) adopted was 5 x 10⁻⁴ (Galvão et al., 2012Galvão, P. H. F., Demétrio, J. G. A., Souza, E. L., Pinheiro, C. S. S., & Baessa, M. P. M. (2012). Hidrogeologia e geometria dos aquíferos das formações cretáceas Içá e Solimões, Bacia Paleozoica do Solimões, na região de Urucu, Amazonas. Revista Brasileira de Geociencias, 42(Suppl. 1), 141-152.), and the average water level above the top of the confined aquifer (Δh) was 50 m, based on the most representative hydrogeological cross-section of the area (Figure 3). Then, the Vp calculated was 0.0015 km3.
For the saturation aquifer resource parcel (Vs), the values for area of aquifer occurrence (A), effective porosity (ƞe), and mean aquifer thickness (b) were 60 km2 (same value of confined aquifer area), 10% (value for clayey sands, Table 1), 75 m, respectively (Figure 3). So, the Vs estimated was 0.45 km3.
Summing up the parcels, the ISAS total resource for area A was 0.4515 km3 (~0.45 km3). If the values were extended to area B (Figure 2), of about 450 km2, the ISAS total resource would be about 3.375 km3 (~3.4 km3).
Renewable groundwater resource
From the Natural Aquifer Discharge (NAD) Equation 2, firstly the isopotentials 48 and 49 m from the potentiometric surface map were considered for the hydraulic gradient calculation (i) = (49 – 48) x 1000–1 = 0.001; and the lengths of potentiometric contours of 10,000 m (area A) and 40,000 m (area B) were estimated (Figure 4). The transmissivity adopted was 3 x 10⁻³ m2 s–1 (260 m2 d–1) (Galvão et al., 2012Galvão, P. H. F., Demétrio, J. G. A., Souza, E. L., Pinheiro, C. S. S., & Baessa, M. P. M. (2012). Hidrogeologia e geometria dos aquíferos das formações cretáceas Içá e Solimões, Bacia Paleozoica do Solimões, na região de Urucu, Amazonas. Revista Brasileira de Geociencias, 42(Suppl. 1), 141-152.).
Then, the NAD, which corresponds to the ISAS renewable resource, for area A was 9.5 x 10⁻⁴ km3 yr–1, while for area B it was 3.8 x 10 –3 km3 yr–1.
Sustainable yields
Considering a sustainable yield of 20% from the ISAS total resources, that is, 0.4515 km3 x 0.2 (area A), the value would be close to 0.09 km3. For area B, the value would be 3.38 km3 x 0.2 = 0.68 km3. Assuming exploitations until 2050, annual sustainable yields for area A would be approximately 3 x 10 –3 km3 yr–1; for area B, would be 2 x 10 –2 km3 yr–1.
Well-field facility capacities
The potential facility was considered as the sum of the discharges of the main pumping wells in 2011 (all located in area A, Figure 2), considering a 24/24h per day regime. So, the potential facility value found was 5.5 x 10⁻³ km3 yr–1 (Table 3).
Well-field potential facility rate, considering a 24 hour per day regime and a regime of 6 hours per day (pumping discharges, Q).
Regarding the effective facility, as the main pumping wells do not work in a continuous regime of 24 hours per day, a daily regime of 6 hours to each well was considered. Thus, an effective facility of 1.4 x 10⁻³ km3 yr–1 was estimated (Table 3).
DISCUSSION
As the annual aquifer sustainable yield is 3 x 10 –3 km3 yr–1 (for calculation purposes in this chapter, only area A was considered, as it is the area where most of the wells and main facilities are located) and the effective facility is 1.4 x 10⁻³ km3 yr–1, then the currently induced discharge is about 45% of the ISAS sustainable yield, which still can be considered safe. However, this effective facility value used for such abstraction is a fixed number and does not consider future increases in groundwater consumptive uses.
However, at the period of the study, the renewable resource for area A was 9.5 x 10⁻⁴ km3 yr–1. As the effective facility is 1.4 x 10⁻³ km3 yr–1, it can be considered that the effective facility was exceeding a little the renewable resource, which indicates that part of the reserve was already being exploited.
According to the GPMOB’s groundwater real annual consumption, an estimation of future effective facility rates was made for the next decades, specifically, up to 2050. As the annual consumption data covers the years between 2004 and 2018, the median growth for this period was calculated, resulting in a coefficient of 2. In other words, future effective facility rates in the GPMOB have an annual growth trend of 2%. Thus, the effective facility until 2050 would be close to 2.7 x 10⁻³ km3 yr–1 (Table 4), instead 1.4 x 10⁻³ km3 yr–1 (Table 3).
Reevaluating the abstraction, as the sustainable yield is equal to 3 x 10⁻³ km3 yr–1 for area A, and the future effective facility for the GPMOB is 2.7 x 10⁻³ km3 yr–1, the future resource allocation for consumption is 90% of the ISAS sustainable yield, being considered sustainable. Considering a hypothetic situation of the use of total potential facility (5.5 x 10⁻³ km3 yr–1), this value is about 80% above the ISAS sustainable yield. So, despite the abstraction results (considering the effective facility until 2050) appear to be safe, managers should recognize that yield varies over time as environmental conditions vary, especially due to current climate changes.
Therefore, this work estimated resources values for groundwater management based on a potentiometric map, hydraulic parameters and aquifer geometry obtained from previous studies within the same project. However, it is known values estimated for the GPMOB should be reviewed in the future, using more updated data to confirm the growth trend coefficient, as well as the ISAS resource and sustainable yield values proposed here. As this study is considered the first one developed in a region/aquifer very little studied resulting in no scientific papers published yet, the authors believe in the importance of this data for future works. Then, the suggestion for the next researches should focus on the analysis of the baseflow recession curve of the Urucu river, potentiometric level variations for recharge estimations, and water balance estimations to be used as basedata for numerical modeling to be compared with the set of numbers calculated in this paper.
CONCLUSIONS
The ISAS total resource for area A, of smaller extension, but with the highest concentration of pumping wells, is 0.45 km3. For area B, which covers the entire GPMOB, the total resource is 3.4 km3. The renewable groundwater resource is 9.5 x 10⁻⁴ km3 yr–1 for area A, while area B is 3.8 x 10⁻³ km3 yr–1.
Despite the sustainable yield is 3 x 10⁻³ km3 yr–1 for area A, and the future effective facility until 2050 is about 2.7 x 10⁻³ km3 yr–1 (90%), still considered sustainable, as yields vary over time as environmental conditions vary, the calculations should be reviewed in the near future for confirmation.
ACKNOWLEDGEMENTS
This work was funded by Petrobras, through the project “Ecoeficiência 3” (Contract No. 0050.0032737.07.2).
REFERENCES
- Agência Nacional de Águas – ANA. (2007). Águas subterrâneas: um recurso a ser conhecido e protegido Brasília: Secretaria de Recursos Hídricos e Ambiente Urbano, Ministério do Meio Ambiente. Retrieved in 2018, August 25, from http://www.mma.gov.br/estruturas/167/_publicacao/167_publicacao28012009044356.pdf
» http://www.mma.gov.br/estruturas/167/_publicacao/167_publicacao28012009044356.pdf - Alley, W. M., & Leake, S. A. (2004). The journey from safe yield to sustainability. Ground Water, 42(1), 12-16. PMid:14763613. http://dx.doi.org/10.1111/j.1745-6584.2004.tb02446.x
» http://dx.doi.org/10.1111/j.1745-6584.2004.tb02446.x - Caputo, M. V. (1984). Stratigraphy, tectonics, paleoclimatology and paleogeography of northern basins of Brasil (PhD thesis). University of California, Santa Barbara.
- Caputo, M. V., Rodrigues, R., & Vasconcelos, D. N. N. (1971). Litoestratigrafia da Bacia do Amazonas Belém: Petrobras. Relatório interno.
- Caputo, M. V., Rodrigues, R., & Vasconcelos, D. N. N. (1972). Nomenclatura estratigráfica da Bacia do Amazonas: histórico e atualização. In Anais do 26º Congresso Brasileiro de Geologia (Vol. 3, pp. 35-46). Belém: SBG.
- Carvalho, J. D. S., Tomasella, J., Shiraiwa, S., & Araujo, R. L. C. (2014). Stratigraphic aspects of the Alter do Chão formation in the northern region of Manaus, based on geoelectric information. Brazilian Journal of Geophysics, 32(1), 61-70. http://dx.doi.org/10.22564/rbgf.v32i1.397
» http://dx.doi.org/10.22564/rbgf.v32i1.397 - Cruz, N. M. C. (1987). Quitinozoários da Bacia do Solimões, Brasil Belém: CPRM/Petrobras. Relatório interno.
- Daemon, R. F. (1975). Contribuição à datação da Formação Alter do Chão, bacia do Amazonas. Revista Brasileira de Geografia, 5, 58-84.
- Domenico, P. (1972). Concepts and models in groundwater hydrology New York: McGraw-Hill.
- Driscoll, G. (1987). Groundwater and wells (2nd ed.). St. Paul: Johnson Division.
- Feitosa, F. A. C., Manoel Filho, J., Feitosa, E. C., & Demetrio, J. G. A. (2008). Hidrogeologia: conceitos e aplicações (3. ed.). Rio de Janeiro: CPRM/LABHID.
- Galvão, P. H. F. (2011). Caracterização hidrogeológica dos aqüíferos da formação Solimões na base operacional geólogo Pedro de Moura, província petrolífera de Urucu (AM) (Dissertação de mestrado). Programa de Pós-graduação em Geociências, Universidade Federal de Pernambuco, Recife.
- Galvão, P. H. F., Demétrio, J. G. A., Souza, E. L., Pinheiro, C. S. S., & Baessa, M. P. M. (2012). Hidrogeologia e geometria dos aquíferos das formações cretáceas Içá e Solimões, Bacia Paleozoica do Solimões, na região de Urucu, Amazonas. Revista Brasileira de Geociencias, 42(Suppl. 1), 141-152.
- Google Earth. (2018). Provincia Petrolífera de Urucu Retrieved in 2018, July 20, from http://www.earth.google.com
» http://www.earth.google.com - Harrington, N., & Cook, P. (2014). Groundwater in Australia, National Centre for Groundwater Research and Training, Australia Adelaide: The National Centre for Groundwater Research and Training. Retrieved in 2017, September 10, from http://www.groundwater.com.au/media/W1siZiIsIjIwMTQvMDMvMjUvMDFfNTFfMTNfMTMzX0dyb3VuZHdhdGVyX2luX0F1c3RyYWxpYV9GSU5BTF9mb3Jfd2ViLnBkZiJdXQ/Groundwater%20in%20Australia_FINAL%20for%20web.pdf
» http://www.groundwater.com.au/media/W1siZiIsIjIwMTQvMDMvMjUvMDFfNTFfMTNfMTMzX0dyb3VuZHdhdGVyX2luX0F1c3RyYWxpYV9GSU5BTF9mb3Jfd2ViLnBkZiJdXQ/Groundwater%20in%20Australia_FINAL%20for%20web.pdf - Hirata, R., Zoby, J. L. G., & Oliveira, F. R. (2010). Água subterrânea: reserva estratégica ou emergencial. In C. Bicudo, J. Tundisi & M. Scheuenstuhl (Eds.), Águas do Brasil: análises estratégicas (Cap. IX, pp. 149-161). São Paulo: Instituto de Botânica.
- Kalf, F. R. P., & Woolley, D. R. (2005). Applicability and methodology of determining sustainable yield in groundwater systems. Hydrogeology Journal, 13(1), 295-312. http://dx.doi.org/10.1007/s10040-004-0401-x
» http://dx.doi.org/10.1007/s10040-004-0401-x - Kazmann, R. G. (1988). Modern hydrology Columbus: National Water Well Association Publication.
- Lima, S. O. F., Martins, M. B., Prudente, A. C., Montag, L. F. A., Monnerat, M. C., & Cabral, P. R. (2008). Biodiversidade na Província Petrolífera de Urucu (pp. 26-39). Rio de Janeiro: Petrobras/Cenpes.
- Lopes, E. C. S. (2005). Estudos hidrogeoquímicos e geofísicos da região da braquidobra de Monte Alegre/PA (Dissertação de mestrado). Programa de Pós-graduação em Geologia e Geoquímica, Centro de Geociências, Universidade Federal do Pará, Belém.
- Maimone, M. (2004). Defining and managing sustainable yield. Ground Water, 42(6-7), 809-814. PMid:15584295. http://dx.doi.org/10.1111/j.1745-6584.2004.tb02739.x
» http://dx.doi.org/10.1111/j.1745-6584.2004.tb02739.x - Meyland, S. J. (2011). Examining safe yield and sustainable yield for groundwater supplies and moving to managed yield as water resource limits become a reality. WIT Transactions on Ecology and the Environment, 145, 813-823. http://dx.doi.org/10.2495/WRM110731
» http://dx.doi.org/10.2495/WRM110731 - Nogueira, A. C. R., Arai, M., Horbe, A. M., Silveira, R. R., & Silva, J. S. (2003). A influência marinha nos depósitos da Formação Solimões na região de Coari (AM): registro da transgressão miocênica na Amazônia ocidental. In Resumos Expandidos do 8º Simpósio de Geologia da Amazônia Manaus: SBG. CD-ROM.
- Petróleo Brasileiro S/A – Petrobras. (2016). Urucu: completamos 30 anos na Amazônia com gestão responsável Rio de Janeiro. Retrieved in 2017, September 10, from http://www.petrobras.com.br/fatos-e-dados/urucu-completamos-30-anos-na-amazonia-com-gestao-responsavel.htm
» http://www.petrobras.com.br/fatos-e-dados/urucu-completamos-30-anos-na-amazonia-com-gestao-responsavel.htm - Price, L. I. (1961). Sobre os dinossáurios do Brasil. Anais da Academia Brasileira de Ciências, 33(3-4), xxviii-xxix.
- Reis, C. M., Tancredi, A. C. F. N. S., Matsui, E., & Salati, E. (1977). Caracterização das águas da região de Marajó através de concentrações de O-18 e D. Acta Amazonica, 7(2), 209-222. http://dx.doi.org/10.1590/1809-43921977072209
» http://dx.doi.org/10.1590/1809-43921977072209 - Rocha, E. J. P., Ribeiro, J. B. M., & Forsberg, B. (2006). Avaliação da taxa de infiltração superficial em clareiras na Amazônia. In Anais do XIV Congresso Brasileiro de Meteorologia São Paulo: Sociedade Brasileira de Meteorologia.
- Rocha, L. C. R., & Horbe, A. M. C. (2006). Contaminação provocada por um depósito de lixo no aquífero Alter do Chão em Manaus/AM. Acta Amazonica, 36(3), 307-312. http://dx.doi.org/10.1590/S0044-59672006000300003
» http://dx.doi.org/10.1590/S0044-59672006000300003 - Seward, P., Xu, Y., & Brendock, L. (2006). Sustainable groundwater use, the capture principle, and adaptive management. Water S.A., 32(4), 473-482.
- Sophocleous, M. (1997). Managing water resources systems: why “safe yield” is not sustainable. Ground Water, 35(4), 561. http://dx.doi.org/10.1111/j.1745-6584.1997.tb00116.x
» http://dx.doi.org/10.1111/j.1745-6584.1997.tb00116.x - Sophocleous, M. (Eds.). 1998. Perspectives on sustainable development of water resources in Kansas (Bulletin, No. 239). Lawrence: Kansas Geological Survey.
- Sophocleous, M. (2000). From safe yield to sustainable development of water resources: the Kansas experience. Journal of Hydrology, 235(1-2), 27-43. http://dx.doi.org/10.1016/S0022-1694(00)00263-8
» http://dx.doi.org/10.1016/S0022-1694(00)00263-8 - Souza, E. L. (2003). Comentários sobre “Avaliação dos impactos antropogênicos no ciclo da água na Amazônia” de Souza, Rocha e Cohen, com ênfase nas águas subterrâneas. In L. E. Aragón & M. Clusener-Godt (Eds.), Problemática do uso local e global da água na Amazônia (1. ed. Vol. 1, pp. 107-114). Brasília: UNESCO-NAEA.
- Souza, E. L., Galvão, P. H. F., Pinheiro, C. S. S., Baessa, M. P. M., Demétrio, J. G. A., & Brito, W. R. R. (2013). Síntese da hidrogeologia nas bacias sedimentares do Amazonas e do Solimões: sistemas aquíferos Içá-Solimões e Alter do Chão. Revista Geologia USP. Série Científica, 13(1), 107-117. http://dx.doi.org/10.5327/Z1519-874X2013000100007
» http://dx.doi.org/10.5327/Z1519-874X2013000100007 - Souza, E. L., Galvao, P., Almeida, R., Pinheiro, C., Baessa, M., & Cabral, M. (2015). Stable isotopes studies in the Urucu Oil Province, Amazon Region, Brazil. Journal of Water Resource and Protection, 7(3), 131-142. http://dx.doi.org/10.4236/jwarp.2015.73011
» http://dx.doi.org/10.4236/jwarp.2015.73011 - Souza, L. S. B., & Verma, O. P. (2006). Mapeamento de aquíferos na cidade de Manaus/AM (zonas norte e leste) através de perfilagem geofísica de poço e sondagem elétrica vertical. Revista de Geologia, 19(1), 111-127.
- Tancredi, A. C. F. N. S. (1996). Recursos hídricos subterrâneos de Santarém: fundamentos para uso e proteção (Tese de doutorado). Centro de Geociências, Universidade Federal do Pará, Belém.
- Todd, D. K. (1959). Groundwater hydrology New York: John Wiley & Sons.
Publication Dates
-
Publication in this collection
31 Jan 2020 -
Date of issue
2020
History
-
Received
05 May 2019 -
Reviewed
17 Sept 2019 -
Accepted
29 Oct 2019


