
Abstract
Pressure screening is a critical step in the production of high-quality paper. In efforts to meet sustainable market demands, mill operators are forced to push the limits of screening operation to the point where plugging becomes a recurrent issue. This two-part study provides insights into the limits of screening operations. In the first part, some published imaging data was analyzed to delve into the plugging mechanisms. The observed hysteresis and intermittency were measured by image processing techniques, which revealed that an intermittent behavior of plug-and-release events is intensified as permanent, stable plugs start to form. The intermittency was characterized as changes in the distribution of open area fluctuation peaks. Thus, the kurtosis of the fluctuation peak distribution is proposed as a metric for a plugging soft-sensor. In part 2 of this investigation, the limits of screening operation were characterized by performing a series of screening trials. The utility of the soft-sensor metric for plugging was assessed with the pressure fluctuation data.
Download PDF
Full Article
Understanding the Limits of a Screening Operation. Part 1: Characterization of Screen Plugging
Miguel E. Villalba,a,* James A. Olson,b and D. Mark Martinez a
Pressure screening is a critical step in the production of high-quality paper. In efforts to meet sustainable market demands, mill operators are forced to push the limits of screening operation to the point where plugging becomes a recurrent issue. This two-part study provides insights into the limits of screening operations. In the first part, some published imaging data was analyzed to delve into the plugging mechanisms. The observed hysteresis and intermittency were measured by image processing techniques, which revealed that an intermittent behavior of plug-and-release events is intensified as permanent, stable plugs start to form. The intermittency was characterized as changes in the distribution of open area fluctuation peaks. Thus, the kurtosis of the fluctuation peak distribution is proposed as a metric for a plugging soft-sensor. In part 2 of this investigation, the limits of screening operation were characterized by performing a series of screening trials. The utility of the soft-sensor metric for plugging was assessed with the pressure fluctuation data.
DOI: 10.15376/biores.19.2.2404-2416
Keywords: Pressure screen; Plugging; Rotor speed; Intermittency; Hysteresis
Contact information: a: Department of Chemical and Biological Engineering, University of British Columbia, 2360 East Mall, Vancouver, V6T 1Z4, BC, Canada; b: Department of Mechanical Engineering, The University of British Columbia, 6250 Applied Science Lane, V6T 1Z4, BC, Canada;
* Corresponding author: miguel.villalba@mech.ubc.ca
GRAPHICAL ABSTRACT

INTRODUCTION
Pressure screens are used in the pulp and paper industry to effectively remove contaminants, including fibre bundles from pulp suspensions (Bliss 2002). Contaminants are known to reduce the surface smoothness of paper, paper strength, as well as the optical properties of the pulp. Pressure screening is also used as a means of fractionating fibres by length with the purpose of manufacturing different value products. Overall, the use of pressure screens is essential for the production of smooth, strong, high-quality paper. Furthermore, the need to meet the demands of a sustainable market has made screening increasingly important in the production of recycled furnishes. However, the biggest challenge in screening is the balancing of improving capacity (i.e., maximum pulp throughput) and contaminant removal efficiency while also reducing rotor power consumption.
To this end, screens with smaller apertures are operated at progressively lower rotor speeds, higher flow rates and pulp consistencies. Such conditions push the limits of screening operation, where plugging is likely to occur due to the irreversible fibre deposition in the screen apertures (Salem 2013). Screen plugging results in the reduction of the screening efficiency and, in some cases, the sudden stoppage of pulp production (Estevez-Reyes 1995).
The primary motivation of this investigation is to gain insights into the limits of screening operation as well as the underlying physical phenomena occurring in the transition from the operational to the plugged regime. This knowledge prompts the development of a method to predict the onset of plugging in the screen. The authors believe that this mechanism will give insight into screening operations at every point during the stock preparation process. The majority of the screening literature has addressed strategies to improve different aspects of the screening operation with considerable focus on enhancing the cleaning mechanisms by the rotor (Jokinen et al. 2007; Salem 2013; Li 2020), as well as, improving the fractionation efficiency (Wakelin and Corson 1997; Ammala 2003; Jokinen et al. 2006; Mohamad 2012), and reducing the rotor power consumption (Li 2003; Olson et al. 2004). However, the plugging mechanisms of fibres in the screen apertures and their role on the limits of screening operation are less understood.
In attempts to understand the limits of screening operation from the theoretical standpoint, Martinez et al. (1999) developed a mechanistic model based on the forces acting on pulp floc. This model prescribes that the limits of screening operation and hence, plugging, are dictated by a force balance between the hydrodynamic forces, the rotor pulsation force, and the frictional force acting on a pulp floc in an aperture. More recently, the interplay between the rotor tip speed and the slot velocity (i.e. accept flow) has been shown to be a key factor dictating the limits of screen operation for different pulp suspensions and screen geometries (Delfel 2009; Salem 2013). Indeed, the magnitude of slot velocity dictates the extent of the fibre passage into the apertures, while the rotor is responsible for clearing excess fibres and dispersing flocs by imposing turbulence and pressure pulses (Gooding 1996; Salem 2013). The relationship between and at the onset of plugging is strikingly linear (Delfel 2009; Salem 2013). However, little is known about the underlying physical phenomena associated with the linearity of the limits of screening operation. Other experimental and numerical studies have focused on the flows of dilute fibre suspensions in the vicinity of apertures (Olson 1996; Gooding 1996; Ashok 1991; Salem 2013). These studies show that fibres tend to progressively accumulate in the downstream edge of the aperture. The flow field and the fibre length to slot width ratio play a key role in the plugging of fibres in the dilute limit (Olson 1996). In the dense limit, however, plugging has been given little attention likely due to the challenges of visualizing flows of dense suspensions in a screen.
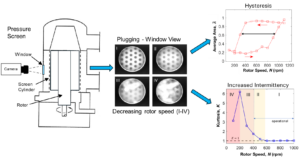
One unique study by Hoffmann et al. (2023) involved the direct visualization of the plugging event in a small section of a pressure screen under typical screening conditions. A schematic of the screen and visualization setup used in that study is shown in Fig. 1. Sample snapshots from the visualization study are shown in Fig. 2. This visualization study provided two key teachings. Firstly, it demonstrated that the screen apertures plug when the rotor speed is reduced below a critical value. Notably, once the screen becomes plugged, the rotor speed needs to be increased significantly to remove the plugs. This is the signature of a hysteresis in the cleaning cycle. Secondly, there is an additional dynamic whereby the frequency of the plug-and-release events (intermittency) increases dramatically as the screen approaches the point of failure. This intermittent behavior has also been widely reported for the plugging of particles in filtering and granular media (Dressaire and Sauret 2017; Dai and Grace 2010), and more recently, for the plugging of semi-dilute suspensions of nylon fibres in narrow constrictions (Villalba et al. 2023). It is commonly reported by this body of literature that the intermittency based on the plugging intervals predominantly follows an exponential distribution, indicative of a Poisson or random process.

Fig. 1. Schematic of the visualization setup used by Hoffmann et al. featuring the Hooper PSV 2100 Pressure Screen (left) and the top view of the rotor and screen (right). The screen has a Plexiglas visualization window where plugging events were recorded with a video camera. Image adapted from Gooding (1996). Images are not to scale.

Fig. 2. Sample images of the plugging evolution for different pulp consistencies of (a) c = 0.5%, (b) c = 1.0%. Here the slot velocity is kept constant at 0.5 m/s. Plugging is defined as the temporary or permanent blockage of an aperture. Failure is defined here as the formation of stable plugs over most apertures in the visualization window.
This present article is part one of a two-part work investigating the limits of screening operation. The primary objective of part one of this investigation is to get insights into the mechanisms that cause plugging in the screen. In this work it is assumed that plugging is caused by fibre accumulations only. The effects of non-fibre “stickies” or contaminants were not observed, although they could play a role in typical screening operations. In detail, the formation of plugs adjacent to the apertures was analyzed using image analysis tools in MATLAB with permission from Hoffmann et al. (2023). The focus was on measuring the hysteresis and the intermittency of the plugging events. Furthermore, statistical schemes such as probability distributions, which are typically used in the jamming of granular and filtering media, were employed to characterize the intermittency of plugging events for the first time in screening operations. Finally, the concept of a tool to detect plugging based on the fluctuation peaks of the open area data describing the intermittency was introduced.
EXPERIMENTAL
In this work, image and signal processing techniques were exploited to analyze data obtained from the direct visualization of the screen apertures. First, the experimental procedure used in the screen visualization study by Hoffmann et al. (2023) was revisited, and subsequently, an analysis of the video data was conducted.
The experiments had been carried out by Hoffmann et al. (2023) and Aikawa Fiber Technologies (AFT). A Hooper PSV 2100 pressure screen, similar to that in Gooding (1996), was used for the aperture plugging trials. The screen is equipped with a cylinder, which is 0.45 m high and 0.28 m in diameter. The screen is fitted with 51 mm wide rotor tips set at a nominal 2.5 mm rotor-cylinder gap, i.e. the minimum distance between the outside of the rotor tip and inside (feed-side) of the screen cylinder. A Plexiglas window was installed on the outer screen body to visualize a circular region of the screen cylinder. The gap between the window and the cylinder is about 4.5 mm. The schematic of the experimental setup is displayed in Fig. 1. The field of view (see Fig. 2a-b) includes 23 screen holes of diameter w = 2.2 mm that are equally spaced from each other.
A Pulnix TM-640 black and white video camera was used to record videos at 30 frames per second with a 1/150th second shutter speed. A Noram #10903 florescent ring was used for illumination. Canfor, Prince George, supplied Northern Bleached Softwood Kraft (NBSK) pulp for the study. The fully bleached pulps have a brightness of 90% ISO and an arithmetic-average fibre length of roughly 2.5 mm and width of 27 m (Paterson et al. 2021). These values are typical for NBSK pulps. Two sets of pulps with mass consistencies of c = 0.5% (wt/wt), and c = 1.0% (wt/wt) were prepared for the plugging experiments presented in this work. Although typically higher consistencies are employed in screening, lower consistencies were used here to facilitate visualization.
The experimental procedure involved decreasing the rotor speed from an initial value of N = 1000 rpm in a step-wise manner by 100 rpm every 30 seconds for the c = 0.5% suspension and every 90 seconds for the c = 1.0% suspension until plugging was observed. Then, the rotor speed was increased back to the initial value to clear the plugs. The volumetric reject ratio (ratio of reject flow to feed flow) was kept at roughly = 0.15. The feed pressure was around 410 kPa during normal operation. The flow rate was kept constant such that the slot velocity was fixed at about = 0.5 m/s. After the experiments were completed, the videos were saved to a VHS tape for further processing. Further experimental details can be found in Hoffmann et al. (2023).
In this work, the existing screening videos (Hoffmann et al. 2023) were digitized and processed. Plugging was quantified by calculating the open area fraction of the apertures using image processing techniques. A plugging event then represents any instance in which the open area of the holes is reduced significantly. This includes the formation of transient plugs caused by failure of the rotor to fluidize the flocs and the formation of permanent plugs that remain stuck in the apertures. The procedure is summarized in Fig. 3. First, the contrast in the images is enhanced. Then, the images are binarized, thereby separating the clear apertures from the pulp suspension and the screen surface. The aperture holes are isolated by applying a mask to remove the pixels outside the region of interest. The open area fraction A(t) of the apertures is calculated as the sum of the pixels (given as matrices of ones) in the apertures at a given time divided by the pixel sum in the apertures when the screen was fully operational (see Fig 3a).

Fig. 3. Image processing procedure includes enhancing contrast, binarizing, removing noise and masking. The open area fraction is calculated by adding all the “one” pixel values and dividing them by the area of pixels in the operating regime (open holes). In this image, the dark pixels are ones, while the white are zeroes. The open screen aperture is shown in (a); the partially plugged screen is shown in (b). The signal of the corresponding open area fraction A as function of time is shown in (c). The absolute value of fluctuation of the opera area data A′ as function of time is shown in (d).
The moving average of the signal in small time steps ∆t was calculated as follows:
 (1)
(1)
The fluctuation component of the open area signal A’ was isolated by subtracting the raw signal data A(t) by the moving average and presented as an absolute value:
 (2)
(2)
Sample plots of the open area data and the absolute value of the fluctuation component as function of time are displayed in Fig. 3c-d. A combination of ImageJ software and MATLAB are used for this analysis. ImageJ is used as a preliminary step to enhance the contrast in the images. MATLAB is used to calculate the open area and perform signal processing.
RESULTS AND DISCUSSION
Plugging Phenomenology
The plugging events were observed in a small region of the screen cylinder. Sample snapshots of the plugging evolution over time are shown in Fig. 2 for different pulp consistencies. By visual inspection, plugging occurred by a flocculation mechanism, where fibre aggregates form and block the apertures adjacent to the visualization window. The flocculation events occur naturally due to the interaction of the fibres as they approach the apertures. This occurs spontaneously in the concentration regime used in this study (Martinez et al. 2001). The confinement causes the flocs to become stuck, with friction keeping the plugs in place. Similar mechanisms were observed in the flows of dilute to semi-dilute nylon fibres (Villalba et al. 2023) and in the flows of dense fibre suspensions through constrictions (Kerekes 2006).
There were four different states in the evolution of screen plugging. First is the operational state (I) where the high rotor speeds keep the pulp suspension fluidized. There was no discernible change in the flow patterns of fibres and no sign of incipient plugging observed in the images. As the rotor speed is decreased, an intermittent state (II) of pulsating plug-and-release events was observed, although the screen remained operational and in a state of dynamic equilibrium. This behavior is particularly evident for the c = 1.0% pulp suspension. Once the rotor speed is decreased below a critical value, stable flocs start forming progressively within seconds, signaling the start of the plugging state (III). At this point, the rate of floc formation overcomes the rate of floc dispersion and backflush induced by the rotor. The final state (IV) is plug densification which happens when most of the visualization window becomes blocked and the plugs densify.
The propagation of plugs across all apertures in the field of view was gradual, taking about 9 seconds. For the c = 0.5% pulp, the suspended fibres developed into visible flocs that were roughly round in shape and are about as big as the aperture. For the c = 1.0% pulp, the size of the flocs was much larger than the size of the aperture and their shape was rather amorphous. Some flocs spanned across more than one aperture and merged with other flocs as they collided with one another. These flocs become dense plugs that end up filling the gap between the screen cylinder and the Plexiglas window.
Plugging and Cleaning Hysteresis
The extent of screen plugging and cleaning over time was monitored by calculating the open area fraction A(t) of the apertures. The open area fraction signal as function of time is presented in Fig. 4 for the c = 0.5% and c = 1.0% pulp suspensions. The stepwise change in rotor speed is also shown for reference. Note that the fluctuation in the data is larger for the denser suspension.
The average and fluctuations of the area signal were computed according to Eqs. 1 and 2. Figure 5 shows the time-averaged open area fraction of all apertures for pulp suspensions with c = 0.5% and c = 1.0%. The average of the open area signal remained roughly constant as the rotor speed was decreased until a critical value was attained, after which it dropped abruptly in the order of less than 15 seconds. For the c = 0.5% pulp, the critical rotor speed for plugging is N = 300 rpm. For the c = 1.0% pulp, the critical rotor speed is higher at about N = 400 rpm. These results represent a visual confirmation of the findings by Salem (2013) that the critical rotor speed depends, when other things are constant, on the consistency of the pulp suspension.

Fig. 4. Open area fraction of the apertures A and rotor speed N as function of time for (a) c = 0.5% and (b) c = 1.0% pulp suspensions

Fig. 5. Time-averaged open area fraction of all apertures as function rotor speed N for pulp suspensions of c = 0.5% and c = 1.0%. The black horizontal arrow highlights the hysteresis in the cleaning mechanism in the screen.
This article reports a hysteresis in the releasing of the plugs adjacent to the visualization window. Notably, once plugging occurred, the rotor speed needed to be increased significantly more to clear the plugs. In other words, the aperture cleaning threshold was much higher than the plugging threshold. Figure 5 displays the average open area as function of the rotor speed for the two pulp suspensions, where the hysteresis loop is clearly highlighted by the horizontal arrow in the image. Evidently, the hysteresis was more pronounced for the denser pulp suspension, suggesting a strong dependency on fibre concentration. Not only does the higher pulp concentration facilitate fibre interactions and, consequently, floc formation, but it also increases the strength of the plug due to the increased network strength (Derakhshandeh et al. 2010).
The hysteresis could be generated by the effect of the rheology of the network, i.e. elastoviscoplasticity (Martinez et al. 1999; Derakhshandeh et al. 2010; Nikbakht et al. 2014). Indeed, Paterson et al. (2022) showed a hysteresis in the mechanical response of a networked suspension with elastoviscoplastic properties under uni-axial compression. These mechanisms are thought to play an important role in the force balance criteria governing the limits of screening operation and plugging (Martinez et al. 1999).
Plugging Intermittency and Detection
As is evident from the visualization study, the flocculation events displayed an intermittent behavior of plug-and-release events. Following from the filtering media literature (Dressaire and Sauret 2017), the plugging intermittency was characterized by the time intervals between each plugging event by isolating the areas of the individual apertures during the plugging phase. Here, the time intervals were normalized by the slot velocity Vs = 0.5 m/s and the depth of the apertures T = 6 mm. The results are presented as the probability density function  and the cumulative distribution function P(tc) of the time intervals between individual plugging events, as shown in Fig. 6.

Fig. 6. Probability density function and cumulative distribution function (inset) of the time intervals between successive plugging events in the screen. The time is normalized by the slot velocity Vs = 0.5 m/s and depth of the apertures T = 6 mm. The fits of the curves follow exponential distributions with R-squared values greater than 0.92 shown by the solid lines.
Crucially, the plugging intervals followed an exponential distribution, which is indicative of a Poisson or random process. This finding is consistent with the plugging of spherical particles in filtering media (Dressaire and Sauret 2017). As expected, this is also in agreement with the intermittency in the flows of semi-dilute nylon fibres under controlled experimental conditions (Villalba et al. 2023). This agreement could indicate that, fundamentally, similar flocculation mechanisms are at play in the intermittency observed in screening. Furthermore, the time intervals depend on the pulp consistency with the plugging events becoming more frequent as consistency increases.
Upon detailed examination of the screening videos, an increased intermittency in the flocculation events seems to be a precursive behavior indicating the onset of permanent plugging in the screen. Hence, characterizing the dramatic increase in the intermittency is the first step to develop a plugging detection tool. To that end, the open area fluctuations (Fig. 3c) were examined to get insights into the intermittency in screening with the goal of developing a predictive tool for plugging.
To get a broad perspective of the intermittency of the data, the distribution of the open area fluctuation peaks Zp were plotted in the form of probability density functions  . Note that the peak values Zp in the distributions are normalized, i.e., the data are subtracted by the mean and divided by the standard deviation. Thus, the form of distributions with different size peaks could be compared.

Fig. 7. Sample probability density function of the normalized fluctuation peaks Zp of the open area data for c = 1.0% NBSK pulp in (a) the operating regime and (b) during plugging. The dashed-line represents a Gaussian distribution. The colored lines represent lognormal fits. Values of kurtosis K are displayed in panel (b) for comparison.
The typical probability distribution of the open area signal of c = 1.0% pulp under normal operation is shown in Fig. 7a. The distribution of the fluctuation peaks for pulp under operating conditions seemed to follow the shape of a Gaussian or normal distribution, which is shown as a black dashed line in the figure. However, as the rotor speed was decreased, the distribution shifted away from the Gaussian form and started to skew and peak with the fluctuations increasing prior and during plugging. This is clearly depicted in Fig. 7b, which shows a distribution with higher arch and asymmetric tails. This raises the question of whether the shape of the fluctuation distribution is an indicator of the onset of plugging. First, the change in the distribution was quantified. The two metrics typically used to describe the shape of a distribution include skewness and kurtosis. Both are used as benchmarks for nonnormality (Prakash 2022). In this work, the kurtosis of the distribution was calculated, as a measure of the “tailedness” and “peakness” of a distribution that describes the extent of the data that falls in the tails of the distribution (Rigby et al. 2019). In the case of the Gaussian distribution, the kurtosis has a value of K = 1, as defined here. The distribution of the operational regime (Fig. 7a) had a kurtosis value close to one, with K = 1.1. However, the kurtosis of the distribution of during plugging increased up to K = 3.5, as seen Fig. 7b. This means that more data shifted from the shoulders of the distribution to the end tails of the distribution indicating higher intermittency. With this in mind, the kurtosis of the fluctuation peaks was used as a parameter to estimate the degree of intermittency and the onset of plugging.
Figure 8a shows the kurtosis of the fluctuation data as function of rotor speed, where different regions (I-IV) of the screen operation are identified. Figure 8b shows the spatio-temporal average of the images corresponding to the highlighted regions in Fig. 8a. The figure reveals that the fluctuation peaks followed a Gaussian distribution with K = 1 at high rotor speeds N > 600 rpm (region I). Before stable flocs were observed in the image, there was a transient regime (region II) in which the intensity of the plug-and-release events increased even though the screen was operational. Note that in the spatio-temporal image (see Fig. 8b), the apertures appear less dark in region II than in region I, which is indicative of the intensified intermittency of flocculation events. Crucially, this behavior is captured by the small increase in the kurtosis in region II of Fig. 8a.

Fig. 8. Kurtosis as function of rotor speed for NBSK pulp in panel (a). Panel (b) shows the corresponding spatio-temporal images of the highlighted regions from panel (a). Region I corresponds to the normal operating conditions. Region II is a transient state of increased intermittency of flocculation events. Region III presents the formation of plugs. Region IV shows the densification of the plugs.
At the threshold rotor speed of N = 400 rpm in region III, stable plugs started to progressively form. Accordingly, the kurtosis of the fluctuation data increased sharply due to the rapid formation of the plugs. The spatio-temporal image revealed that both stable and transient plugs formed over region III. Finally, in region IV most apertures adjacent to the window were blocked and the plugs became densified. This behavior is shown in the images as large stable flocs form over region IV and was captured as a decrease in the kurtosis of the data as the plugs reach a steady state.
This analysis has revealed insights into the physical phenomena behind the increase in kurtosis of the fluctuation distributions. The kurtosis of is a measurement of the intermittency occurring near screen failure, and as such, this metric could be applied as a soft-sensor to predict plugging in different screening systems. It is expected that other parameters such as the equipment (i.e. rotor type and screen geometries) as well as the stock parameters (i.e. pulp furnish and fibre length) will have a strong effect on plugging. Therefore, further investigation of plugging is needed under different stock conditions and screen geometries. In part 2 of this work, the plugging prediction metric is assessed with readily available pressure measurements obtained in screening trials where different pulp furnishes and screen geometries are employed.
CONCLUSIONS
- Plugs form in the screen by flocculation mechanisms, which follows a Poisson distribution. This is similar to findings in filtering and granular media and, crucially, for the plugging semi-dilute nylon fibres in simplified geometries.
- A hysteresis between the plugging and cleaning thresholds was measured and confirmed. This effect is concentration dependent.
- An increased intermittency occurs at the onset of permanent plugging. This phenomenon was characterized by a change in the fluctuation distribution accompanied by an increase in the kurtosis. Based on these preliminary results, the authors speculate that kurtosis of the peak distribution is a metric of the precursory increased intermittency.
ACKNOWLEDGMENTS
The financial support through the NSERC Collaborative Research program, Canada, in conjunction with Aikawa Fiber Technologies Inc., is gratefully acknowledged.
REFERENCES CITED
Ammala, A. (2003). Fractionation of Thermomechanical Pulp in Pressure Screening: An Experimental Study on the Classification of Fibres with Slotted Screen Plates, Ph.D. Dissertation, University of Oulu, Finland.
Ashok, K. (1991). Passage of Fibres through Screen Apertures, Ph.D. Dissertation, University of British Columbia, Canada.
Bliss, T. (2002). Screening tutorial: History and basic principles of screening, in: TAPPI Technology Summit, pp. 745–760.
Dai, J., and Grace, J. R. (2010). “Blockage of constrictions by particles in fluid–solid transport,” International Journal of Multiphase Flow 36, 78-87.
Delfel, S. (2009). A Numerical and Experimental Investigation into Pressure Screen Foil Rotor Hydrodynamics, Ph.D. Dissertation, University of British Columbia, Canada.
Derakhshandeh, B., Hatzikiriakos, S. G., and Bennington, C. P. (2010). “The apparent yield stress of pulp fiber suspensions,” Journal of Rheology 54, 1137-1154.
Dressaire, E., and Sauret, A. (2017). “Clogging of microfluidic systems,” Soft Matter 13, 37-48.
Estevez-Reyes, L. W. (1995). Fault Detection on Pulp Pressure Screens, Ph.D. Dissertation, University of British Columbia, Canada.
Gooding, R. W. (1996). Flow Resistance of Screen Plate Apertures, Ph.D. Dissertation, University of British Columbia, Canada.
Hoffmann, J.D., Craig, D. C., and Gooding, R. (2023). Pulp screening: In-screen imaging and analysis. In-press.
Jokinen, H., Ammala, A., Niinimaki, J., Virtanen, J.A., and Lindroos, K. (2006). “Effect of bar geometry on screen plate performance. A laboratory study on pressure screening,” Nordic Pulp & Paper Research Journal 21, 451-459.
Jokinen, H., Ammala, A., Virtanen, J.A., Lindroos, K., and Niinimaki, J. (2007). “Pressure screen capacity-current findings on the role of wire width and height,” Tappi Journal 6, 3.
Kerekes, R. J. (2006). “Rheology of suspensions: Rheology of fibre suspensions in papermaking: An overview of recent research,” Nordic Pulp & Paper Research Journal 21, 598-612.
Li, W. (2020). Numerical Study of a Transient Bifurcating-flow Near Slotted Apertures, Ph.D. Dissertation, University of British Columbia, Canada.
Li, Y. (2003). Power Consumption in Pressure Screens, Ph.D. Dissertation, University of British Columbia, Canada.
Martinez, D., Buckley, K., Jivan, S., Lindstrom, A., Thiruvengadaswamy, R., Olson, J., Ruth, T., and Kerekes, R. (2001). “Characterizing the mobility of papermaking fibres during sedimentation,” in: The Science of Papermaking: Transactions of the 12th Fundamental Research Symposium, Oxford. The Pulp and Paper Fundamental Research Society, Bury, UK, pp. 225-254.
Martinez, D. M., Gooding, R. W., and Roberts, N. (1999). “A force balance model of pulp screen capacity,” Tappi Journal 82, 181-187.
Mohamad, M. (2012). Multistage Fibre Length Fractionation of Softwood Chemical Pulp Using a Pressure Screen Equipped with Smooth-holed Screen Cylinder, Ph.D. Dissertation, University of British Columbia, Canada.
Nikbakht, A., Madani, A., Olson, J., and Martinez, D. (2014). “Fibre suspensions in hagen–poiseuille flow: Transition from laminar plug flow to turbulence,” Journal of Non-Newtonian Fluid Mechanics 212, 28-35.
Olson, J. A. (1996). The Effect of Fibre Length on Passage through Narrow Apertures, Ph.D. Dissertation, University of British Columbia, Canada.
Olson, J. A., Turcotte, S. W., and Gooding, R. (2004). “Determination of power requirements for solid core pulp screen rotors,” Nordic Pulp & Paper Research Journal 19, 213-217.
Paterson, D. T., Eaves, T. S., Hewitt, D. R., Balmforth, N. J., and Martinez, D. M. (2021). “On two-phase modeling of dewatering pulp suspensions,” AIChE Journal 67, article e17277.
Paterson, D. T., Eaves, T. S., Hewitt, D. R., Balmforth, N. J., and Martinez, D. M. (2022). “One-dimensional compression of a saturated elastoviscoplastic medium,” Physical Review Fluids 7, article 054303.
Prakash, K. B. (2022). Data Science Handbook: A Practical Approach, John Wiley & Sons, Hoboken, NJ, USA.
Rigby, R. A., Stasinopoulos, M. D., Heller, G. Z., and De Bastiani, F. (2019). Distributions for Modeling Location, Scale, and Shape: Using GAMLSS in R, CRC Press, Boca Raton, FL, USA.
Salem, H. J. (2013). Modeling the Maximum Capacity of a Pulp Pressure Screen, Ph.D. Dissertation, University of British Columbia, Canada.
Villalba, M. E., Daneshi, M., and Martinez, D. M. (2023). “Characterizing jamming of dilute and semi-dilute fiber suspensions in a sudden contraction and a t-junction,” Physics of Fluids 35.
Wakelin, R.F., and Corson, S. R. (1997). “TMP long fibre fractionation with pressure screens,” Pulp and Paper Canada- Ontario 98, 179-183.
Article submitted: January 26, 2024; Peer review completed: February 17, 2024; Revised version received and accepted: February 21, 2024; Published: February 27, 2024.
DOI: 10.15376/biores.19.2.2404-2416