
Abstract
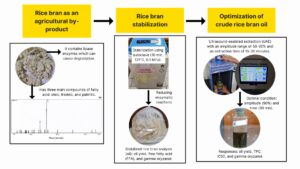
This research aimed to stabilize rice bran to reduce enzymatic reactions and optimize rice bran oil extraction using ultrasound-assisted extraction (UAE). The optimization was performed using response surface methodology (RSM). The results showed that rice bran oil has three primary fatty acids (oleic, linoleic, palmitic). Stabilization of rice bran using an autoclave (121 °C) for 10 min was recommended, with oil yield (14.2%), free fatty acid/FFA (0.41%), and gamma oryzanol (16.1 ppm). The storage significantly affected oil yield and gamma oryzanol but not FFA (p>0.05). The untreated and stabilized rice bran FFA during 18-day storage ranged from 1.33 to 5.73% and 0.41 to 1.12%. This confirmed that stabilization could inactivate lipase enzymes by reducing FFA. The optimization showed that the linear model best explained oil yield, total phenol content (TPC), and antioxidant activity (IC50), while the 2FI model was best fitted for gamma oryzanol. The optimal condition was found for UAE extraction at an amplitude of 90% and a time of 30 min. Verifying optimal conditions resulted in oil yield (13.6%), TPC (44.8 mg GAE/g), IC50 (207.2 ppm), and gamma oryzanol (15.8 ppm). Further in-depth studies are required to investigate using green solvents in the UAE and gamma oryzanol purification.
Download PDF
Full Article
Rice Bran Stabilization Using Autoclave and Optimization of Crude Rice Bran Oil Recovery Using Ultrasound-Assisted Extraction
Dodyk Pranowo, Tsamara Dhany Savira,* and Sukardi
This research aimed to stabilize rice bran to reduce enzymatic reactions and optimize rice bran oil extraction using ultrasound-assisted extraction (UAE). The optimization was performed using response surface methodology (RSM). The results showed that rice bran oil has three primary fatty acids (oleic, linoleic, palmitic). Stabilization of rice bran using an autoclave (121 °C) for 10 min was recommended, with oil yield (14.2%), free fatty acid/FFA (0.41%), and gamma oryzanol (16.1 ppm). The storage significantly affected oil yield and gamma oryzanol but not FFA (p>0.05). The untreated and stabilized rice bran FFA during 18-day storage ranged from 1.33 to 5.73% and 0.41 to 1.12%. This confirmed that stabilization could inactivate lipase enzymes by reducing FFA. The optimization showed that the linear model best explained oil yield, total phenol content (TPC), and antioxidant activity (IC50), while the 2FI model was best fitted for gamma oryzanol. The optimal condition was found for UAE extraction at an amplitude of 90% and a time of 30 min. Verifying optimal conditions resulted in oil yield (13.6%), TPC (44.8 mg GAE/g), IC50 (207.2 ppm), and gamma oryzanol (15.8 ppm). Further in-depth studies are required to investigate using green solvents in the UAE and gamma oryzanol purification.
DOI: 10.15376/biores.18.4.8341-8361
Keywords: Autoclave; Optimization; Rice bran oil; Ultrasound-assisted extraction
Contact information: Department of Agro-industrial Technology, Faculty of Agricultural Technology, Universitas Brawijaya, Malang 65145, Indonesia; *Corresponding author: tsamaradhanysavira@gmail.com
GRAPHICAL ABSTRACT
INTRODUCTION
Rice (Oryza sativa L.), one of the most important agricultural commodities, has significantly contributed to the world’s food needs. Indonesia, the third largest rice-producing country globally, has contributed to world rice production (Setyanto et al. 2018); which amounted to 31.3 million tons in 2021 (BPS 2022). High rice production parallels an increased generation of rice milling by-products, such as rice bran. Rice bran is the second outer layer of rice removed through a milling process to obtain white rice grains (Sharif et al. 2014; Garofalo et al. 2022).
Rice bran utilization has been limited to low-quality animal feed production or directly disposed of as it is easily degraded and contains lipase enzymes as precursors of rancidity (Sohail et al. 2017; Dubey et al. 2019). However, 60% of rice’s nutrients are contained in its bran (Garofalo et al. 2021). Rice bran contains fat (15 to 22%), carbohydrates (34.1 to 52.3%), fiber (7 to 11.4%), ash (6.6 to 9.9%), water (8 to 12%), and protein (10 to 16%), making it a potential substrate for further valorization (Fabian and Ju 2011). The fat content in rice bran also contains unsaponifiable fractions as the primary compounds (i.e., tocopherols, tocotrienols, phytosterols, and gamma oryzanol). These fractions can be recovered via a rice bran’s oil extraction (Garofalo et al. 2021).
The fat fractions in rice bran are susceptible to unintended oxidation and degradation during storage. This susceptibility is partly attributable to lipase enzymes hydrolyzing fat into free fatty acids (FFAs) and glycerol (Panjaitan et al. 2019). Then, FFA is oxidized to peroxides, ketones, and aldehydes, which cause rancidity (Siswanti et al. 2019; Garofalo et al. 2021). Dubey et al. (2019) stated that stabilization as a pre-treatment can reduce enzymatic reactions. One of the stabilization methods widely applied is autoclave heating. This method effectively increased the stability of rice bran oil against oxidation through lipase inactivation, resulting in 10.73% lipase activity which was much lower than other heating methods (i.e., 30 to 35% lipase activity) (El-gammal 2017; Yu et al. 2020).
Oil from stabilized rice bran can be extracted using ultrasound-assisted extraction (UAE). The UAE technology is preferable due to its lower thermal energy consumption (i.e., non-thermal), lower loss of bioactive compounds, short extraction time, and high oil yield (Picó 2013; Garofalo et al. 2021). It has been shown by Oprescu et al. (2022) in rapeseed oil extraction that UAE (80%, 5 mins) yielded 13.5% oil, with total energy 51.6 kJ/g and productivity 6.67 g/(L*min). While extraction using reflux (15 mins) yielded 14.4% oil, with total energy 205 kJ/g and productivity 2.37 g/(L*min). A high amplitude can accelerate the cavitation process, causing physical changes starting from creating, enlarging, and exploding micro-bubbles of dissolved gas in liquids; thus, oil (yield) and functional compounds can be produced (Clark et al. 2013; Krishnan et al. 2015). However, limited studies have been reported on rice bran oil extraction. Therefore, this research evaluated the impact of stabilization time on the quality of rice bran oil and optimized rice bran oil extraction using the UAE method.
EXPERIMENTAL
Materials
The rice bran used was the Inpari-30 variety (Ngawi, East Java, Indonesia), obtained from the second polish due to its highest fat content. The bran was then cleaned, ground, and sieved using a 30-mesh sieving. The rice bran was used as the sample for the stabilization experiment. The proximate characteristics of rice bran used in this study compared with other studies and the Indonesian National Standard (or Standard National Indonesia/SNI 01-4439-1998) are shown in Table 1.
Table 1. The Proximate Characteristics of Rice Bran

The proximate test of rice bran aims to identify rice bran’s protein, fat, air, ash, and carbohydrate content. The proximate analysis method mainly refers to the Association of Analytical Community (AOAC) method in Satter et al. (2014). Based on the analysis, the rice bran used as a substrate followed the standard values.
Experimental Set-up
The experiment was performed in two stages: stabilization and extraction using UAE.
Experimental set-up for stabilization stages
A one-factor randomized block design (RBD) was used with a single factor of stabilization time (i.e., 10, 20, 30, and 40 min), coded as T1, T2, T2, and T4. Each treatment was carried out in triplicate, and the average data was presented.
Experimental set-up for extraction using UAE
The optimization experiment was designed using response surface methodology (RSM) with the Central Composite Design (CCD) model, which involves the independent variable and the dependent variable (response). The independent variables include amplitude (X1, 50-90%) and time (X2, 15-30 min). With some modifications, the range of each independent variable was based on previous studies (Krishnan et al. 2015; İşçimen and Hayta 2018; Phongthai et al. 2016). The response variables include oil yield (Y1), total phenolic content/TPC (Y2), antioxidant activity or IC50 (Y3), and gamma oryzanol (Y4). The points range and level of the variables used in the CCD model are shown in Table 2.
Table 2. Centralized Composite Points

The second-order polynomial regression equation (Eq. 1) with a 95% confidence level was used to predict the response by considering the input parameters, as explained by Chelladurai et al. (2021),
 (1)
(1)
where Y is a response; X is the independent variable; a0 is a constant; and ai, aii, and aij are the regression coefficients. The second, third, and fourth terms represented the linear, higher-order, and interaction effects.
Stabilization Procedures
With some modifications, the stabilization procedure was based on previous studies (Panjaitan et al. 2019; Siswati et al. 2019; Yu et al. 2020). The rice bran was transferred into polypropylene (thermostable) plastic, wrapped in 3 layers, and tied with cable ties to prevent incoming water. These samples were placed in an autoclave operated at 121 °C and 0.1 MPa. The stabilization times were set according to the designated variables (i.e., 10, 20, 30, and 40 min). The stabilized rice bran was then transferred to new plastics and stored at 25 °C.
Extraction Procedures
The UAE extraction was performed using an Ultrasonic Cell Disrupter-950 (Biobase Bioyu, China) at probe Φ 6 mm with frequency 20 kHz, pulse on 2 s, pulse off 5 s, and powered by 220 V ± 5% AC voltage. The procedure was modified from previous studies explained by Boyko et al. (2020), Djaeni and Listyadevi (2019), and Krishnan et al. (2015). The stabilized rice bran samples were extracted by macerating for 24 h at 24 °C using n-hexane 95% (1:5 w/v). During the extraction, the amplitude (50 to 90%) and time (15 to 30 min) were subjected based on the designated experimental set-up. After extraction, the mixture was filtered using a vacuum filter, resulting in defatted rice bran (DRB) and filtrate. The filtrate was then evaporated using a rotary vacuum evaporator (at 50 °C and 50 rpm for 10 min) to separate the oil from the solvent. The quality of rice bran oil was evaluated for its parameters, including free fatty acid (FFA), gamma oryzanol, and oil yield.
Analysis
Gas chromatography-mass spectrometry (GC-MS) analysis
The GC-MS analysis was done to determine the chemical composition of rice bran fatty acids. The analysis procedure was based on Krishnan et al. (2015). The oven temperature was set isothermally to 110 °C for 2 min holding time, then increased at 10 °C/min to 280 °C and maintained at that temperature. Helium was the carrier gas flowing at a 1 mL/min rate. An aliquot of 2 µL of oil was injected into the column at a separation ratio 10:1. GC ran for 36 min. The mass spectrometer (MS) was scanned in the 45 to 450 m/z range. The fatty acid components were identified by matching the recorded mass spectra with the data provided by the GC-MS software. The MS’s running time was 30 min. Standard methyl esters of fatty acids were used as authentic samples. The determination of fatty acids was carried out by comparison with standards and calculated as a percentage of the total area of the methyl ester peaks.
Determination of oil yield
The oil yield from stabilization experiment was calculated using Eq. 2, as explained by Krishnan et al. (2015).
 (2)
(2)
Determination of free fatty acid (FFA)
The FFA analysis was carried out based on the American Oil Chemists’ Society (AOCS) Ca 5a-40 (1989) method and modified following SNI 7709:2012 about palm cooking oil (Japir et al. 2017; SNI 2012). The oil sample (2.5 g) was weighed and dissolved with 25 mL of warm ethanol and 250 µL of 1% PP indicator. The sample was titrated with 0.1 N NaOH until the color turned pink, lasting at least 30 seconds. The FFA was calculated based on Eq. 3.
 (3)
(3)
Determination of gamma oryzanol
The gamma oryzanol standard solution (5 to 25 ppm) was measured for absorbance (315 nm) using a UV-Vis spectrophotometer. After obtaining the standard curve, the oil sample (0.02 g) was weighed and dissolved with 25 mL of n-heptane. The absorbance of the sample solution was measured at a wavelength of 315 nm (Sangpradab et al. 2021). The concentration of gamma oryzanol (ppm) was obtained using Eq. 4,
 (4)
(4)
where y is the absorbance obtained.
Determination of total phenolic content (TPC)
The TPC analysis was performed using the Folin-Ciocalteu (FC) method, following Susanty and Bachmid (2016), with some modifications. First, gallic acid standard solutions were made with 20, 40, 60, 80, and 100 ppm concentrations to create a standard curve. A 0.01 g of oil sample was dissolved with 10 mL of methanol. Then, an aliquot of 0.5 mL solution was dissolved with 2.5 mL of FC reagent and 2 mL of Na2CO3 solution (7.5 %w/v). The sample was homogenized and incubated in a dark place for 2 h. The sample absorbance was measured using UV-Vis spectrophotometer at 765 nm. TPC was obtained using the standard curve and expressed the gallic acid equivalent (GAE)/gram of extract. The TPC was calculated based on Eq. 5,
 (5)
(5)
where c is gallic acid equivalent (mg GAE/L), v is sample volume (L), m is the weight of the sample (g), and df is the dilution factor.
Determination of antioxidant activity (IC50)
The antioxidant activity (IC50) analysis was performed using the 2,2-diphenyl-1-picrazil (DPPH) method, following Barki et al. (2017), with slight modifications. First, the 0.2 mM DPPH solution was prepared. The sample solution was prepared by dissolving 0.01 g of oil with 10 mL of hexane, and concentrations of 20, 40, 60, 80, and 100 ppm were made. The control solution was made of a mixture of DPPH and n-hexane (1:2 v/v). Then, 4 mL of sample solution was homogenized with 2 mL of DPPH solution and incubated in a dark place for 1 h. The absorbance of this sample solution was measured at 517 nm. The antioxidant ability was calculated as the percentage of inhibition, as shown in Eq. 6.
![]() (6)
(6)
Statistical Analysis
Design Expert software version 13 was used for optimization with RSM. The one-way analysis of variance (ANOVA) was carried out using SPSS 25 software, with a confidence level of 95%. If significant differences between treatments were observed, the Duncan multiple range test (DMRT) was performed. The selection of the best treatment in the stabilization experiment was done using the Zeleny multiple attribute method (Zeleny 2003), with the parameter of oil yield (max), FFA (min), and gamma oryzanol (max).
RESULTS AND DISCUSSION
Fatty Acid Components of Rice Bran
Results from the GC-MS analysis showed that fatty acid in rice bran oil comprised twenty-five compounds, as shown in Fig. 1 and Table 3. The main three compounds of FA in rice bran (i.e., Inpari 30- Indonesia variety) were oleic acid (9-octadecenoid acid, (E)-) (51.8%), linoleic acid (9.12 -octadecadienoic acid (Z,Z)-) (33.2%), and palmitic acid (n-hexadecanoic acid) (10.2%), respectively. Similarly, Cheong and Xu (2019) and Garofalo et al. (2021) reported that oleic acid (38.4-42.3%), linoleic acid (33.1-37%), and palmitic acid (17-21.5%) were the three main fatty acid compounds in bran oil. Krishnan et al. (2015), however, found that the primary fatty acids detected in rice bran (i.e., Kerala- India variety) were linoleic acid (55.5%), decanoic acid (36.6%), and palmitic acid (3.89%). The differences could be influenced by the type and variety of rice bran used in both studies.

Fig. 1. The Chromatogram of Fatty Acid Compounds in Rice Bran Oil
Table 3. Fatty Acid Compounds of Rice Bran Oil

Unsaturated fatty acids comprise most of the fatty acids in free rice bran oil (55-87%). Oleic acid is a monounsaturated fatty acid, while linoleic acid is a polyunsaturated fatty acid. Palmitic acid in rice bran oil is a saturated fatty acid (Cheong and Xu 2019). Oleic and linoleic acids are essential for growth, physiological function, and body maintenance. In addition, rice bran oil can be used as a cooking oil due to its potential to reduce the risk of cholesterol-related heart disease (Oluremi et al. 2013; Devarajan et al. 2016). Although rice bran oil still contains palmitic acid as a saturated fatty acid, its content is still much lower when compared to palm oil (44.5%) (Oluremi et al. 2013).
Effect of Stabilization Time on Oil Yield, FFA, and Gama Oryzanol
The ANOVA results indicate that the stabilization time significantly affected oil yield and gamma oryzanol (p<0.05) but not on FFA. Compared with untreated rice bran, autoclave heating (at 121 °C) could only increase the oil yield and gamma oryzanol of the oil but not the FFA content (Table 4). The oil yield increased after stabilization may be caused by heat, which triggers tissue softening, protein clumping, and cell wall damage; thus, oil can easily be released (Sarungallo et al. 2020). However, increasing heating time was parallel to a reduction in oil yield. This could be due to the nature of the stabilization process with high-pressure steam, which can lead the material to collapse. Thus, it prevented oil release and made it hard to extract (Ruen-ngam et al. 2016). A study by Ruen-ngam et al. (2016) reported that heating using hot air convection at 70, 100, and 180 °C also caused a decrease in oil yield. Still, the temperature had no significant effect on oil yield. Besides the effect of heat, a decrease in oil yield may also be influenced by mass loss. A previous study claimed that the oil yield percentage is strongly influenced by the extraction method and solvent used (Pengkumsri et al. 2015).
Table 4. Effect of Stabilization Time on Oil Yield, FFA, and Gamma Oryzanol

Note: Different notations (letters) indicate a significant difference (α = 0.05)
± represent SD from three measurements
Studies have shown that stabilization prevents rice bran from deteriorating by deactivating lipase enzymes via heating (Bhosale and Vijayalakshmi 2015; Lavanya et al. 2017). Lipolytic bacteria are microorganisms that produce lipase enzymes (Szymczak et al. 2021). Stabilization treatment can inhibit either reversibly or permanently denatured lipolytic activity, deactivate the lipase enzyme, and reduce FFA (Kim et al. 2014). Stabilization temperatures above 120 °C can denature the enzymes responsible for fat degradation in rice bran (Thanonkaew et al. 2012).
The increase in gamma oryzanol is caused by heating, which can increase extractability, where heat can break the gamma oryzanol bonds previously bound to other macronutrient and micronutrient components (Yu et al. 2020). Similar studies also show that gamma oryzanol may increase after stabilization with various methods, such as hot air (150 °C; 10 min), roasting (150 °C; 10 min), steaming (130 °C; 2 min), microwave (800 W; 2450 mHz; 150 °C; 3 min), or autoclaving (121 °C; 20 min) (Thanonkaew et al. 2012; Patil et al. 2016). Furthermore, the gamma oryzanol content in rice bran is influenced by several factors, such as extraction method, solvent, rice variety, cultivation area, and weather (Sangpradab et al. 2021). A previous study also showed a decreasing trend of oryzanol gamma if the stabilization duration was prolonged. This condition occurs because the longer heating time at high temperatures (> 110 °C) can degrade the bioactive components of rice bran, one of which is gamma oryzanol (Ruen-ngam et al. 2016). However, gamma oryzanol increased when the heating time increased to 40 min. Similar conditions in previous studies showed that gamma oryzanol has stable properties to heat; thus, the value did not consistently decrease when increases the stabilization time (Yilmaz et al. 2013; Srisaipet and Nuddagul 2014; Ruen-ngam et al. 2016).
Selection of Best Treatment on Stabilization Experiment
The best alternative treatment in the stabilization experiment was selected based on various ideal parameters: the maximum average of oil yield, the minimum average of FFA, and the maximum average of gamma oryzanol. The selected treatment was from treatment with the lowest L1, L2, and L∞ values, as shown in Table 5. The best treatment selected was from rice bran stabilized for 10 min (indicated as rank 1).
Table 5. The Selection of the Best Alternative

Table 6 shows the characteristics of rice bran from the selected best treatment. Yoon et al. (2014) stated that the oil yield of rice bran extracted using a hexane solvent could reach a maximum oil yield value of 19%. The FFA value after stabilization decreased by 69.4%, which was much higher than the reported reduction of FFA by 31.6% (Siswanti et al. 2019). Furthermore, the gamma oryzanol value was well within reported values (Van Tang 2017), ranging from 8.2 to 18 ppm. However, variability in the amount and composition of each component of gamma oryzanol was reported in several studies, which could be due to the analytical procedure used. Thus, a standard reference for determining the gamma oryzanol content is still needed (Aladedunye et al. 2013).
Table 6. The Characteristics of Rice Bran from the Selected Best Treatment

Source: a(Yoon et al. 2014); b(Siswanti et al. 2019); c(Van Tang 2017).
Effect of Storage Time on FFA Values
The untreated and selected best stabilization treatment conditions were considered for the storage experiment. The impact of storage time (i.e., for 18 days) on the FFA value of untreated and stabilized rice bran was evaluated. Figure 2 shows that the FFA value of all samples increased during the storage, but the stabilized rice bran still had a much lower FFA. Furthermore, storage for 18 days may lead to increased water activity, which triggers the formation of FFA. A previous study also demonstrated that storage conditions and duration could increase FFA (Panjaitan et al. 2019). Rice bran is hygroscopic. It has the ability to adapt to the surrounding air content by adsorption or desorption. Thus, storage treatment greatly influences the water content (Saidi et al. 2019). It is essential to analyze the water content (max. 12%) in accordance with SNI 01-4439-1998 before stabilization is carried out. Otherwise, the hydrolysis reaction as an equilibrium reaction can run faster when the conditions are rich in water, thereby triggering the formation of FFA as the products (Sapna and Jayadeep 2023). Similarly, other studies have emphasized that prolonged storage of rice bran could increase water activity and trigger FFA formation (Thanonkaew et al. 2012; Ruen-ngam et al. 2016; Siswanti et al. 2019; Irakli et al. 2021).
This study also confirms that the FFA content of untreated rice bran tends to increase more rapidly due to the activity of the lipase enzyme, which is more active in catalyzing oil hydrolysis into FFA. The increase in FFA occurs more slowly in stabilized rice bran because heating at high temperatures can inhibit lipase activity, making it more stable, and the formation of FFA tends to be lower and controlled (Lavanya et al. 2019). This study supports previous studies that autoclaving is an effective method for stabilizing rice bran, as it can reduce FFA and extend storage time (Patil et al. 2016; Ruen-ngam et al. 2016; Panjaitan et al. 2019; Siswanti et al. 2019).

Fig. 2. Comparison of FFA values between Stabilized and Untreated Rice Bran
The Optimization Results of Extraction Using UAE Method
Effect on oil yield response
The optimization results showed that the oil yield was in the range of 9.3 to 14.0%. The highest oil yield response (14%) was obtained from amplitude (90%) and time (30 min), while the lowest oil yield (9.3%) was from amplitude (41.7%) and time (22.5 min) (Table 7). The ANOVA results (Table 8) show the linear model as the selected model due to its significant effect on the oil yield response (p <0.05). This model was recommended to optimize the oil yield response (R2 = 0.80). The oil yield response linear model involves the main effects, such as amplitude (A) and time (B), without any interaction between the two.
The model selection was also based on the high lack of fit value (p> 0.05), as it indicates a small or insignificant error rate (Vera et al. 2014). Despite a significant lack of fit value, the linear model was still selected as the best-fitted model as it has a much higher value than the 2FI, quadratic, and cubic models. Therefore, based on the selected linear model, Eq. 7 was generated to represent the optimal oil yield condition.
Y1 = +11.6 + 1.23 A + 0.66 B (7)
where Y1 is the oil yield (%), A is the amplitude (%), and B is the time (min).
Table 7. The Optimization Results of UAE on Various Responses

Table 8. ANOVA of Oil Yield Response

The resulting equations could also be used to predict the oil yield response of each factor or to identify the relative impact of factors by comparing factor coefficients (Ohale et al. 2017). They claimed that a positive sign (+1) indicates an increase in the response value, while a negative sign (-1) indicates a contradiction. Based on Eq. 7, amplitude and time quantitatively affect the oil yield response (Ohale et al. 2017). Therefore, the increase in oil yield response is affected by an increase in amplitude and time. Furthermore, determining the relative impact of each factor can be expressed quantitatively via the contribution percentage (Pi) and expressed in a Pareto diagram, as Maran et al. (2018) reported. The study also shows amplitude contributed the most to increase or decrease the oil yield (77.8%), while time only contributed 22.2%.
Contour plot graphs and three-dimensional response surface curves were also used to determine the relationship between responses and factors based on model equations, which also help regulate the optimal response value (Elksibi et al. 2016). Figure 3a shows that the surface curve of the linear model had the highest tip (or no peak) as optimal conditions, indicating a decrease was influenced by two factors. The highest oil yield (14%) was shown by the innermost part (reddish orange), and the lowest oil yield (9.3%) was shown by the outermost part (blue). According to Indriani and Wardhani (2022), the red color on the graph shows the optimum peak point, while the blue color shows the lowest response. This figure was by Eq. 7 that increasing the amplitude and time of the UAE can increase the oil yield of rice bran. A high amplitude can increase cavitation, thus damaging more cell walls to release more oil (Clark et al. 2013; Krishnan et al. 2015). Furthermore, the effect of UAE on the oil yield was strongly influenced by the materials used (Zardo and Espíndola 2019). Increasing amplitude in UAE increases the oil yield by accelerating cell swelling accompanied by tissue matrix fragmentation, where these conditions trigger mass transfer and faster solvent penetration (Krishnan et al. 2015). Similarly, the longer the extraction time, the higher the oil yield due to more prolonged contact between the material and the solvent (Otumudia et al. 2022).

Fig. 3. Contour plot graphs and three-dimensional responses: (a) Oil yield, (b) TPC, (c) IC50, and (d) Gamma oryzanol
Effect on TPC response
The TPC was in the range of 25.3 to 53.1 mg GAE/g. The highest TPC response (53.1 mg GAE/g) was obtained from amplitude (70%) and time (33.1 min), while the lowest total phenol (25.3 mg GAE/g) was from amplitude (50%) and time (15 min) (Table 7). The ANOVA results (Table 9) also indicated a similar trend that the linear model was the best-fitted model for TPC response with R2 of 0.80 (p <0.05). Based on the selected linear model, Eq. 8 was generated to predict the optimal TPC values.
Y2 = +37.1 + 5.9 A + 6.70 B (8)
where Y2 is the TPC (mg GAE/g), A is the amplitude (%), and B is the time (min).
Table 9. ANOVA of TPC Response

Equation 7 demonstrates that amplitude and time quantitatively affected the TPC response. Therefore, the increase in TPC response is affected by an increase in amplitude and time. The results further show that time contributed more (56.6%) to the increase or decrease in TPC than the amplitude (43.4%). Figure 3b shows that the surface curve of the linear model had no peak (as optimal conditions), and the two factors caused a decrease. The curve resembles Eq. 8 in the sense that increasing UAE amplitude and time can increase rice bran oil’s TPC.
The effect of UAE on TPC is influenced by cell damage during the extraction. These conditions, apart from facilitating the release of oil, also make other bioactive materials to be easily extracted, and TPC can be produced in a short time (Cheok et al. 2013; Medina-Torres et al. 2017; Zardo and Espíndola 2019). Besides being affected by time and UAE amplitude, the recovery of bioactive compounds is also influenced by solvents, naturally occurring bioactive compounds, extraction procedures, etc. (Cheok et al. 2013). Similarly, the extraction duration provides optimal time for the solvent to penetrate, facilitating the release of phenolic compounds (Krishnan et al. 2015; Medina-Torres et al. 2017). Other studies have confirmed that UAE amplitude and time significantly influenced the TPC of wine (Carrera et al. 2012); mangosteen peel (Cheok et al. 2013); and rice bran protein (İşçimen and Hayta 2018).
Effect on IC50 response
The IC50 values ranged from 203.9 to 229.3 ppm. The lowest antioxidant activity was found from a combination of amplitude (50%) and time (15 min), giving the highest IC50 response of 229.3 ppm. The most potent antioxidant activity was found from the lowest IC50 value (203.9 ppm) obtained from an amplitude of 70% and time of 33.1 min (Table 7). Similarly, the ANOVA results (Table 10) also confirmed that the best-fitted model selected was the linear model with an R2 of 0.90. The IC50 response linear model involves the main effects, such as amplitude (A) and time (B), without any interaction between the two. Furthermore, the model lacks a fit value of 0.20, indicating little or no significant error; thus, it has good accuracy compared to other models (Vera et al. 2014).
Based on the selected linear model, Eq. 9 was generated to represent the optimal IC50 condition.
Y3 = +217.8 – 6.46 A – 7.75 B (9)
where Y3 is the IC50 (ppm), A is the amplitude (%), and B is the time (min).
Table 10. ANOVA of IC50 Response

Based on Eq. 8, amplitude and time as factors had a quantitative effect on the IC50 response. Therefore, an increase in IC50 response was found to be affected by a decrease in amplitude and time. The results further identified that time contributed the most to the increase or decrease in IC50, 59%, while amplitude contributed 41%. Figure 3c also shows a linear relationship between factors and IC50 response, where the highest tip (i.e., no peak) as optimal conditions and a decrease in IC50 response was caused by the two factors. Like Eq. 8, the figure indicates that increasing UAE amplitude and time reduced the IC50 of rice bran oil. The IC50 was categorized as a weak antioxidant activity because it ranged from 100 to 250 ppm (Muhamad et al. 2019). The presence of phenolic compounds indicates antioxidant activity, whereas a high phenol confirmed a high antioxidant activity (Sahini and Mutegoa 2023). The treatment with amplitude (70%) and time (33.1 min) produced rice bran oil with the highest TPC and the lowest IC50 values. Meanwhile, reducing amplitude to 50% and time to 15 min gave the worst results. Therefore, an optimal increase in amplitude and time is required to extract the bioactive compounds easily, hence improving the antioxidant activity (as shown by a decrease in IC50) (Cheok et al. 2013; Krishnan et al. 2015; Medina-Torres et al. 2017; Zardo and Espíndola 2019). The IC50 value is the inhibitory concentration that makes a 50% reduction in free radical activity (DPPH); thus, more excellent antioxidant activity can reduce the number of IC50 (Alomari 2020). Similarly, previous studies have underlined that UAE amplitude and time significantly influenced the antioxidant activity of mangosteen peel (Sholihah et al. 2017); lime peel waste (Rodsamran and Sothornvit 2019); and Dodonaea viscosa plant (Alomari 2020).
Effect on gamma oryzanol response
The gamma oryzanol was in the range of 14.3 to 16.6 ppm. UAE treatment with amplitude (98.3%) and time (22.5 min) produced rice bran oil with the highest gamma oryzanol response (16.6 ppm). The lowest gamma oryzanol (14.3 ppm) was obtained from treatment with amplitude (50%) and time (15 min) (Table 7). The ANOVA results (Table 11) show that the 2FI model achieved a significant response for gamma oryzanol (p <0.05). Thus, the model was selected as the best-fitted model to optimize the gamma oryzanol (R2 = 0.75). The 2FI model involves the main effects, such as amplitude (A) and time (B), as well as the interaction effect between amplitude and time (AB). The selected 2FI model had a lack of fit value of 0.10, indicating an insignificant result or showing little (or no) significant error (>0.05); thus, the model had good accuracy compared to other models (Vera et al. 2014).
Table 11. ANOVA of Gamma Oryzanol Response

Based on the selected 2FI model, Eq. 10 was generated to denote the optimal gamma oryzanol condition.
Y4 = 15.7 + 0.43 A + 0.27 B – 0.53 AB (10)
where Y4 is the gamma oryzanol (ppm), A is the amplitude (%), and B is the time (min).
Based on Eq. 9, amplitude and time as factors quantitatively affected the gamma oryzanol response. Therefore, increases in gamma oryzanol were parallel to an increase in amplitude and time or a decrease in amplitude-time interaction. The results also show that amplitude-time interaction contributed the most to the increase or decrease of gamma oryzanol by 52.3%. Amplitude and time contributed 33.9% and 13.8%, respectively.
Three-dimensional surface visualization of the relationship between factors and gamma oryzanol (Fig. 3d) also showed no peaks in the curve. The highest gamma oryzanol (16.6 ppm) and the lowest gamma oryzanol (14.3 ppm) were observed. Similarly, Chukwuemeka et al. (2019) also found that the 2FI model curve did not indicate an exclusive dependency on one of the factors as an optimal condition. However, it explained an interaction between the two factors. The curve in this study was more amplitude skewed. This is by Eq 10, where the contribution of amplitude-time > amplitude > time. Thus, increasing the UAE amplitude and time can increase the gamma oryzanol of rice bran oil.
Gamma oryzanol is one of the important bioactive components in rice bran. Gamma oryzanol has higher antioxidant activity than other minor bioactive components (Sohail et al. 2017). This study found that the effect of UAE amplitude and time on gamma oryzanol content was similar to TPC and IC50. An optimal increase in UAE amplitude and time can make bioactive compounds extraction easier and increase the resulting gamma oryzanol (Cheok et al. 2013; Krishnan et al. 2015; Medina-Torres et al. 2017; Zardo and Espíndola 2019; Loypimai et al. 2020).
A previous study by Loypimai et al. (2020) showed that UAE extraction with time (20 to 40 min) and amplitude (20 to 40%) increased gamma oryzanol. Their study reported that the optimal condition for UAE extraction was 40 min and 40% amplitude, giving the gamma oryzanol concentration of 490 µg/g. Besides UAE producing good solvent penetration, the type of solvent used is also critical (Loypimai et al. 2020). Hexane solvent has been widely used in rice bran oil extraction because it is low corrosive, has high stability, has an excellent capacity to dissolve oil, and primarily extracts gamma oryzanol compounds (Garofalo et al. 2021). Therefore, besides amplitude and time, the UAE extraction is also influenced by hexane solvents and rice bran varieties.
Verification of the optimal solution
The prediction of the optimal solution was obtained from the UAE treatment with amplitude (90%) and time (30 min). This treatment had an oil yield of 13.5%, TPC of 49.7 mg GAE/g, IC50 of 203.5 ppm, and gamma oryzanol of 15.9 ppm. The resulting desirability value was 0.84. According to Vera et al. (2014), the desirability value ranged from 0 to 1, with a value closer to 0 tending to be undesirable, and vice versa. This study shows that all selected models can be used for optimization purposes. Table 12 indicates that the verification results were within the prediction range. According to Singh and Singh (2018), a good fit between the experimental and the predicted results verifies the model’s validity and the existence of optimal points. Thus, the findings confirmed that RSM is essential in optimizing process variables and determining the correct optimal values.
Table 12. Comparison of Actual and Predicted Verification Results

CONCLUSIONS
- Rice bran oil has three main fatty acid compounds, including oleic (51.8%), linoleic (33.2%), and palmitic acid (10.2%).
- Stabilization by autoclaving (121 °C) for 10 min produced the best quality rice bran oil, with oil yield (14.2%), FFA (0.41%), and gamma oryzanol (16.1 ppm). Stabilization for 10 min significantly affected the oil yield and gamma oryzanol but not the FFA value.
- Untreated rice bran significantly increased FFA values within 18-day storage (1.33 to 5.73%) in comparison to stabilized rice bran (0.41 to 1.12%). Storage conditions and duration affect the FFA values of rice bran. The stabilization of rice bran inhibits an increase of FFA during storage.
- The optimization results of rice bran oil extraction reached optimal conditions at an amplitude of 90% and an extraction time of 30 min. The results show that increasing the amplitude and extraction time can optimize the oil yield, TPC, IC50, and gamma oryzanol responses. Verifying optimal conditions resulted in an oil yield (13.6%), TPC (44.8 mg GAE/g), IC50 (207.2 ppm), and gamma oryzanol (15.8 ppm).
- An in-depth study is essential to improve stabilized rice bran’s storage condition, such as at low temperatures’ storage. The use of green solvents in UAE and the purification of gamma oryzanol from rice bran oil are also critical for future research.
REFERENCES CITED
Aladedunye, F., Przybylski, R., Rudzinska, M., and Klensporf-Pawlik, D. (2013). “γ-oryzanols of North American wild rice (Zizania palustris),” Journal of The American Oil Chemists’ Society 90, 1101-1109. DOI: 10.1007/s11746-013-2252-x
Alomari, A. A. L. I. (2020). “Ultrasound-assisted extraction of phenolic, flavonoid and antioxidant compounds from Dodonaea viscose and its green synthesis of silver nanoparticles by aqueous extract,” Oriental Journal of Chemistry 36(1), 179-188.
Badan Standardisasi Nasional. (2012). “Minyak Goreng Sawit. SNI 7709:2012, 1-28.
Barki, T., Kristiningrum, N., Puspitasari, E., and Fajrin, F. A. (2017). “Penetapan kadar fenol total dan pengujian aktivitas antioksidan minyak jahe gajah (Zingiber officinale var. officinale),” E-Jurnal Pustaka Kesehatan 5(3), 432-436.
Bhosale, S., and Vijayalakshmi, D. (2015). “Processing and nutritional composition of rice bran,” Current Research in Nutrition and Food Science 3(1), 74-80. DOI: 10.12944/CRNFSJ.3.1.08
Boyko, N. N., Zhilyakova, E. T., Pisarev, D. I., Novikov, O. O., Sahaidak-Nikitiuk, R. V., Kuznietsova, V. Y. U., Shpychak, O. S., Tkachev, A. V., Kovalenko, A. M., and Sushchuk, N. A. (2020). “A novel method for the extraction of the main compounds from the essential oil of clove buds,” Farmacia 68(1), 170-175. DOI: 10.31925/farmacia.2020.1.24
BPS. (2022). Berita Resmi Statistik. https://www.bps.go.id/pressrelease/2022/03/01/1909/produksi-padi-tahun-2021-turun-0-43-persen–angka-tetap-.html#:~:text=Produksi padi pada 2021 yaitu,54%2C65 juta ton GKG.
Carrera, C., Ruiz-rodríguez, A., Palma, M., and Barroso, C. G. (2012). “Ultrasound assisted extraction of phenolic compounds from grapes,” Analytica Chimica Acta 732, 100-104. DOI: 10.1016/j.aca.2011.11.032
Chelladurai, S., Murugan, K., Pratip, A., Upadhyaya, M., Narasimharaj, V., and Gnanasekaran, S. (2021). “Optimization of process parameters using response surface methodology: A review,” Materials Today: Proceedings 37, 1301-1304. DOI: 10.1016/j.matpr.2020.06.466
Cheok, C. Y., Chin, N. L., Yusof, Y. A., Talib, R. A., and Law, C. L. (2013). “Optimization of total monomeric anthocyanin (TMA) and total phenolic content (TPC) extractions from mangosteen (Garcinia mangostana Linn.) hull using ultrasonic treatments,” Industrial Crops and Products 50, 1-7. DOI: 10.1016/j.indcrop.2013.07.024
Cheong, L.-Z., and Xu, X. (2019). “Rice bran and rice bran oil: Chemistry, processing and utilization,” in: Rice Bran and Rice Bran Oil, Elsevier. DOI: 10.1016/c2016-0-02191-5
Chukwuemeka, E. D., Cyril, E. M., and Aguh, P. S. (2019). “Statistical evaluation of the effect of process parameters on the depth of penetration of tungsten inert gas arc cladding weld in mild steel,” Asian Journal of Advanced Research and Report 7(1), 1-13. DOI: 10.9734/ajarr/2019/v7i130166
Clark, J. H., Kraus, G. A., Andrzej, S., Siedl, P., and Kou, Y. (2013). Natural Product Extraction: Principles and Applications (M. A. Rostagno and J. M. Prado (eds.)). RSC Green Chemistry. DOI: 10.1039/9781849737579-fp001
Devarajan, S., Singh, R., Chatterjee, B., Zhang, B., and Ali, A. (2016). “A blend of sesame oil and rice bran oil lowers blood pressure and improves the lipid profile in mild-to-moderate hypertensive patients,” Journal of Clinical Lipidology 10(2), 339-349. DOI: 10.1016/j.jacl.2015.12.011
Djaeni, M., and Listyadevi, Y. L. (2019). “The ultrasound-assisted extraction of rice bran oil with n-hexane as a solvent,” IOP Conference Series: Journal of Physics 1295, 1-6. DOI: 10.1088/1742-6596/1295/1/012027
Dubey, B. N., Fitton, D., Nahar, S., and Howarth, M. (2019). “Comparative study on the rice bran stabilization processes: A review comparative study on the rice bran stabilization processes: A review,” Research and Development in Material Science 11(2), 1-6. DOI: 10.31031/RDMS.2019.11.000759
El-gammal, R. E. (2017). “Effect of pre-thermal treatments on chemical characteristics, bioactive compounds and microstructure of rice bran,” Journal Food and Dairy Science 8(1), 1-7.
Elksibi, I., Haddar, W., Ticha, M. Ben, and Mhenni, M. F. (2016). “Development and optimisation of a non conventional extraction process of natural dye from olive solid waste using response surface methodology (RSM),” Food Chemistry 161(2014), 345-352. DOI: 10.1016/j.foodchem.2014.03.108
Fabian, C., and Ju, Y. H. (2011). “A review on rice bran protein: Its properties and extraction methods,” Critical Reviews in Food Science and Nutrition 51(9), 816-827. DOI: 10.1080/10408398.2010.482678
Faizah, F., Kusnandar, F., and Nurjanah, S. (2020). “Senyawa fenolik, oryzanol, dan aktivitas antioksidan bekatul yang difermentasi dengan Rhizopus oryzae,” Jurnal Teknologi Dan Industri Pangan 31(1), 86-94. DOI: 10.6066/jtip.2020.31.1.86
Garofalo, S. F., Demichelis, F., Mancini, G., Tommasi, T., and Fino, D. (2022). “Conventional and ultrasound-assisted extraction of rice bran oil with isopropanol as solvent,” Sustainable Chemistry and Pharmacy 29, 1-10. DOI: 10.1016/j.scp.2022.100741
Garofalo, S. F., Tommasi, T., and Fino, D. (2021). “A short review of green extraction technologies for rice bran oil,” Biomass Conversion and Biorefinery 11(2), 569-587. DOI: 10.1007/s13399-020-00846-3
Indriani, D. W., and Wardhani, T. R. (2022). “Modeling of extraction of silica rendemen husk rice (Oryza sativa l.) by microwave extraction assisted (MAE) using response surface methodology (RSM),” IOP Conference Series: Earth and Environmental Science 963, 1-8. DOI: 10.1088/1755-1315/963/1/012048
Irakli, M., Lazaridou, A., and Biliaderis, C. G. (2021). “Comparative evaluation of the nutritional, antinutritional, functional, and bioactivity attributes of rice bran stabilized by different heat treatments,” Foods 10(57), 1-18.
İşçimen, E. M., and Hayta, M. (2018). “Optimisation of ultrasound assisted extraction of rice bran proteins: Effects on antioxidant and antiproliferative properties,” Quality Assurance and Safety of Crops and Foods 10(2), 165-174. DOI: 10.3920/QAS2017.1186
Japir, A. A., Salimon, J., Bahadi, M., and Al-shuja, S. (2017). “Physicochemical characteristics of high free fatty acid crude palm oil,” Oilseeds and Fats Crops and Lipids 24(5), 1-9. DOI: 10.1051/ocl/2017033
Kim, S., Chung, H., and Lim, S. (2014). “Effect of various heat treatments on rancidity and some bioactive compounds of rice bran,” Journal of Cereal Science 60(1), 243-248. DOI: 10.1016/j.jcs.2014.04.001
Krishnan, V., Kuriakose, S., and Rawson, A. (2015). “Ultrasound assisted extraction of oil from rice bran: A response surface methodology approach,” Food Processing Technology 6(6), 1-7. DOI: 10.4172/2157-7110.1000454
Lavanya, M. N., Saikiran, K. C. S., and Venkatachalapathy, N. (2019). “Stabilization of rice bran milling fractions using microwave heating and its effect on storage,” Journal of Food Science and Technology 56(2), 889-895. DOI: 10.1007/s13197-018-3550-y
Lavanya, M. N., Venkatachalapathy, N., and Manickavasagan, A. (2017). “Physicochemical characteristics of rice bran,” in: Brown Rice, A. Manickavasagan, C. Santhakumar, and N. Venkatachalapathy (eds.), Springer, Cham, Switzerland, pp. 79-90. DOI: 10.1007/978-3-319-59011-0
Loypimai, P., Moongngarm, A., Sittisuanjik, A., and Khamanan, S. (2020). “Optimization of tocols and γ-oryzanol extraction from rice bran using ultrasound and soybean oil as a green solvent,” Food Research 4(6), 2322-2332. DOI: 10.26656/fr.2017.4(6).360
Maran, J. P., Mekala, V., and Manikandan, S. (2018). “Modeling and optimization of ultrasound-assisted extraction of polysaccharide from Cucurbita moschata,” Carbohydrate Polymers 92(2), 2018-2026. DOI: 10.1016/j.carbpol.2012.11.086
Medina-Torres, N., Ayora-Talavera, T., and Espinosa-Andrews, H. (2017). “Ultrasound assisted extraction for the recovery of phenolic compounds from vegetable sources,” Agronomy 7(47), 2-19. DOI: 10.3390/agronomy7030047
Muhamad, S. H. A., On, S., Sanusi, S. N. A., Hashim, A. A., and Addinna Zai, M. H. (2019). “Antioxidant activity of camphor leaves extract based on variation solvent,” Journal of Physics: Conference Series 1349(1). DOI: 10.1088/1742-6596/1349/1/012102
Ohale, P. E., Uzoh, C. F., and Onukwuli, O. D. (2017). “Optimal factor evaluation for the dissolution of alumina from azaraegbelu clay in acid solution using RSM and ANN comparative analysis,” South African Journal of Chemical Engineering 24, 43-54. DOI: 10.1016/j.sajce.2017.06.003
Oluremi, O. I., Solomon, A. O., and Saheed, A. A. (2013). “Fatty acids, metal composition and physico-chemical parameters of Igbemo Ekiti rice bran oil,” Journal of Environmental Chemistry and Ecotoxicology 5(3), 39-46. DOI: 10.5897/JECE2012.0005
Oprescu, E. E., Enascuta, C. E., Radu, E., Udrescu, M. C., and Lavric, V. (2022). “Does the ultrasonic field improve the extraction productivity compared to classical methods – Maceration and reflux distillation,” Chemical Engineering and Processing – Process Intensification 177, 1-11. DOI: 10.1016/j.cep.2022.109082
Otumudia, E., Hamidi, H., Jadhawar, P., and Wu, K. (2022). “The utilization of ultrasound for improving oil recovery and formation damage remediation in petroleum reservoirs: Review of most recent researches,” Energies 15(4906), 1-20.
Panjaitan, R. F., Febriani, and Helwati, H. (2019). “Effect of heating using autoclave and microwave on the quality of rice bran as food material,” IOP Conference Series: Earth and Environmental Science 364(1), 1-5. DOI: 10.1088/1755-1315/364/1/012002
Patil, S. S., Kar, A., and Mohapatra, D. (2016). “Food and bioproducts processing stabilization of rice bran using microwave : Process optimization and storage studies,” Food and Bioproducts Processing 99, 204-211. DOI: 10.1016/j.fbp.2016.05.002
Pengkumsri, N., Chaiyasut, C., Sivamaruthi, B. S., Saenjum, C., Sirilun, S., Peerajan, S., Suwannalert, P., Sirisattha, S., Chaiyasut, K., and Kesika, P. (2015). “The influence of extraction methods on composition and antioxidant properties of rice bran oil,” Food Science and Technology (Brazil) 35(3), 493-501. DOI: 10.1590/1678-457X.6730
Phongthai, S., Lim, S. T., and Rawdkuen, S. (2016). “Ultrasonic-assisted extraction of rice bran protein using response surface methodology,” Journal of Food Biochemistry 41(2), 1-11. DOI: 10.1111/jfbc.12314
Picó, Y. (2013). “Ultrasound-assisted extraction for food and environmental samples. TrAC – Trends in Analytical Chemistry 43, 84-99. DOI: 10.1016/j.trac.2012.12.005
Rodsamran, P., and Sothornvit, R. (2019). “Extraction of phenolic compounds from lime peel waste using ultrasonic-assisted and microwave-assisted extractions,” Food Bioscience 28(2019), 66-73. DOI: 10.1016/j.fbio.2019.01.017
Ruen-ngam, D., Thawai, C., and Sukonthamut, S. (2016). “Pretreatment to increase yield and antioxidant activity of γ -oryzanol in rice bran oil,” Science Asia 42, 75-82. DOI: 10.2306/scienceasia1513-1874.2016.42.075
Sahini, M. G., and Mutegoa, E. (2023). “Extraction, phytochemistry, nutritional, and therapeutical potentials of rice bran oil: A review,” Phytomedicine Plus 3(2), article 100453. DOI: 10.1016/j.phyplu.2023.100453
Saidi, I. A., Efendi, N., Sulistiyowati, W., and Cahyana, A. S. (2019). “Quality of rice bran submitted to different stabilization procedures during storage periods,” IOP Conference Series: Journal of Physics 1232, 1-6. DOI: 10.1088/1742-6596/1232/1/012046
Sangpradab, J., Kamonpatana, P., Suwannaporn, P., and Huang, T. C. (2021). “Ohmic heating-aided mechanical extraction of gamma-oryzanol and phytosterols in rice bran oil,” Food and Bioprocess Technology 14(8), 1542-1554. DOI: 10.1007/s11947-021-02655-6
Sapna, I., and Jayadeep, A. (2023). “Transformation of endoxylanase treated red rice bran into a potential ready-to-use functional food ingredient through drum drying: impact on physicochemical, nutraceutical, storage, and product forming properties,” Journal of Cereal Science 110, 1-9. DOI: 10.1016/j.jcs.2023.103640
Sarungallo, Z. L., Hariyadi, P., Andarwulan, A., and Purnomo, E. H. (2020). “Effect of heat treatment prior to extraction on the yield and quality of red fruit (Pandanus conoideus) oil,” Food Research 4(3), 659-665. DOI: 10.26656/fr.2017.4(3).281
Satter, M. A., Ara, H., Jabin, S. A., Abedin, N., Azad, A. K., Hossain, A., and Ara, U. (2014). “Nutritional composition and stabilization of local variety rice bran BRRI-28,” International Journal of Science and Technology 3(5), 306-313
Setyanto, P., Pramono, A., Adriany, T. A., Susilawati, H. L., Tokida, T., Padre, A. T., Minamikawa, K., Setyanto, P., Pramono, A., Adriany, T. A., and Susilawati, H. L. (2018). “Soil science and plant nutrition alternate wetting and drying reduces methane emission from a rice paddy in Central Java, Indonesia without yield loss,” Soil Science and Plant Nutrition 64(1), 23-30. DOI: 10.1080/00380768.2017.1409600
Sharif, M. K., Butt, M. S., Anjum, F. M., and Khan, S. H. (2014). “Rice bran: A novel functional ingredient,” Critical Reviews in Food Science and Nutrition 54(6), 807-816. DOI: 10.1080/10408398.2011.608586
Sholihah, M., Ahmad, U., and Budiastra, I. W. (2017). “Aplikasi gelombang ultrasonik untuk meningkatkan rendemen ekstraksi dan efektivitas antioksidan kulit manggis,” Jurnal Keteknikan Pertanian 5(2), 161-168.
Singh, A. K., and Singh, K. P. (2018). “Optimization of phosphate removal from aqueous solution using activated carbon supported zero-valent iron nanoparticles: Application of RSM approach,” Applied Water Science 8(8), 1-9. DOI: 10.1007/s13201-018-0875-7
Siswanti, Anandito, R. B. K., Nurhartadi, E., and Iskandar, B. D. (2019). “Effect of various heat treatment on physical and chemical characteristics of red rice bran (Oryza nivara L.) rojolele,” IOP Conference Series: Materials Science and Engineering 633(1), 1-6. DOI: 10.1088/1757-899X/633/1/012046
Sohail, M., Rakha, A., Butt, M. S., Jawad, M., and Rashid, S. (2017). “Rice bran nutraceutics: A comprehensive review,” Critical Reviews in Food Science and Nutrition 57(17), 3771-3780. DOI: 10.1080/10408398.2016.1164120
Srisaipet, A., and Nuddagul, M. (2014). “Influence of temperature on gamma-oryzanol stability of edible rice bran oil during heating,” International Journal of Chemical Engineering and Applications 5(4), 303-306. DOI: 10.7763/IJCEA.2014.V5.398
Susanty, and Bachmid, F. (2016). “Perbandingan metode ekstraksi maserasi dan refluks terhadap kadar fenolik dari ekstrak tongkol jagung (Zea mays L.),” Jurnal Konversi, 5(2), 87.
Szymczak, T., Cybulska, J., Podleśny, M., and Frąc, M. (2021). “Various perspectives on microbial lipase production using agri-food waste and renewable products,” Agriculture (Switzerland), 11(6), 1-22. DOI: 10.3390/agriculture11060540
Thanonkaew, A., Wongyai, S., Mcclements, D. J., and Decker, E. A. (2012). “Effect of stabilization of rice bran by domestic heating on mechanical extraction yield, quality, and antioxidant properties of cold-pressed rice bran oil (Oryza saltiva L.),” LWT – Food Science and Technology 48(2), 231-236. DOI: 10.1016/j.lwt.2012.03.018
Van Tang, N. (2017). “Potential, uses and future perspectives of agricultural wastes,” in: Recovering Bioactive Compounds from Agricultural Wastes, pp. 1-32. DOI: 10.1002/9781119168850.ch1
Vera, L., Zan, M. M. De, Cámara, M. S., and Goicoechea, C. (2014). “Experimental design and multiple response optimization. Using the desirability function in analytical methods development,” Talanta 124, 123-138. DOI: 10.1016/j.talanta.2014.01.034
Yilmaz, N., Tuncel, N. B., and Kocabiyik, H. (2013). “Infrared stabilization of rice bran and its effects on γ -oryzanol content, tocopherols and fatty acid composition,” Journal of the Science of Food Agriculture 1-9. DOI: 10.1002/jsfa.6459
Yoon, S. W., Pyo, Y. G., Lee, J., Lee, J. S., Kim, B. H., and Kim, I. H. (2014). “The concentrations of tocols and γ-oryzanol compounds in rice bran oil obtained by fractional extraction with supercritical carbon dioxide,” Journal of Oleo Science 63(1), 47-53. DOI: 10.5650/jos.ess13144
Yu, C., Hu, Q., and Deng, H. W. Z. (2020). “Comparison of 11 rice bran stabilization methods by analyzing lipase activities,” Food Processing and Preservation 00(e14370), 1-14. DOI: 10.1111/jfpp.14370
Zardo, I., and Espíndola, A. De. (2019). “Optimization of ultrasound assisted extraction of phenolic compounds from sunflower seed cake using response surface methodology,” Waste and Biomass Valorization 10(1), 33-44. DOI: 10.1007/s12649-017-0038-3
Article submitted: July 16, 2023; Peer review completed: September 23, 2023; Revised version received and accepted: October 3, 2023; Published: October 22, 2023.
DOI: 10.15376/biores.18.4.8341-8361