
Abstract
Cellulose is a biopolymer that has broad potential applications including in building insulation, and it was studied for its potential as a filler material. A closed-cell polyurethane foam insulation formulation was developed, and cellulose filaments (CFs) were introduced at varying percentages. The viscosity and morphology of the formulations were studied, as were different foam properties, such as water vapor permeability, reaction kinetics, density, porosity, thermal conductivity, and compressive strength foams as a function of cellulose filaments content. A commercial foam was also tested as a reference. The cellulose filaments impacted the formulations’ viscosity, and all the properties of the resulting insulating material. For example, samples containing 5% of cellulose filaments were found to perform differently than samples containing 0%, 1% and 2.5% mainly due to agglomerate formation, which impacted cell size (about 0.1 mm2 at 0%, 1% and 2.5% versus a mean of over 0.4 mm2 at 5%), and differential vapor sorption (with a mass change of 2%wt at 0 parts per hundred of polyol versus 2.5%wt at 5% from 0% to 95% relative humidity). However, the required performances by the standards of polyurethane foam insulation material were always fulfilled regardless of the amount of cellulose filaments present.
Download PDF
Full Article
Investigation of Cellulose Filaments as Filler in Rigid Insulating Polyurethane Foam
Manon Beaufils-Marquet,a,b Pierre Blanchet,a,b,c Atif Hussain,d and Véronic Landry a,b,c,*
Cellulose is a biopolymer that has broad potential applications including in building insulation, and it was studied for its potential as a filler material. A closed-cell polyurethane foam insulation formulation was developed, and cellulose filaments (CFs) were introduced at varying percentages. The viscosity and morphology of the formulations were studied, as were different foam properties, such as water vapor permeability, reaction kinetics, density, porosity, thermal conductivity, and compressive strength foams as a function of cellulose filaments content. A commercial foam was also tested as a reference. The cellulose filaments impacted the formulations’ viscosity, and all the properties of the resulting insulating material. For example, samples containing 5% of cellulose filaments were found to perform differently than samples containing 0%, 1% and 2.5% mainly due to agglomerate formation, which impacted cell size (about 0.1 mm2 at 0%, 1% and 2.5% versus a mean of over 0.4 mm2 at 5%), and differential vapor sorption (with a mass change of 2%wt at 0 parts per hundred of polyol versus 2.5%wt at 5% from 0% to 95% relative humidity). However, the required performances by the standards of polyurethane foam insulation material were always fulfilled regardless of the amount of cellulose filaments present.
DOI: 10.15376/biores.18.3.6086-6117
Keywords: Polyurethane foam; Cellulose filaments; Biocomposites; Mechanical properties; Thermal conductivity
Contact information: a: Department of Wood and Forest Sciences, Faculty of Forestry, Geography and Geomatics, Université Laval, 2405 rue De La Terrasse, Québec City, Quebec G1V 0A6, Canada; b: NSERC Industrial Research Chair on Eco-responsible Wood Construction (CIRCERB), Université Laval, 2425 rue De L’Université, Québec City, Quebec G1V 0A6, Canada; c: NSERC Canlak Industrial Research Chair in Interior Wood-Product Finishes (CRIF), Université Laval, 2425 rue De L’Université, Québec City, Quebec G1V 0A6, Canada; d: Department of Materials Engineering, Faculty of Applied Science, University of British Columbia, Vancouver, British Columbia V6P 1R9, Canada;
* Corresponding author: veronic.landry@sbf.ulaval.ca
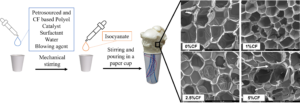
GRAPHICAL ABSTRACT
INTRODUCTION
According to the International Energy Agency (IEA), the building and construction sector accounts for 30% to 40% of the world’s energy consumption (IEA 2020, 2022). As cities continue to grow, there is a need for sustainable construction practices. Most of a building’s energy consumption occurs during its operating phase (IEA 2022). The building envelope, and especially the insulation, is important when it comes to energy efficiency as effective insulation enables users to reduce their reliance on heating, which is often derived from fossil fuels, and increase their daily comfort (Cetiner and Shea 2018).
In addition to the energy consumed during building construction and use, non-renewable fossil resources are required to produce traditional insulation materials. One example of a traditional insulation material is sprayed polyurethane foam, which has several sought-after attributes, including being an effective air and vapor barrier (Al-Homoud 2005; Straube et al. 2009). Wood fiber, mineralized wood fiber, cork and blown cellulose are commonly used biobased insulation materials. They do not compete with polyurethane foam insulation, however, especially since most of them are better acoustic insulators than thermal ones (Schiavoni et al. 2016). The insulation market has seen the emergence of alternative biobased insulation materials, such as hemp, kenaf and flax, but their thermal insulation, vapor barrier and other properties generally do not compete with those of sprayed polyurethane foam insulation or synthetic-based insulation either (Arrigoni and Panesar 2019; Lafond and Blanchet 2020).
Polyurethanes are popular polymers whose market was valued at over USD 45 billion in 2021 and is projected to experience 5% cumulative annual growth rate for 2021 to 2026 (Uram et al. 2021). Their versatility and widespread use make them difficult to replace. However, climate change and the oil crisis have increased the interest in biobased materials (Kuranska et al. 2016). Not only are biobased materials more sustainable, but multiple studies have shown that using them in place of petroleum-based materials significantly reduces environmentally harmful emissions (Gabriel et al. 2018; Arrigoni and Panesar 2019; Maga et al. 2019; Hurmekoski et al. 2023). Nevertheless, it must be ensured that replacing petroleum-based by biobased materials follows green chemistry and engineering principles as much as possible (Anastas and Eghbali 2010). Thus, there is growing interest in biobased materials such as cellulose, which is the most abundant biobased polymer on Earth (Heinze and Liebert 2012). In fact, the forest industry, and especially the four major forest-industry countries, which are the USA, Canada, Sweden, and Finland, are seeking alternatives to compensate for a projected decline in global graphic paper industry revenue of EUR 5.5 billion by 2030. Construction is considered one of the most important new wood-based markets (Hurmekoski et al. 2018, 2023). Cellulose has already been used in the development of several materials due to its functional groups (-OH groups), allowing chemical modification, as well as its mechanical and thermal properties (Klemm 1998).
In order to exploit the full potential of cellulose, it has to be extracted, which can be done in three different ways; it can be extracted from trees, or annual plants mechanically or chemically or generated through bacteria (Heinze and Liebert 2012; Omran et al. 2021). Cellulose can then be supplied in crystalline, fibrillar or bacterial form (Klemm et al. 2011). However, cellulose’s properties vary depending on its size, origin, crystallinity, and extraction process (Jonjaroen et al. 2020; Stanzione et al. 2020; Omran et al. 2021).
Hence, extensive research has been conducted on the utilization of various forms of cellulose, such as cellulose nanocrystals (CNC) (Gangoiti and Peruzzo 2020; Septevani et al. 2017; Uram et al. 2021) and cellulose microcrystals (CMC) (Kuranska et al. 2016), in polyurethane foams. Additionally, the application of cellulose in wood plastic composites (WPC), which involve a lignocellulosic material filler and a thermoplastic polymer, has also been well-documented (Dadras Chomachayi et al. 2022; Zor et al. 2023). Moreover, the use of fillers as nucleating actors in both polyurethane foam insulation and other thermoset materials has been widely studied in the literature. For instance, it has been shown that the use of fillers in polyurethane foam leads to smaller cells, which has a considerable impact on the material’s properties (Zhou et al. 2016a; Panaitescu et al. 2017; Członka et al. 2020; Bradai et al. 2022; Dukarska et al. 2022).
Valorizing pulp and paper-based cellulose should significantly extend the service life of cellulose and therefore reduce the foam’s environmental impact (Hurmekoski et al. 2018). In this article, the standard for rigid spray polyurethane foam was applied, and prepared samples were compared with a commercial reference in parallel (Standards Council of Canada – Conseil canadien des normes 2015b). A statistical study was also conducted on a large number of samples for a more detailed analysis of the results and comparison with the literature (Septevani et al. 2017). Several analyses were performed. The viscosity and morphology of the formulations were studied, as were the following foam properties as a function of cellulose filament (CF) content: water vapor permeability, thermal stability, reaction kinetics, density, porosity, thermal conductivity and compressive strength. The analyses and samples made it possible to thoroughly compare this study’s results with those of many other papers that use cellulose fibers that differ, for example, in their extraction method or fiber size (Marcovich et al. 2006; Silva et al. 2010; Kuranska et al. 2016; Zhou et al. 2016a,b; Jonjaroen et al. 2020; Stanzione et al. 2020; Uram et al. 2021).
This study focuses on cellulose filaments (CFs) that were extracted from northern bleached softwood kraft (NBSK) pulp and paper to investigate the influence this specific type of CF has on foam properties when used as a foam filler and perhaps find an alternative use for it to divert it from becoming a waste product.
EXPERIMENTAL
Materials
The CFs used in this work (Fig. 4) were manufactured by Kruger Biomaterials Inc. (Montréal, Canada). The manufacturing process consisted of peeling filaments of (NBSK) wood pulp longitudinally to preserve their length, reduce their diameter, and ensure they are free of lignin. The process has a yield of almost 100% and does not employ any chemicals or enzymes or require any effluent treatment as a result. The crystalline fraction of CFs is composed of solely cellulose I, which is biodegradable and compostable (Kruger Inc. 2017). The CFs have a bulk density of 633 kg/m3 (moist fluff) and 53 kg/m3 (dry fluff) (Hua et al. 2011). The use of undried CFs was rejected due to the reaction between the moisture content in the CFs and isocyanate, which is a major reagent of the foam. To ensure a controlled reaction for the expected polyurethane foam, the use of dry CFs containing 1%wt of water was preferred.
The diameter of the dried CFs used was determined by scanning electron microscopy (SEM). The SEM method followed is described in the Morphology section. ImageJ software was used to measure CF diameter in 3 different SEM images representing different areas of the CFs. An average of 25 measurements were taken per image (Rueden et al. 2017).
Cellulose crystallinity
To determine CF crystallinity, X-ray diffraction was performed with an EMPYREAN XRD device (Malvern Panalytical, UK). The source used was graphite-monochromatized copper radiation (Kα = 1.5460 Å). Data were collected from 10.0092 to 49.9972 °2θ in 0.0130 °2θ increments. The operation power was 40 mA and 45 kV. To compare the data obtained for the CFs used in this study with the data in the literature, Avicel PH-101 cellulose (CMC) provided by Sigma Aldrich (Darmstadt, Germany) was used as a reference. X-ray diffraction was performed in accordance with two methods. The first one (developed by Segal et al.) corresponds to calculating the crystallinity index from the ratio of the 002 peak height (I002) to the height of the minimum (IAM) between the 002 and the 101 peaks of the cellulose, as described in Eq. 1 (Segal et al. 1959). This method makes it possible to quickly compare cellulose samples, but it should not be used to quantitatively evaluate the amount of crystalline and amorphous material in a cellulose sample (Park et al. 2010).
 (1)
(1)
The second method is the XRD deconvolution method, which makes it possible to distinguish the amorphous and crystalline contributions of the diffraction spectrum by applying a curve fitting process. The crystallinity index can be calculated from the ratio of the area under the curve of all the crystalline peaks to the total area.
Preparation of the Nanocomposite Foams
The products and quantities used in the polyurethane foam formulations as well as the product suppliers are detailed in Table 1. Table 2 provides information on the isocyanate used in the polyurethane foam formulations, and Table 3 summarizes the properties of the polyol reacting in the polyurethane foams.
Table 1. Products Used in the Polyurethane Foam Formulations, and Their Suppliers

a) polycat 204; b) per hundred of polyol
Table 2. Properties of the Isocyanate Used, 4.4′-polymeric-methylene diphenyl diisocyanate (pMDI; Rubinate M)

Table 3. Properties of the Ester Polyol Used, Terol 649

a) Hydroxyl content; b) Weight equivalent
The amount of the different components introduced in the formulations was based on the polyol weight and is expressed in parts per hundred of polyol (php). 90 g reference samples of a polyurethane foam formulation were composed of Terol 649 polyol (39.7 g in 90 g of a CF-free formulation), 1 php of each catalyst, 2 php of each surfactant, and 1 php of water as a blowing agent. Cellulose filament (1, 2.5 and 5 php) and HFO blowing agent (15 php) were added to the reference formulation and mixed in using mechanical stirring (30 s, 2500 rpm) at room temperature. For writing simplification, 1, 2.5 and 5 php of CF are designated as %ages (1%, 2.5%, 5%) throughout the article.
Formulations were stored at 4 °C overnight to stabilize the HFO blowing agent in it as it tends to evaporate. Excess HFO was added to ensure that its concentration remained greater than 10 php. Then, the pMDI was added and mechanically stirred in for about 10 s at 2500 rpm until the cream time (change of visual appearance before expansion) was reached. The foam was then poured into a 32 oz (946 mL) paper cup, and rigid polyurethane foam was obtained within a few seconds. The pMDI index (moles of NCO groups per moles of OH groups) was adjusted to 1.13 for each foam sample. The samples were kept under ambient conditions for 1 week after preparation to allow their structure to stabilize. The preparation protocol is summarized in Fig. 1.

Fig. 1. Summary of the polyurethane foam preparation protocol, and illustration of temperature recording with thermocouples
Characterization
Preparation of the foam samples
Foam samples were prepared in cups instead of being sprayed. The preparation method is known to influence the properties of the material (Hawkins et al. 2005). Sprayed samples should therefore have different properties than those obtained in this project. However, similar trends should be observed with the addition of CF to the foam regardless of the preparation protocol. The following tests were performed on the PU foam samples prepared.
All samples were conditioned at 23 ± 2 °C and 43 ± 3% relative humidity (RH) for 24 h prior to testing. Samples were cut using a bench saw, and all sample sizes were determined using a digital caliper with a precision of ± 0.1 mm.
In order to compare the foams prepared during this project with commercial products and standards, samples from three different panels of the same commercial reference product were also analyzed.
Morphology
The microstructure of the foam samples parallel to the rising direction and the CF morphology were observed by scanning electron microscopy using a FEI Quanta 250 microscope (FEI Company Inc. Thermo-Fisher Scientific, Hillsboro, OR, USA). Samples were coated with a gold–platinum alloy before imaging to increase their electrical conductivity and stabilize them so that they can resist the high vacuum conditions and high energy electron beam. An acceleration voltage of 15 kV was used for all analyses. Cell size was measured using area data obtained with ImageJ software and SEM images captured parallel to the rising direction on a minimum of 15 cells for each CF %age studied.
Viscosity measurement
The viscosity of the formulations was measured at 25 °C using a Brookfield Model DV-II viscometer (Brookfield Engineering Laboratories, Middleboro, MA, USA). Spindles 63 and 64 were used to cover frequencies between 0.5 and 100 rpm and torque values between 10 and 100%. In some cases, it was not possible to cover the entire range of frequency or torque, resulting in missing values.
Due to their size, morphology, and density, CFs may separate from the rest of the formulation over time and flocculate. CFs were therefore mixed in at the last moment to ensure optimal CF dispersion obtain reliable values. To limit viscosity variation caused by blowing agent evaporation, viscosity measurements were performed on formulations without blowing agent.
Vapor sorption
Moisture can lead to the development of mold or mildew and thus considerably affect the service life of materials (Al-Homoud 2005). Since cellulose is a hygroscopic material, the differential vapor sorption (DVS) of the foams was studied. A water vapor sorption analyzer equipped with a microbalance (± 0.1 µg) was used (Surface Measurement Systems, Allentown, PA, USA). Ten-milligram samples of the foams were oven dried for 24 h at 103 °C before analysis. Then, they were placed in a stainless-steel mesh basket suspended from the microbalance inside a separate chamber with controlled temperature and RH. The weight of each sample was recorded continuously as the RH varied.
The initial drying period was followed by 3 h at 0% RH and 25 °C. Each sample was then exposed to a series of 10% RH increments from 0% to 90 and then to 95% and then from 95% to 0% in the spirit of ASTM C1498 (2016). The RH increment was set to go to the next step when the sample weight variation was <0.002 wt% for 5 min or after a maximum stabilization time of 6 h if the mass did not stabilize over a 5-min interval. During the experiment, the balance had enough time to stabilize the sample mass for each RH increment. The experiment lasted 18 ± 2 h on average for each foam sample and 44 ± 20 min on average per stage. It is therefore possible to state that the result of mass change corresponds to the properties of the foam and not to the limit parameters set on the device.
Thermogravimetric analysis
Thermogravimetric analyses (TGAs) were performed on a TGA 851e analyser (Mettler Toledo, Greifense, Switzerland). Experiments were carried out in triplicate under a nitrogen flow (50 mL/min) from 25 to 800 °C at a heating rate of 10°C/min. Characteristic data such as T5%, the temperature corresponding to 5% of degradation, Tmax, the temperatures of the maximum degradation rates and the percentages of residues at 800 °C were determined.
Statistical analysis
Statistical analyses were performed for all properties tested – reaction kinetics, closed cell content, density, conductivity, and mechanical properties in compression (maximum force and Young’s modulus) as a function of CF content – with a minimum of 15 replicates. The statistical analyses were performed using R software (R Foundation for Statistical Computing, Vienna, Austria) with the ggstatsplot package (Indrajeet Patil 2021). The boxplot and statistics information were designed with the ggsignif package (Chen et al. 2017). The normal distribution of the residuals and the homogeneity of the variances were examined prior to analysis to ensure the validity of the analyses. One-way ANOVA was performed to study variance. When significant statistical effects were detected, Tukey comparisons of least-square means were used to identify and define the statistically different groups at an α= 0.05 level of confidence.
Reaction kinetics
As the reaction between polyol and isocyanate is exothermic, temperature was tracked during foam formation in several locations (indicated by red dots in Fig. 1) using four thermocouples connected to a computer. The formulation was in contact with the first thermocouple, located at the bottom of the cup, at the beginning of foam expansion. As the reaction progressed, the foam expanded and reached the other thermocouples. If the foam made contact with only some of the thermocouples, then the values obtained correspond to the average of the temperatures recorded and the ambient temperature, which is not desired. To eliminate ambient temperature from the measurements, only the maximum temperature measured at each time was kept. The temperature was recorded from the moment it exceeded the ambient temperature. The results are summarized in Table 4.
Foam density
Foam density is directly related to foam performance, since it is linked to the proportion of open and closed cells, thermal conductivity and mechanical properties (Leng and Pan 2019). Foam density was obtained from the weight and geometric volume of cubic specimens (having a side length of 25.4 mm) in accordance with ASTM D1622 (2020). The samples that were used to measure closed and open cell content also served to determine foam density.
Closed cell content
The proportion of closed and open cells in foam is directly related to the material’s thermal insulation properties (Szycher 1999). The %age of open cells was measured using a gas pycnometer (UltraPyc 1200e, Quantachrome, Boynton Beach, FL, USA) in the spirit of ASTM D6226 (2021). The volume of the chamber used was 150.3 cm3. As advised by the standard, two foam cubes were put in the chamber for one test, which represents a total volume of 32.8 mm3 foam for each test. The ultrafoam program was selected, and nitrogen was used for measuring. The target pressure was equal to 17.7 psi (3.0 psig) in the chamber. The vadded calibration was performed first in large mode with 1 large sphere and 2 medium one representing a total volume of 70.7 cm3. The volume of the chamber was calibrated in large mode with a single test and a sphere having a volume of 29.0 cm3.
Thermal conductivity
Thermal conductivity is the main property of interest for insulation materials and was measured using two different pieces of equipment for commercial samples:
1) The FOX heat flow meter (HFM; TA Instruments, Wakefield, MA, USA), which makes it possible to measure thermal conductivity in accordance with ASTM C518 (2017) by means of the classical test performed on insulating materials in the literature. The foam samples were cut down to 300 x 300 x 23 mm as required by the standard for testing in the HFM. The temperature of the hot (bottom) and cold (top) plates were kept at 35 °C and 10 °C, respectively, which represents an average temperature of 22.5 °C and corresponds to a temperature difference (ΔT) of 25 °C between the two plates. The HFM device was used on a total of 16 samples from three different commercial panels.
2) A small-scale custom-made device designed in accordance with ASTM E1225 (2020) that can measure thermal conductivity using smaller samples than are needed for the HFM and was also used to measure the thermal conductivity of the experimental foams. The device is described in Fig. 2. Specimens were cut down to 50 × 50 × 12.25 mm with the thickness running parallel to the foam rising direction. The thickness was measured using a digital caliper before the thermal conductivity was tested. Each sample was placed between two thin aluminum sheets and two plates with controlled temperatures of 35.5 °C (bottom plate) and 10.5 °C (top plate) for an average temperature of 23 °C and ΔT of 25 °C between the two plates. A weight was placed on top of the system to ensure good contact between the components of the measuring device and the sample. Water-cooled Pelletier plates (Model K20, Haake, Vreden, Germany) kept the temperatures constant, while the equilibrium heat flux was measured using a PHFS-01 heat flux sensor (Flux Teq LLC, Blacksburg, VA USA). The k values reported were calculated via Fourier’s law as follows:
 (2)
(2)
The thermal conductivity of the commercial foam was calculated as the average k value of 12 samples (four from each of the three panels tested). That of the experimental foams was determined by analyzing 4 samples per foam batch and 17 batches for each %age of CF content considered.
The conductivity of the commercial spray polyurethane foam boards was measured with both devices to permit comparison with the results for the experimental foam performed on device 1) with the standard that use device 2).

Fig. 2. Scheme of the custom-made thermal conductivity analyzer
A correction factor is proposed to convert the thermal conductivity and thickness values obtained using the custom-made device to values that are comparable to those obtained using the FOX HFM. It is based on the ratio between the thermal conductivity values obtained for the commercial foam using the two devices. However, it is important to note that this factor must be adjusted for the thickness of the sample, as thermal conductivity performance is dependent on sample thickness.
Mechanical properties
The compressive properties of the foams were measured using a QTest/5 Elite Controller (MTS, Eden Prairie, MN, USA) universal testing machine having a 5 kN load cell and a constant load rate of 2.5 mm/min. The specimens were cut into 50.8 × 50.8 × 25.4 mm pieces with the thickness running parallel to the foam rising direction. All the tests were performed in the spirit of ASTM D1621 (2016). However, the standard’s recommended thickness of 50 ± 3 mm was not used to allow for a larger number of pieces per foam specimen (Standards Council of Canada – Conseil canadien des normes 2015b). The compressive properties were measured parallel to the rising direction of the foam as specified in the test method. The maximum force was defined by the testing machine.
Young’s modulus was determined by subjecting the curve obtained from the testing machine to data processing. The ggpmisc R package was used to plot the slope on the compression test’s stress-strain curve, which made it possible to verify data processing (Aphalo 2022).
RESULTS AND DISCUSSION
CF Properties
CF crystallinity
Cellulose’s cell size, origin, extraction process, and crystallinity lead to variations in its performance (Jonjaroen et al. 2020; Stanzione et al. 2020). It is therefore important to know the crystallinity of the samples. Two different interpretations of the XRD curve of the CFs used and Avicel-PH-101 cellulose (CMC) were considered to have a precise idea of the crystallinity of the two types of cellulose. The two interpretations, which are summarized in Fig. 3, are: 1) the values obtained using Segal and colleagues’ method, and 2) XRD deconvolution.
Avicel-PH-101 cellulose’s crystallinity has been studied several times in the literature, summarized in Fig. 3 (Park et al. 2010; De Figueiredo and Ferreira 2014; Ju et al. 2015).
Although Segal and colleagues’ method provides uncertain results and consequently cannot be used to quantitatively evaluate the amount of crystalline and amorphous material in a cellulose sample, its results are suitable for rapidly comparing cellulose samples (Park et al. 2010). Results obtained using Segal and colleagues’ method show that the CFs have a slightly lower crystallinity (85.2%) than Avicel-PH-101 cellulose (86.5%). The method based on XRD deconvolution resulted in significantly lower crystallinity values (45.1% for Avicel cellulose and 41.1% for the CFs). These results make it possible to conclude that the CFs used are less crystalline than Avicel cellulose. However, due to the wide range of crystallinity values presented in the literature for Avicel-PH-101 cellulose and the significant difference in the values obtained using Segal and coworkers’ method and the deconvolution technique, it is impossible to arrive at a single crystallinity index for the cellulose Avicel-PH-101 with this study and the literature (Park et al. 2010; De Figueiredo and Ferreira 2014; Ju et al. 2015).

Fig. 3. XRD results of crystallinity index for Cellulose Filaments versus Avicel-PH-101 cellulose in comparison with the literature
CF morphology
Studying the morphology of the CFs used is essential to understand the mechanisms and changes that the CFs introduce in the formulation and in the foam in general. Images of the morphology of a CF sample are presented in Fig. 4. An average filament diameter of 8 ± 7 μm was determined from SEM images and ImageJ using dried CFs with 1 wt% water content. A difference in CF diameter size was observed between the measurements performed by the CF manufacturer and those taken during this study (300 nm and 8 ± 7 μm, respectively) (Kruger Inc. 2017). This variation could be attributable to the use of CFs with different moisture content in each case: 30% water content in the industrial case, versus 1% moisture in this study. In fact, cellulose fibers have less surface area when wood pulp fibers are dry than when they are moist (Fernandes Diniz et al. 2004). The loss of swelling during drying is accompanied by cellulose microfibril aggregation, which leads to a larger apparent microscopic diameter with high variability (Salmén and Stevanic 2018).
 (a) (a) |
 (b) (b) |
Fig. 4. Morphology of a dried CF sample (1%wt water) (a) at a macroscopic scale, and (b) by scanning electron microscope (x400)
Nanocomposite Foam Preparation and Morphology
CF dispersion in polyol resin and foam
Figures 5 and 6 present CF dispersion in the formulations on a macroscopic scale and in the foam on a microscopic scale, respectively. In Fig. 5, aggregates can be observed in the 5% CF formulation but not in the other formulations with lower %ages of CFs. It is a known fact that cellulose tends to aggregate when subject to van der Waals forces and repulsive electrostatic double-layer interactions between like-charged surfaces (flocculation) (Karppinen et al. 2012; Li et al. 2021).
The images in Fig. 6 illustrate CF integrated in the foam matrix. Filaments were well integrated in the foam at 1% and 2.5% CF, as shown in images 2), 3a) and 3b) of Fig. 6. On the other hand, at 5% CF (images 4a) and 4b) of Fig. 6), CF aggregates are visible at both the macroscopic and microscopic scale. Cellulose’s impact on the structure of foam has been previously studied by Kuranska et al. (2016) and Mort et al. (2021). The change of structure can probably be explained by the high number of OH groups interacting or the length of the fibers, with long fibers leading to interlacing when mixing the formulation (Kuranska et al. 2016; Mort et al. 2021). The size of the cells is studied in the next section.

Fig. 5. Macroscopic observation of CF dispersion in different formulations

Fig. 6. SEM images of 1) 0% CF foam (x200), 2) 1% CF foam (x200), 3a) 2.5% CF foam (x800), 3b) 2.5% CF foam (x200), 4a) 5% CF foam (x100), and 4b) 5% CF foam (x200)
Cell size was studied by measuring the area of the cells observed in the foam sections under the SEM. Cell size was evaluated as a function of the %age of CF in the foam, measuring the cell area parameter in Fig. 6 images 1), 3b) and 4b) using the ImageJ software (Rueden et al. 2017). The results are presented in Fig. 7 and show the cell size was smaller at 1% and 2.5% CF than at 0% CF. Similar results were reported by Uram et al. (2021) with microcellulose and by Kuranska et al. (2016). Fillers are commonly used as nucleating agents in foam and reduce the average cell size in PU foam. Septevani et al. (2018) suggested that the reaction between the isocyanate and the nanofiller enhances nanofiller dispersion, which improves the nucleation process and leads to a finer cell structure.
In this study, an increase in cell size and a wide range of cell sizes were observed at 5% CF. This can be explained by the formation of CF agglomerates, as illustrated in Fig. 6 for 5% CF, which leads to discontinuities in the foam structure.

Fig. 7. Foam cell size as a function of CF content
Viscosity measurements
Figure 8 presents the impact CFs have on the viscosity of formulations as a function of spindle frequency. Spindle 63 made it possible to measure the formulations with 0, 1 and 2.5% CF, while spindle 64 was used to measure the formulations with 1, 2.5 and 5% CF.

Fig. 8. Viscosity as a function of spindle frequency and CF content
Formulations containing CFs exhibit rheofluidifying behavior. In fact, the viscosity is high at low shear values, and agitation makes the CFs orient themselves in the mixture, which leads to a decrease in viscosity. This is common with cellulose and in crystalline liquids (Iotti et al. 2011; Karppinen et al. 2012; Mitiakoudis and Gandini 1991). Only frequencies up to 5 rpm can be used to compare the formulations with different CF concentrations due to missing values. It can be concluded from the results for spindle 64 that viscosity increased with increasing quantity of CF in the formulation at a given frequency: the 2.5% CF formulation was 2 to 3 times more viscous than the 1% CF formulation from 0.5 to 5 rpm, while the 5% CF formulation was 12 times more viscous than the 1% CF formulation at 0.5 rpm, 7.5 times more viscous at 1 rpm, and about 5 times more viscous than 1% CF from 2 to 5 rpm. A shift was observed in the results for spindle 63 (versus those for spindle 64), but the trend was similar. Therefore, the presence of CFs influences the behavior of the formulation, particularly when it is at rest. Although the effect was reduced by increasing the agitation frequency, it remained present.
Vapor Sorption Analysis
Moisture negatively impacts the thermal insulating properties of materials. Thus, low moisture retention and low weight gain is desirable (Yousefi 2019). Differential vapor sorption testing was used to investigate the CF-containing foams’ ability to absorb moisture as a function of RH over time. Figure 9 presents the vapor sorption isotherms and illustrates the foams’ weight gain at various RH levels.
It was expected that the CF-containing foams would exhibit significant weight gains during sorption and losses during desorption, as cellulose fibrils are known to be hygroscopic due to hydrogen bonding between the hydroxyl groups in the cell walls and water molecules (Guo et al. 2017). However, this was not the case. The weight gain and standard deviation data indicate the maximum weight gain was 2.6% with 5% CF, which is much lower than the 20% mass change that is reported for cellulose alone in the literature (Guo et al. 2017). However, the morphology of the foam (discussed earlier) shows that most of the CFs were enclosed in the foam matrix, so they were not directly exposed to the humid environment. This can also explain the small difference in weight gain between the 1% CF and 2.5% CF formulations. However, this assumption does not apply to the samples with 5% CF, in which CF aggregates were formed. Some of the OH functions were consequently less well integrated in the polyurethane matrix and more exposed to water vapor. This partly explains the higher weight gain observed in the formulation with 5% CF content. The CFs used in this study were dry, however, and thus undergoing hornification (Klemm 1998). Hornification results in a significant and irreversible reduction in pore volume. It causes the OH functions of the cellulose to interact with each other, which reduces both the specific surface area and the number of OH functions that are available to interact with water vapor molecules. Therefore, drying the CFs was expected to have an impact on the weight gain observed in this study and probably resulted in a small change in mass.

Fig. 9. Weight variation as a function of CF content and water vapor pressure
On the other hand, the relationship between cellulose crystallinity and water vapor properties is well established (Mihranyan et al. 2004; Sheokand et al. 2014). Cellulose has been found to sorb more moisture in its amorphous phase than in its crystalline phase due to the availability of more OH functions. According to the XRD analysis, the CFs used in this study were less crystalline than the Avicel cellulose. Therefore, the small weight gains observed in this study are also promising for more crystalline celluloses, which would probably lead to even smaller weight gains.
However, it was not possible to determine whether the small weight gains observed in this study were a result of the successful integration of the CFs into the matrix or the dryness of the CFs. Both parameters have the potential to play a role and have a positive and predominant impact. This would be in contradiction with the literature, which points to the amorphous or crystalline morphology as having a dominant effect on water retention (Mihranyan et al. 2004; Xie et al. 2011; Guo et al. 2017).
No comparable results were found in the literature, as the standard in accordance with ASTM E96 focuses not on moisture performance, such as DVS analysis, but rather measuring permeance properties (Mukhopadhyaya et al. 2014; ASTM E96 2016). Since cellulose is hygroscopic and can increase a material’s moisture absorption capacity, the choice was made to focus on this parameter rather than measuring water vapor permeance in accordance with ASTM E96. Furthermore, few studies have investigated cellulose’s effect on the water vapor permeance of polyurethane foams. Khazabi and Sain (2015) focused on this and reported water vapor permeance decreased noticeably when cellulose was added to the polyurethane foam formulation (Khazabi and Sain 2015). They attributed this to cellulose’s hygroscopicity, which results in it absorbing some of the water vapor and slowing down the vapor’s passage. In addition, cellulose acts as a nucleating agent, which reduces cell size and thus hinders the passage of water vapor through the insulating foam (Khazabi and Sain 2015).
Moderate hygroscopicity was observed in this study. In addition, Fig. 7 illustrates that the foams with 1% and 2.5% CF content had smaller sized cells than the foam with 0% CF content, and similar results are reported in the literature (Septevani et al. 2018; Uram et al. 2021). For the foam with 5% CF content, on the other hand, an increase in cell size and a wide range of cell sizes were observed, which can be explained by the formation of CF agglomerates that lead to discontinuities in the foam structure. Consequently, relating this study’s results with those of Khazabi et al. (2015) makes it possible to hypothesize that water vapor permeance would be improved in the formulations with 1% and 2.5% CF content, since a decrease in cell size was observed for the samples. Conversely, lower water vapor resistance was observed in the 5% CF formulation.
Thermogravimetric Analysis
CF and polyurethane foam thermal stability was studied by thermogravimetric analysis in an inert atmosphere. The mass loss curves, and their derivatives are illustrated in Fig. 10. Table 4 presents a summary of the temperature at which 5% of the sample mass is lost (T5%), as well as the temperatures corresponding to the maximum degradation rates and the %ages of residues at 800 °C.
The first peak observed in the mass loss derivative (T1MAX in Table 4) corresponds to the loss of water. The thermal decomposition of CF took place in a single step, occurring within the temperature range of 230 to 395 °C, with the maximum rate of mass loss observed at 358 °C. This step accounted for approximately 83% of the total mass loss during the decomposition process. The analysis revealed that the polyurethane foam underwent a four-stage decomposition process, with overlapping steps occurring between 200 and 645 °C, regardless of the CF content. The overall mass loss during the four-stage decomposition process was approximately 70% for samples with 0% CF, 5% CF, and 5% CF, while it was 68% for samples with 1% CF.
The first step of degradation is related to the breakage in urethane bonds, while next decomposition steps are associated with the ester polyol group (Kumar and Siddaramaiah 2007). It was observed that the thermal pyrolysis of unstable arrangements allowed the formation of a stable char above 645 °C. The amount of residue can be attributed to the NCO/OH>1.13 ratio. In fact, an excess of isocyanate leads to greater thermal stability as observed by Reinerte et al. (2019).
Therefore, in view of the TGA results, the incorporation of cellulose does not appear to have had any impact on the thermal stability of polyurethane foam at the proportions introduced in the material. However, it is worth noting that cellulose contains hydroxyl (OH) groups, which facilitate chemical modifications such as phosphorylation. These modifications could have the potential to significantly impact the thermal stability of both cellulose and the polyurethane foam material as a whole (Ghanadpour et al. 2015).

Fig. 10. Thermogravimetric analysis performed under nitrogen and their derivatives for CF and polyurethane foam with various CF contents
Table 4. Results of Thermogravimetric Analysis

Statistical Analysis
Table 4 summarizes the results of the variance analysis (ANOVA) performed to assess reaction kinetics, foam density, closed cell content, thermal conductivity, and mechanical properties. The ANOVA results are used in the next section to support the analysis of foam parameters. It should be noted that only the maximum force was not significant (Pr (> F) > α=0.05).
Table 5. ANOVA Test Results Indicating the Effect CF Concentration Has on Reaction Kinetics, Foam Density, Closed Cell Content, Thermal Conductivity, and Mechanical Properties (maximum force and Young’s modulus)

** Significant at 99 percent probability level; * Significant at 95 percent probability level
Reaction kinetics
Foam formation is an essential stage, since it impacts the resulting foam properties (Kuranska et al. 2016). The foaming process was studied by monitoring temperature, and the temperature results are summarized in Table 4. While all the curves follow the same pattern, the maximum temperature varies by CF concentration.

Fig. 11. Foam temperature as a function of time
The temperature values at 80 s, where the temperatures plateaued, were studied. The ANOVA results are summarized in Table 4. Figure 12 illustrates the temperatures recorded at 80 s as a function of CF content. The ANOVA study revealed a significant statistical difference in the maximum temperatures observed (Table 4– Reaction kinetics). More specifically, the maximum temperature recorded for foams containing 5% CF content was statistically different from that of the other formulations (with 0%, 1% and 2.5% CF content), as shown in Fig. 12. Additionally, the formulations with 1% and 2.5% CF content were very different from one another (Fig. 12), with the samples with 1% CF content having a higher mean temperature than those with 2.5% CF content. However, no significant statistical difference was found between the formulations with 0% and 1% CF content or those with 0% and 2.5% CF content.

Fig. 12. Statistical analysis of the temperature at 80 seconds of foaming as a function of CF content
The stars above the bars represent statistical differences from Tukey comparison tests (*: α = 0.05, **: α = 0.01).
The reaction between polyol and isocyanate is exothermic (Szycher 1999). The higher temperature of the foam with 1% CF content could suggest a higher degree of cross-linking. Other studies have reported cross-linking increases with the addition of 1 to 3% microcellulose to polyurethane foams (Septevani et al. 2018; Uram et al. 2021). Kuranska et al. (2016) observed a change in temperature with the addition of CMC measured using a FOAMAT device. They report temperature increased from 0 to 3% CMC due to an increase in reactivity and then decreased at 9% CMC, which can be explained as a decrease in reactivity after 3%CMC with 6% and 9% CMC (Kuranska et al. 2016).
Cellulose contains alcohol (-OH) functions that are available to react with isocyanate (NCO) to form urethane (RO-(CO)-NHR’) (Klemm 1998). It is important to note that in this study, more isocyanate functions were introduced than alcohol functions (NCO/OH=1.13). It is observed that the average maximum temperature increased between 0% and 1% CF content and then decreased after 1% CF, which suggests that there was excess isocyanate above 1% CF (NCO/OH>1). Then, in the formulation with 5% CF content, adding CFs alongside the OH functions that are available to react with isocyanate could disrupt the equilibrium of the original alcohol-to-isocyanate proportion in the formulation and lead to excess alcohol functions compared to isocyanate (NCO/OH<1). The excess would remain unreacted with the isocyanate. As a result, the average reaction density would decrease along with temperature. This may explain the significant difference observed between the 1% and 2.5% CF formulations, but the reactivity did not decrease enough to be statistically significantly different than the 0% CF formulation. Then, a statistically significant difference was observed between the 5% CF formulation and the other formulations (with 0%, 1% and 2.5% CF content). In this study, a large distribution of temperatures was also observed for the 5% CF formulation. This can be attributed to the presence of agglomerated CFs, which behave differently than the well-dispersed CFs that are in the other formulations. Moreover, it can be assumed that the change in viscosity brought about by the addition of CF also influences the reactivity of the mixture as has previously been demonstrated in the literature (Raimbault et al. 2021).
Table 4 summarizes and Fig. 13 illustrates the ANOVA results for foam density as a function of CF content. Regardless of the concentration of CF in the formulation, all foams exceeded the standard minimum required density of 28 kg/m3 (Standards Council of Canada – Conseil canadien des normes 2015a). The density of the commercial foam panels was also measured and was found to be between 35 ± 2 and 37 ±2 kg/m3. The foams with 0%, 1% and 2.5% CF content had similar density values as the commercial samples.
The ANOVA p-value indicates that there was a significant statistical difference between formulations (Table 4). More specifically, the foam containing 5% CF content was statistically different from the other formulations, while the foams with 0%, 1% and 2.5% CF content were not significantly different from each other (Fig. 13).
Some studies have demonstrated that density increases with the introduction of cellulose (Kuranska et al. 2016; Septevani et al. 2018; Uram et al. 2021), which suggests that the density of the CF content itself tends to increase the density of the foam. It should also be mentioned that polyurethane foam’s low density compared to the density of other insulating materials can be attributed to the blowing agents present in the foam. If the increase in density were due solely to the CF content, then the increase should have been gradual with the addition of CF; however, that was not the case in this study. The addition of CF appears to have increased the variability of the results, as is illustrated by the quartiles in the box plots for 1%, 2.5%, and 5% CF content in Fig. 13. In addition, it is very likely that aggregates in the 5% CF formulation led to more blowing agent escaping, which resulted in increased density.

Fig. 13. Foam density as a function of CF content

Fig. 14. Proportion of closed cells as a function of CF content
Closed cell content
Figure 14 presents the proportion of closed cells in the foams produced as a function of CF content. Per the ANOVA results summarized in Table 4, statistical differences were observed between formulations. There was much dispersity in the proportion of closed cells in the samples with 5% CF content, including one instance of the closed cell content being below the standard (89%). According to the statistical analysis, the foams with 2.5% CF content were statistically different from those with 5% CF content and those with 1% CF content. However, there were no statistical differences between the other formulations, as shown in Fig. 14. All samples except one (at 89% closed cells at 5%CF in Fig. 14) met the standard for minimum required closed cell content of 90%. Apart from affecting proportion dispersity, CF content did not seem to have a notable positive or negative effect on the proportion of open or closed cells in the foam. This seems to be in line with the literature, which does not agree on a clear trend. In fact, Leng and Pan (2019) and Kuranska et al. (2016) observed an increase in closed cell content with up to 30% cellulose nanofibrils and 3 to 9 wt% CMC, respectively, while Septevani et al. (2018) and Uram et al. (2021) observed similar cell sizes and proportions of closed cells with 0.4% cellulose nanocrystals and 1 to 3% microcellulose, respectively.
Thermal conductivity
The results of the ANOVA of thermal conductivity performed with the custom-made device are summarized in Table 4 and illustrated in Fig. 15 in boxplots as a function of CF content. Significant differences were observed between all the formulations (Table 4), except for those with 0% and 1% CF content (Fig. 15). Also, thermal conductivity increased gradually with the %age of CF introduced in the foam (Fig. 15). In the literature, on the other hand, Septevani et al. (2017) observed a significant reduction in thermal conductivity with the addition of 4% CNC (Septevani et al. 2017), and Uram et al. (2021) reported similar thermal conductivity values without cellulose and with 1 to 3% microcellulose content. The values measured for the formulations produced in this study remained below the values determined for the commercial foam panels sampled (Fig. 15). The significant increase in thermal conductivity observed between the 0% and 5% CF formulations could be explained by the presence of CF aggregates affecting the foam morphology. However, this alone cannot fully account for the increase in conductivity, since the 1% and 2.5% CF formulations also have higher thermal conductivity values than the 0% CF formulation even though no aggregates were observed in these foams (Fig. 6). A material’s moisture content also affects its thermal conductivity, as water is more thermally conductive than blowing agent (Kalamees et al. 2020). Despite the DVS measurements (vapor sorption analysis section) reporting low weight gains, since no other parameters have been identified as potential contributors of thermal conductivity performances, it can be assumed that the moisture content in the CFs had a non-negligible impact on thermal conductivity.
A total of 12 samples of the commercial foam panels (four from each of three panels) were tested to determine the commercial product’s thermal conductivity.
The average thermal conductivity of the panel samples measured using the FOX HFM was k = 0.025 ± 0.002 W/m/K at an average thickness of 23.5 ± 0.2 mm and an average temperature of 22.5 °C. This thermal conductivity value is consistent with the value reported for HFO polyurethane foam in a previous study (Berardi and Madzarevic 2020).

Fig. 15. Thermal conductivity as a function of CF content
The average thermal conductivity of the panel samples measured using the custom-made device was k = 0.038 ± 0.002 W/m/K at an average thickness of 12.6 ± 0.4 mm and an average temperature of 23 °C (Fig. 15).
However, the thermal conductivity of polyurethane foam is known to decrease in the months following application until it stabilizes after five years (Standards Council of Canada – Conseil canadien des normes 2015a). It is therefore conventional to measure the thermal conductivity of a batch of foam in its 5th year to determine how much thermal resistance it lost during the first five years (Standards Council of Canada – Conseil canadien des normes 2015a). The commercial foam panels were measured four months after application, while the laboratory foams were measured one week after foaming. The average value determined for the commercial foam product can therefore be used as a guideline that should not be exceeded but not as an absolute value. In this study, it is used primarily to transpose results from one measuring device to the other.
The thermal conductivity factor was calculated by determining the ratio between the commercial foam’s thermal conductivity average values obtained using the two devices, and is 0.65 (FOX HFM/Custom-made device). Similarly, the thickness factor was calculated by determining the ratio between the commercial foam’s thickness values obtained using the two devices, and was about 1.87. These values must be carefully considered, however, since the laboratory foam samples’ thermal conductivity values are subject to change during the first five years of use (Kalamees et al. 2020). The average thermal conductivity and average thickness values obtained using the custom-made device and the transposition of values to the second (FOX HFM) device for the laboratory foam formulations are given in Table 6.
Table 6. Adjustment of Thermal Conductivity Measurements for Comparison between Devices (the custom-made device vs. Fox HFM)

* Values are transposed and assumed for the 0%, 1%, 2.5% and 5% CF formulations, and effective for the commercial foam.
The values determined for the laboratory foam formulations containing CFs remain in the order of magnitude of the thermal conductivity values presented in the literature (Schiavoni et al. 2016); however, they are likely to change with aging (Standards Council of Canada – Conseil canadien des normes 2015a).
Mechanical properties
Young’s modulus is depicted as a function of CF content in Fig. 16. Based on the ANOVA results summarized in Table 4, it can be concluded that a significant statistical difference did exist between the formulations. Only the formulations with 1% and 5% CF content were statistically indistinguishable from each other in terms of performance. The formulations can therefore be split into three groups: the 0% CF formulation, which had a low Young’s modulus value; the 1% and 5% CF formulations, which had an intermediate Young’s modulus value; and the 2.5% CF formulation, which had the highest Young’s modulus value (Fig. 16). Young’s modulus increased with the CF content in the foam and peaks between 2.5% and 5% CF content. Beyond this maximum point, it decreased, which may be attributable to the presence of aggregates in the foam (Fig. 6). Although few studies refer to Young’s modulus, Kuranska et al. (2016) found that adding 0 to 9% microcellulose to foam increased its Young’s modulus value, meaning its rigidity increased. Their study reported Young’s modulus values between 4 and 6.5 MPa. Septevani et al. (2018) measured the impact of crystalline cellulose at concentrations between 0.2 and 0.8% on Young’s modulus and reported Young’s modulus values between 4.3 and 6.4 MPa. In this study, an increase in rigidity was observed between 7 and 10 MPa (Fig. 6), which can be attributed to the presence of CF in the material.
Some studies report a general decrease in the mechanical strength of polyurethane as the NCO/OH ratio decreases (Gogoi et al. 2014; Hussain et al. 2019). In fact, since the quantity of NCO was not adjusted to the quantity of OH added through the CFs, the addition of cellulose reduced the NCO/OH ratio and consequently impacted mechanical performance. This could explain the reduction in Young’s modulus and compressive strength values observed in this study at 5% CF content.
Figure 17 illustrates the maximum force supported by the foams at their elastic limit. Since the ANOVA p-value was larger than 0.05, these results are not considered statistically significantly different (Table 4). Compressive strength was also measured by Kuranska et al. (2016). In their study, compressive force increased slightly with Young’s modulus and with the amount of CMC introduced into the material, and peaked between 150 and 200 kPa, which is consistent with the findings of Septevani et al. (2017). Uram et al. (2021) measured compressive strength parallel to the foam rising direction and found it to be between 200 and 250 kPa with 0%, 1% and 3% microcellulose added. These values are lower than those obtained in this study, i.e., 200 and 325 kPa (Fig. 17) (Uram et al. 2021).
The lack of statistical differences in this study makes it impossible to arrive at a conclusion regarding the effect CF concentration has on foam. The orientation of the CFs and the direction in which tests were performed, i.e., perpendicular or parallel to the foam rising direction, may also affect the foams’ mechanical performance (Septevani et al. 2017).

Fig. 16. Young’s modulus as a function of CF content

Fig. 17. Maximum force supported at yield strength as a function of CF content
CONCLUSIONS
Climate change is driving research looking into sustainable processes in many areas, including the construction industry. This study aimed to investigate the potential of cellulose filaments (CFs) as a biobased filler in rigid polyurethane insulation foam to enhance its properties.
- Adding CFs impacted the foam properties (open and closed cell content, cell size, compressive strength, and thermal conductivity).
- Statistical analyses were consistent with the lack of consensus in the literature as to the effect CF concentration on closed cell content.
- The statistical analysis clearly demonstrated that incorporating CFs increased the foams’ thermal conductivity, which is not desired for an insulating material.
- Considering the mechanical performance values obtained for compressive strength, CFs increased the rigidity of polyurethane foam.
- Cellulose filaments were observed to have a moderate impact on the water vapor sorption of polyurethane foam.
- Hornification appeared to play a significant role in the resulting foam properties. It increased flocculation in the foam formation stage and facilitated the formation of aggregates, especially at higher CF content, which is not desired.
- Samples containing high CF content (5% CF) demonstrated variability in their properties and behaved significantly differently than samples containing lower CF content (≤2.5% CF).
- Without chemical modification of CF, this study demonstrated that the proportion of CF that can be introduced as a filler is limited.
- Further analysis is necessary to ensure that the incorporation of CF into foam on an industrial scale aligns with the established standard.
ACKNOWLEDGMENTS
The authors are grateful to the Natural Sciences and Engineering Research Council of Canada (NSERC) for its financial support through its IRC and CRD grant programs (IRCPJ 461745-18 and RDCPJ 524504-18) as well as the industrial partners of the NSERC Industrial Research Chair on Eco-responsible Wood Construction (CIRCERB).
The authors would also like to acknowledge collaborators who provided technical support: Yves Bédard, Daniel Bourgault, Luc Germain and Jean Ouellet from the Renewable Materials Research Center (CRMR – Université Laval); Professor Denis Rodrigue from the Center for Research on Advanced Materials (CERMA – Université Laval) for access to the gas pycnometer and the thermal conductivity measuring devices; Suzie Côté from CERMA for SEM imaging; and Thierry Marris from Université de Montréal for XRD analysis.
Conflicts of Interest
The authors declare that there is no conflict of interest. The funders had no role in the design of the study; the collection, analysis or interpretation of data; the writing of the manuscript; or the decision to publish the results.
Authors’ Contributions
MBM carried out the experimental part of this work and wrote the manuscript. AH supported the writing of the manuscript. PB supported the writing of the manuscript, supervised the project and provided additional funding for the project. VL supported the writing of the manuscript and supervised the project.
REFERENCES CITED
Al-Homoud, D. M. S. (2005). “Performance characteristics and practical applications of common building thermal insulation materials,” Building and Environment 40(3), 353-366. DOI: 10.1016/j.buildenv.2004.05.013
Anastas, P., and Eghbali, N. (2010). “Green chemistry: Principles and practice,” Chemical Society Reviews 39(1), 301-312. DOI: 10.1039/B918763B
Aphalo, P. J. (2022). “ggpmisc R package: Miscellaneous Extensions to ‘ggplot2.’”
Arrigoni, A., and Panesar, D. K. (2019). “Opportunities for reducing greenhouse gas emissions of insulation materials in Canada after cannabis legalization,” Academic Journal of Civil Engineering 37(2), 608-613. DOI: 10.26168/icbbm2019.88
ASTM C518. (2017). Standard Test Method for Steady-State Thermal Transmission Properties by Means of the Heat Flow Meter Apparatus.
ASTM D1621. (2016). Test Method for Compressive Properties of Rigid Cellular Plastics. ASTM International.
ASTM D6226. (2021). Test Method for Open Cell Content of Rigid Cellular Plastics. ASTM International.
ASTM E96. (2016). Test Methods for Water Vapor Transmission of Materials. ASTM International.
ASTM E1225. (2020). Test Method for Thermal Conductivity of Solids Using the Guarded-Comparative-Longitudinal Heat Flow Technique. ASTM International.
Berardi, U., and Madzarevic, J. (2020). “Microstructural analysis and blowing agent concentration in aged polyurethane and polyisocyanurate foams,” Applied Thermal Engineering 164, article 114440. DOI: 10.1016/j.applthermaleng.2019.114440
Bradai, H., Koubaa, A., Bouafif, H., Langlois, A., and Samet, B. (2022). “Synthesis and characterization of wood rigid polyurethane composites,” Materials 15(12), article 4316. DOI: 10.3390/ma15124316
Cetiner, I., and Shea, A. D. (2018). “Wood waste as an alternative thermal insulation for buildings,” Energy and Buildings 168, 374-384. DOI: 10.1016/j.enbuild.2018.03.019.
Chen, S.-Y., Feng, Z., and Yi, X. (2017). “A general introduction to adjustment for multiple comparisons,” J. Thorac. Dis. 9(6), 1725-1729. DOI: 10.21037/jtd.2017.05.34
Członka, S., Strąkowska, A., Kairytė, A., and Kremensas, A. (2020). “Nutmeg filler as a natural compound for the production of polyurethane composite foams with antibacterial and anti-aging properties,” Polymer Testing 86, article 106479. DOI: 10.1016/j.polymertesting.2020.106479
Dadras Chomachayi, M., Blanchet, P., and Hussain, A. (2022). “Development of bio-based membranes for building envelope applications from poly(lactic acid) and cellulose microfibers,” BioResources 17(4), 5707-5727. DOI: 10.15376/biores.17.4.5707-5727
De Figueiredo, L. P., and Ferreira, F. F. (2014). “The Rietveld method as a tool to quantify the amorphous amount of microcrystalline cellulose,” Journal of Pharmaceutical Sciences 103(5), 1394-1399. DOI: 10.1002/jps.23909
Dukarska, D., Walkiewicz, J., Derkowski, A., and Mirski, R. (2022). “Properties of rigid polyurethane foam filled with sawdust from primary wood processing,” Materials 15 (15), article 5361. DOI: 10.3390/ma15155361
Fernandes Diniz, J. M. B., Gil, M. H., and Castro, J. A. A. M. (2004). “Hornification – Its origin and interpretation in wood pulps,” Wood Science and Technology 37(6), 489-494. DOI: 10.1007/s00226-003-0216-2
Gabriel, C.-A., Bortsie-Aryee, N. A., Apparicio-Farrell, N., and Farrell, E. (2018). “How supply chain choices affect the life cycle impacts of medical products,” Journal of Cleaner Production 182, 1095-1106. DOI: 10.1016/j.jclepro.2018.02.107
Gangoiti, M. V., and Peruzzo, P. J. (2020). “Cellulose nanocrystal reinforced acylglycerol-based polyurethane foams,” Express Polymer Letters 14(7), 638-650. DOI: 10.3144/expresspolymlett.2020.52
Ghanadpour, M., Carosio, F., Larsson, P. T., and Wågberg, L. (2015). “Phosphorylated cellulose nanofibrils: A renewable nanomaterial for the preparation of intrinsically flame-retardant materials,” Biomacromolecules 16(10), 3399–3410. DOI: 10.1021/acs.biomac.5b01117
Gogoi, R., Alam, M., and Khandal, R. (2014). “Effect of increasing NCO/OH molar ratio on the physicomechanical and thermal properties of isocyanate terminated polyurethane prepolymer,” International Journal of Basic and Applied Sciences 3(2), 118-123. DOI: 10.14419/ijbas.v3i2.2416
Guo, X., Wu, Y., and Xie, X. (2017). “Water vapor sorption properties of cellulose nanocrystals and nanofibers using dynamic vapor sorption apparatus,” Sci. Rep. 7(1), article 14207. DOI: 10.1038/s41598-017-14664-7
Heinze, T., and Liebert, T. (2012). “10.05 – Celluloses and polyoses/hemicelluloses,” in: Polymer Science: A Comprehensive Reference, K. Matyjaszewski and M. Möller (eds.), pp. 83-152. Elsevier, Amsterdam.
Hua, X., Laleg, M., and Owston, T. (2011). “Cellulose nanofilaments and method to produce same,” US Patent No. 20110277947A1, FPINNOVATIONS.
Hurmekoski, E., Jonsson, R., Korhonen, J., Jänis, J., Mäkinen, M., Leskinen, P., and Hetemäki, L. (2018). “Diversification of the forest industries: Role of new wood-based products,” Can. J. For. Res. 48(12), 1417-1432. DOI: 10.1139/cjfr-2018-0116
Hurmekoski, E., Kunttu, J., Heinonen, T., Pukkala, T., and Peltola, H. (2023). “Does expanding wood use in construction and textile markets contribute to climate change mitigation?” Renewable and Sustainable Energy Reviews 174, article 113152. DOI: 10.1016/j.rser.2023.113152
Hussain, N. I. A. M., Bonnia, N. N., Hirzin, R. S. F. N., Ali, E. S., and Zawawi, E. Z. E. (2019). “Effect of NCO/OH ratio on physical and mechanical properties of castor-based polyurethane grouting materials,” J. Phys.: Conf. Ser. 1349(1), article 012113. DOI: 10.1088/1742-6596/1349/1/012113
IEA. (2020). “Key world energy statistics 2020 – Analysis – IEA.” IEA. Accessed October 6, 2020. https://www.iea.org/reports/key-world-energy-statistics-2020.
IEA. (2022). “Tracking clean energy progress – Topics.” IEA. Accessed October 29, 2022. https://www.iea.org/topics/tracking-clean-energy-progress.
Iotti, M., Gregersen, Ø. W., Moe, S., and Lenes, M. (2011). “Rheological studies of microfibrillar cellulose water dispersions,” J. Polym. Environ. 19(1), 137-145. DOI: 10.1007/s10924-010-0248-2
Jonjaroen, V., Ummartyotin, S., and Chittapun, S. (2020). “Algal cellulose as a reinforcement in rigid polyurethane foam,” Algal Research 51, article 102057. DOI: 10.1016/j.algal.2020.102057
Ju, X., Bowden, M., Brown, E. E., and Zhang, X. (2015). “An improved X-ray diffraction method for cellulose crystallinity measurement,” Carbohydrate Polymers 123, 476-481. DOI: 10.1016/j.carbpol.2014.12.071
Kalamees, T., Põldaru, M., Ilomets, S., Klõšeiko, P., Kallavus, U., Rosenberg, M., and Õiger, K. (2020). “Failure analysis of a spray polyurethane foam roofing system.” Journal of Building Engineering 32, article 101752. DOI: 10.1016/j.jobe.2020.101752
Karppinen, A., Saarinen, T., Salmela, J., Laukkanen, A., Nuopponen, M., and Seppälä, J. (2012). “Flocculation of microfibrillated cellulose in shear flow,” Cellulose 19(6), 1807-1819. DOI: 10.1007/s10570-012-9766-5
Khazabi, M., and Sain, M. (2015). “Morphological and thermo-mechanical characterization of open-cell spray polyurethane foamed wall insulation modified with cellulose fiber”. Advances in Petroleum Exploration and Development, 9(1), 13-21. Available from: URL: http://www.cscanada.net/index.php/aped/article/view/6319 DOI: http://dx.doi.org/10.3968/6319
Klemm, D. (1998). Comprehensive Cellulose Chemistry: Fundamentals and Analytical Methods, Vol. 1. John Wiley & Sons, Ltd.
Klemm, D., Kramer, F., Moritz, S., Lindström, T., Ankerfors, M., Gray, D., and Dorris, A. (2011). “Nanocelluloses: A new family of nature-based materials,” Angewandte Chemie International Edition 50(24), 5438-5466. DOI : 10.1002/anie.201001273.
Kruger Inc. (2017). “Avantages de Filocell – Biomateriaux – Kruger Inc,” Biomaterials. Accessed October 28, 2020. https://biomaterials.kruger.com/fr/products/avantages-de-filocell/.
Kumar, M. N. S., and Siddaramaiah. (2007). “Thermo gravimetric analysis and morphological behavior of castor oil based polyurethane–polyester nonwoven fabric composites,” Journal of Applied Polymer Science 106(5), 3521-3528. DOI: 10.1002/app.26826.
Kuranska, M., Prociak, A., Michalowski, S., Cabulis, U., and Kirpluks, M. (2016). “Microcellulose as a natural filler in polyurethane foams based on the biopolyol from rapeseed oil,” Polimery 61(09), 625-632. DOI: 10.14314/polimery.2016.625.
Lafond, C., and Blanchet, P. (2020). “Technical performance overview of bio-based insulation materials compared to expanded polystyrene,” Buildings 10(5), 81. DOI: 10.3390/buildings10050081
Li, M.-C., Wu, Q., Moon, R., Hubbe, M., and Bortner, M. (2021). “Rheological aspects of cellulose nanomaterials: Governing factors and emerging applications,” Advanced Materials 33. DOI: 10.1002/adma.202006052
Maga, D., Hiebel, M., and Aryan, V. (2019). “A comparative life cycle assessment of meat trays made of various packaging materials,” Sustainability 11(19), article 5324. DOI: 10.3390/su11195324
Marcovich, N. E., Auad, M. L., Bellesi, N. E., Nutt, S. R., and Aranguren, M. I. (2006). “Cellulose micro/nanocrystals reinforced polyurethane,” Journal of Materials Research 21(4), 870-881. DOI: 10.1557/jmr.2006.0105
Mihranyan, A., Llagostera, A. P., Karmhag, R., Strømme, M., and Ek, R. (2004). “Moisture sorption by cellulose powders of varying crystallinity,” International Journal of Pharmaceutics 269(2), 433-442. DOI: 10.1016/j.ijpharm.2003.09.030
Mitiakoudis, A., and Gandini, A. (1991). “Synthesis and characterization of furanic polyamides,” Macromolecules 24(4), 830-835. DOI: 10.1021/ma00004a003
Mort, R., Vorst, K., Curtzwiler, G., and Jiang, S. (2021). “Biobased foams for thermal insulation: Material selection, processing, modelling, and performance,” RSC Advances 11(8), 4375-4394. DOI: 10.1039/D0RA09287H
Mukhopadhyaya, P., Ton-That, M.-T., Ngo, T.-D., Legros, N., Masson, J.-F., Bundalo-Perc, S., and van Reenen, D. (2014). “An investigation on bio-based polyurethane foam insulation for building construction,” Next-Generation Thermal Insulation Challenges and Opportunities, T. K. Stovall and T. Whitaker (eds.), pp. 1-11. 100 Barr Harbor Drive, PO Box C700, West Conshohocken, PA 19428-2959: ASTM International.
Omran, A. A. B., Mohammed, A. A. B. A., Sapuan, S. M., Ilyas, R. A., Asyraf, M. R. M., Rahimian Koloor, S. S., and Petrů, M. (2021). “Micro- and nanocellulose in polymer composite materials: A review,” Polymers 13(2), article 231. DOI: 10.3390/polym13020231
Panaitescu, D. M., Frone, A. N., and Chiulan, I. (2017). “Green composites with cellulose nanoreinforcements,” in: Handbook of Composites from Renewable Materials, pp. 299-337. John Wiley & Sons, Ltd.
Park, S., Baker, J. O., Himmel, M. E., Parilla, P. A., and Johnson, D. K. (2010). “Cellulose crystallinity index: Measurement techniques and their impact on interpreting cellulase performance,” Biotechnol Biofuels 3(1), 10. DOI: 10.1186/1754-6834-3-10
Patil, I. (2021). “Visualizations with statistical details: The ‘ggstatsplot’ approach,” Journal of Open Source Software 6(61), article 3167. DOI: 10.21105/joss.03167
Raimbault, C., Laure, P., François, G., Boyer, S., Vincent, M., Choquart, F., and Agassant, J.-F. (2021). “Foaming parameter identification of polyurethane using FOAMAT® device,” Polymer Engineering & Science 61(4), 1243-1256. DOI: 10.1002/pen.25676.
Reinerte, S., Kirpluks, M., and Cabulis, U. (2019). “Thermal degradation of highly crosslinked rigid PU-PIR foams based on high functionality tall oil polyol,” Polymer Degradation and Stability 167, 50-57. DOI: 10.1016/j.polymdegradstab.2019.06.021
Rueden, C. T., Schindelin, J., Hiner, M. C., DeZonia, B. E., Walter, A. E., Arena, E. T., and Eliceiri, K. W. (2017). “ImageJ2: ImageJ for the next generation of scientific image data,” BMC Bioinformatics 18(1), article 529. DOI:10.1186/s12859-017-1934-z
Salmén, L., and Stevanic, J. S. (2018). “Effect of drying conditions on cellulose microfibril aggregation and ‘hornification,’” Cellulose 25(11), 6333-6344. DOI: 10.1007/s10570-018-2039-1
Schiavoni, S., D׳Alessandro, F., Bianchi, F., and Asdrubali, F. (2016). “Insulation materials for the building sector: A review and comparative analysis,” Renewable and Sustainable Energy Reviews 62, 988-1011. DOI: 10.1016/j.rser.2016.05.045
Segal, L., Creely, J. J., Martin, A. E., and Conrad, C. M. (1959). “An empirical method for estimating the degree of crystallinity of native cellulose using the X-Ray diffractometer,” Textile Research Journal 29(10), 786-794. DOI: 10.1177/004051755902901003
Septevani, A. A., Evans, D. A. C., Annamalai, P. K., and Martin, D. J. (2017). “The use of cellulose nanocrystals to enhance the thermal insulation properties and sustainability of rigid polyurethane foam,” Industrial Crops and Products 107, 114-121. DOI: 10.1016/j.indcrop.2017.05.039
Septevani, A. A., Evans, D. A. C., Martin, D. J., and Annamalai, P. K. (2018). “Hybrid polyether-palm oil polyester polyol based rigid polyurethane foam reinforced with cellulose nanocrystal,” Industrial Crops and Products 112, 378-388. DOI: 10.1016/j.indcrop.2017.12.032
Sheokand, S., Modi, S. R., and Bansal, A. K. (2014). “Dynamic vapor sorption as a tool for characterization and quantification of amorphous content in predominantly crystalline materials,” Journal of Pharmaceutical Sciences 103(11), 3364-3376. DOI: 10.1002/jps.24160
Silva, M. C., Takahashi, J. A., Chaussy, D., Belgacem, M. N., and Silva, G. G. (2010). “Composites of rigid polyurethane foam and cellulose fiber residue,” Journal of Applied Polymer Science 117(6), 3665-3672. DOI: 10.1002/app.32281
Standards Council of Canada – Conseil canadien des normes. 2015a. “CAN/ULC-S770-15 – Méthode d’essai normalisée pour la détermination de la résistance thermique à long terme des mousses isolantes thermiques à alvéoles fermés,” Accessed November 2, 2020. https://www.orderline.com/downloadable/download/link/id/MC43MTg0MDIwMCAxNjA0MzM3NTc4MjAwMDgyMDA3MzIxMDI1NjY%2C/.
Standards Council of Canada – Conseil canadien des normes. 2015b. “CAN/ULC-S705-1 – Norme sur l’isolant thermique en mousse de polyuréthane rigide pulvérisée de densité moyenne – spécifications relatives aux matériaux.”
Stanzione, M., Oliviero, M., Cocca, M., Errico, M. E., Gentile, G., Avella, M., Lavorgna, M., Buonocore, G. G., and Verdolotti, L. (2020). “Tuning of polyurethane foam mechanical and thermal properties using ball-milled cellulose,” Carbohydrate Polymers 231, article 115772. DOI: 10.1016/j.carbpol.2019.115772
Straube, J., Smith, R., and Finch, G. (2009). RR-0912_Spray_Polyurethane Foam_CUFCA.pdf. Building Energy Group, University of Waterloo.
Szycher, M. (2012). “Structure–property relations in polyurethanes,” 50, Szycher’s Handbook of Polyurethanes, 2nd Ed., CRC Press. DOI: 10.1201/b12343-4
Uram, K., Leszczyńska, M., Prociak, A., Czajka, A., Gloc, M., Leszczyński, M. K., Michałowski, S., and Ryszkowska, J. (2021). “Polyurethane composite foams synthesized using bio-polyols and cellulose filler,” Materials 14(13), article 3474. DOI: 10.3390/ma14133474
Xie, Y., Hill, C. A. S., Jalaludin, Z., and Sun, D. (2011). “The water vapour sorption behaviour of three celluloses: Analysis using parallel exponential kinetics and interpretation using the Kelvin-Voigt viscoelastic model,” Cellulose 18(3), 517-530. DOI: 10.1007/s10570-011-9512-4
Yousefi, Y. (2019). Hygrothermal Properties of Building Materials at Different Temperatures and Relative Humidities, Master Thesis, British Columbia Institute of Technology (BCIT).
Zhou, X., Sain, M. M., and Oksman, K. (2016a). “Semi-rigid biopolyurethane foams based on palm-oil polyol and reinforced with cellulose nanocrystals,” Composites Part A: Applied Science and Manufacturing 83, 56-62. DOI: 10.1016/j.compositesa.2015.06.008
Zhou, X., Sethi, J., Geng, S., Berglund, L., Frisk, N., Aitomäki, Y., Sain, M. M., and Oksman, K. (2016b). “Dispersion and reinforcing effect of carrot nanofibers on biopolyurethane foams,” Materials & Design 110, 526-531. DOI: 10.1016/j.matdes.2016.08.033
Zor, M., Mengeloğlu, F., Aydemir, D., Şen, F., Kocatürk, E., Candan, Z., and Ozcelik, O. (2023). “Wood plastic composites (WPCs): Applications of nanomaterials,” in: Emerging Nanomaterials: Opportunities and Challenges in Forestry Sectors, H. R. Taghiyari, J. J. Morrell, and A. Husen (eds.), pp. 97-133. Cham: Springer International Publishing.
Article submitted: June 7, 2023; Peer review completed: June 12, 2023; Revised version received and accepted: July 13, 2023; Published: July 21, 2023.
DOI: 10.15376/biores.18.3.6086-6117