

Satisficing Behaviour in Web Surveys. Results from a Comparison of Web and Paper Mode across Four National Survey Experiments
Clement S.L., Severin-Nielsen M. K. & Shamshiri-Petersen, D. (2023). Satisficing Behaviour in Web Surveys. Results from a Comparison of Web and Paper Mode across Four National Survey Experiments. Survey Methods: Insights from the Field. Retrieved from https://surveyinsights.org/?p=16640
© the authors 2023. This work is licensed under a Creative Commons Attribution 4.0 International License (CC BY 4.0) 
Abstract
Although the use of web for survey data collection has become an integral part of survey research, the quality of responses in web-based surveys is still questioned. The worry is that self-administered web-based surveys are more cognitively burdensome to respondents or encourage multi-tasking or speeding during completion, causing respondents to put lesser effort in the completion. However, most studies addressing mode differences in satisficing behaviour in web-based surveys have compared web to interviewer-administered modes, not considering that the presence of an interviewer is likely to motivate the respondent to make a greater effort. Thus, in order to contribute to more solid knowledge on the question of whether web-based surveys encourage satisficing behaviour, the present study use experimental data from four high internet coverage countries (Denmark, Iceland, Finland, and Norway) and compares web-based survey responses to paper-based responses. Findings suggest that worries over response quality in web-based surveys are unnecessary. Analyses of three different measures of satisficing behaviour in survey responses do not give any support to the assumption that respondents completing on web are more prone to satisficing behaviour.
Keywords
data quality, interviewer effects, Satisficing, Survey response behaviour, Web surveys
Copyright
© the authors 2023. This work is licensed under a Creative Commons Attribution 4.0 International License (CC BY 4.0)
Introduction
The use of web for survey data collection has become an integral part of survey research. Over the last decades, self-administered surveys on the web have become rather common (Revilla et al. 2015), and recently even the standard in many countries (Kelfve et al. 2020). The advantages of conducting self-administered web-based surveys over other data collection modes are well-established. Costs are lower, it is less time consuming for the researcher (Couper 2000; de Leeuw 2018; Dillman, Smyth, and Christian 2009; Roberts 2007), and respondents increasingly appreciate the opportunity to complete the questionnaire at their own convenience (Dalati and Gómez 2018). Previous concerns over coverage and sampling errors in web-based surveys (e.g., Bradley 1999; Couper 2000; Crawford, Couper, and Laminas 2001; Hoek, Gendall, and Healey 2002; Kaye and Johnson 1999; Solomon 2001) have diminished as well. This at least applies to most Western countries, where internet access and digital literacy have become prevalent, and where web-based surveys are considered a way of reaching the increasing number of otherwise reluctant respondents (for an overview of the use of different modes, e.g., Roberts et al. 2019; de Leeuw 2018).
However, the debate over response quality in web-based surveys is not completely settled yet. For instance, it has been argued that respondents put lesser effort into answering web-based questionnaires thoughtfully, because self-administered web-based surveys can be more cognitively burdensome to respondents and might encourage multi-tasking or speeding during completion (Conrad et al. 2017; Heerwegh and Loosveldt 2008; Malhotra 2008; Tourangeau, Rips, and Rasinski 2000; see also Revilla 2016). Results on whether satisficing behaviour, i.e. respondent’s likelihood to exert the required cognitive effort to answer the survey questions optimally (cf. Krosnick 1991; Krosnick, Narayan, and Smith 1996), is more common in web-based surveys than other modes are mixed. Earlier studies on mode effects find support for the assumption that web respondents are more prone to satisficing behaviour (Fricker et al. 2005; Heerwegh and Loosveldt, 2008; Roster et al. 2004) such as higher dropout rates, less differentiated responses on scales and eliciting more “no opinion” responses. However, the empirical findings are neither comprehensive nor unambiguous. More recent studies conclude that web-based surveys do not lead to more measurement errors than do other data collection modes (for overviews, see Tourangeau, Conrad, and Couper 2013; de Leeuw 2018; Cernat and Revilla 2021), and a study by Felderer, Kirchner, and Kreuter (2019) even suggests that web-based surveys produce fewer measurement errors (2019:107).
Most studies on the quality of responses in web surveys have compared the web mode to an interviewer-administered mode (e.g., Braunsberger, Wybenga, and Gates 2007; Cernat and Revilla 2021; Felderer, Kirchner, and Kreuter 2019; Fricker et al. 2005; Greene, Speizer, and Wiitala 2008; Roster et al. 2004). This comparison is somewhat problematic since the presence of an interviewer, either face-to-face or by telephone, is likely to cause the respondent to answer more in line with the presumed expected answer (cf. social desirability bias; see Kreuter, Presser and Tourangeau 2008) or to make a greater effort. Studies also find that it is possible for an interviewer to motivate the respondent to complete the questionnaire, if he or she considers skipping either single items or half the questionnaire, or even to answer the questions more carefully (for an overview see West and Blom 2017). Thus, it is difficult to determine whether previous findings result from interviewer effects.
As to self-administered survey modes, several studies have analysed differences in coverage, response rates etc. between web and paper surveys (e.g., Björkan 2010; Denscombe 2008, 2009; Bech and Kristensen 2009; see also Shin, Johnson and Rao 2012 for an overview), but fewer studies have focused on differences in response behaviour. Magraw-Mickelsen, Wang and Gollwitzer (2022) examined the effect of survey mode on careless responding with data from three different samples, finding only minimal and ambiguous differences between modes across cultures. Likewise, a meta-analysis of 51 articles analysing mode effects on social desirability (Dodou and de Winter 2014) concludes that: “…social desirability in offline, online, and paper surveys is practically the same.” (p.494). A panel study by Shin, Johnson, and Rao (2012) found that web surveys produced fewer “don’t know” responses than mail surveys but concluded that the characteristics of the panelists might affect the findings, as most of the mode effect disappeared after controlling for sociodemographic characteristics of respondents (pp. 222-223). Furthermore, lower item non-response on web and more detailed answers to open questions was found in a direct comparison, if respondents were allowed to choose between web or paper mode themselves (de Rada and Domínguez-Álvares 2014).
To contribute to the question of whether self-administered web-based surveys encourage satisficing behaviour, we need to compare it to another self-administered mode. The aim of the present study is to gain firmer knowledge on satisficing in web-based surveys. By comparing survey response behaviour on experimental data from representative population samples in four high internet coverage (above 92 percent)[1] countries (Denmark, Iceland, Finland, and Norway), where respondents are randomly assigned to survey completion on either web (“web group”) or paper (“paper group”), it is possible to determine whether web mode induces poorer survey responses among respondents. Comparisons of data from high-coverage countries eliminate the impact of differences in coverage across countries, the experimental design enables the elimination of self-selection effects, and comparing web mode with another self-administered mode of data collection eliminates potential interviewer effects.
Methods
Data
The study utilised data from national survey experiments in four high coverage countries: Denmark, Norway, Iceland, and Finland. The experiments were conducted in 2014/15 as part of the ISSP module on “Citizenship” and were based on nationally representative samples. In all four countries, respondents were randomly assigned to one of two mode groups: “web group” or “paper group.” In Norway, Finland, and Iceland, the main samples were asked to complete the questionnaire on paper, and a sub-sample was asked to complete a web-based version. If respondents from the sub-sample refused to answer the web-based questionnaire, they were offered a paper questionnaire. In Denmark, the main sample was web-based, and the sub-sample was paper. Furthermore, the Danish experiment was conducted with “pure” modes, meaning that respondents in the main sample were only allowed to complete the web-based questionnaire, and respondents in the sub-sample were only allowed to complete a paper questionnaire. In this study, web respondents were instructed to complete the questionnaire on a computer, as the questionnaire was not designed for smartphones or tablets[2].
A total of 6,219 respondents in the four countries completed the questionnaire (Denmark n=1,758; Norway n=1,459; Finland n=1,505; Iceland n=1,497)[3]. See Table 1 below for an overview and for the response rates for the different samples in the four countries:
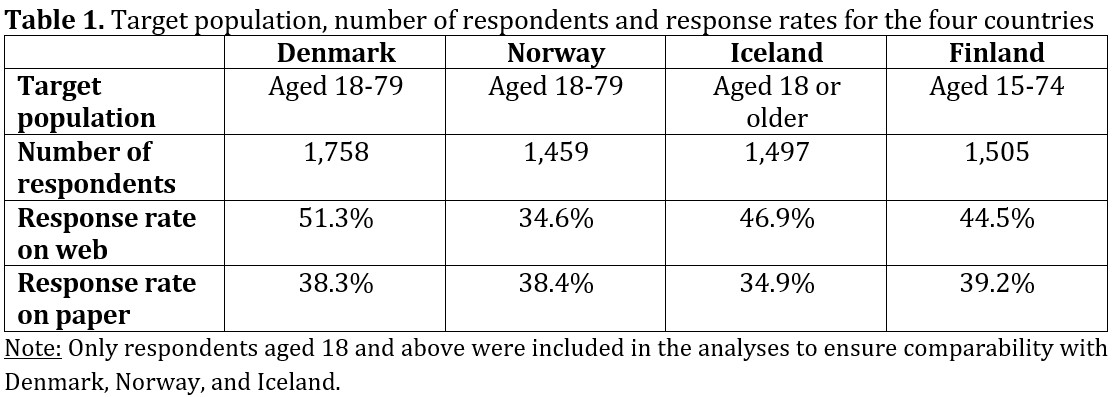
In both Denmark, Iceland, and Finland, the response rates were higher for web respondents than for paper respondents, but in Norway the response rate is higher on paper than on web. The highest response rate was found among the web mode sample in Denmark, where 51.3 percent of the sample completed the questionnaire.
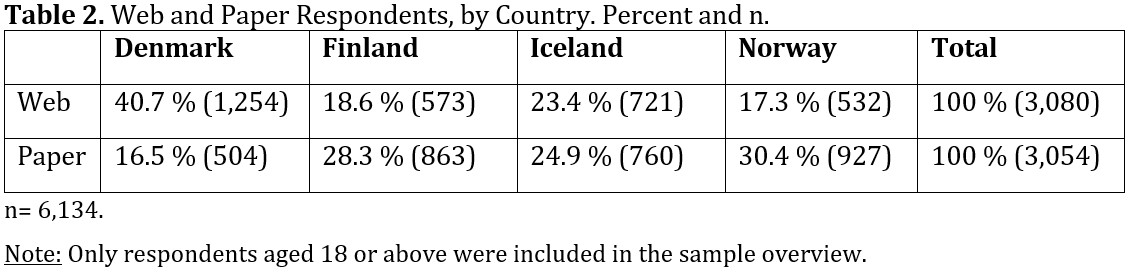
Thus, as demonstrated in Table 2, Danes constitute 40.7 percent of the “web group”, compared to only 17.3 percent Norwegians. Conversely, Danes constitute only 16.5 percent of the “paper group” compared to 30.4 percent Norwegians.
Sample Characteristics
Randomly assigning respondents to mode groups is supposed to ensure identical gross samples. However, due to differences in the countries’ representation in the two groups, and since Norway, Iceland, and Finland did not implement pure modes in the sampling, self-selection biases may occur. Thus, it is necessary to compare the web and paper groups on core demographic variables before turning to the analysis of differences in satisficing behaviour.
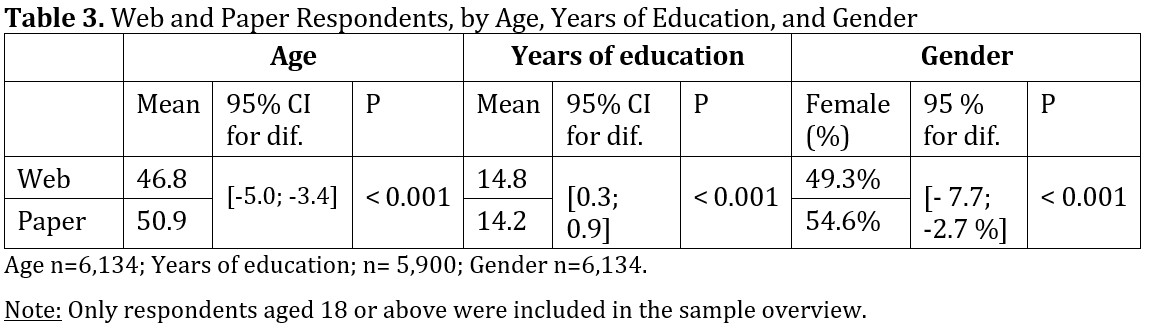
As summarized in Table 3, statistically significant differences were found between web and paper respondents. Respondents in the web group were 3.4 to 5 years younger than the respondents in the paper group (T-test for difference, p value < 0.001), and the proportion of females was significantly lower in the web group (Z-test for difference, p value < 0.001). Only smaller differences were found regarding years of education (95% CI: 0.3 to 0.9 years higher in the web group, p value < 0.001). This necessitate controlling for these variables in the analyses (see Data Analysis).
Measurement of Satisficing
The level of satisficing has been operationalised and analysed using several indicators of the respondent not investing the necessary amount of cognitive effort to answer the questions in an optimal manner (Roßmann and Silber 2020). For the operationalisation of the measure of satisficing we used indicators based on satisficing theory (e.g., Krosnick 1991), and as listed by Roberts et al. (2019). As the questionnaire originally was not designed to test differences in satisficing but was a part of the general ISSP data collection, our operationalisation options were limited. This, of course, needs to be taken into consideration when concluding on the results. Inspired by previous empirical studies (see e.g., Keusch and Yan 2017; Lugtig and Toepoel 2016; Mavletova, 2013; Clement, Severin, and Shamshiri-Petersen 2020) and based on the data available, this study adopted three measures of satisficing, i.e., a measure of primacy effects, acquiescence, and no-opinion filter effects:
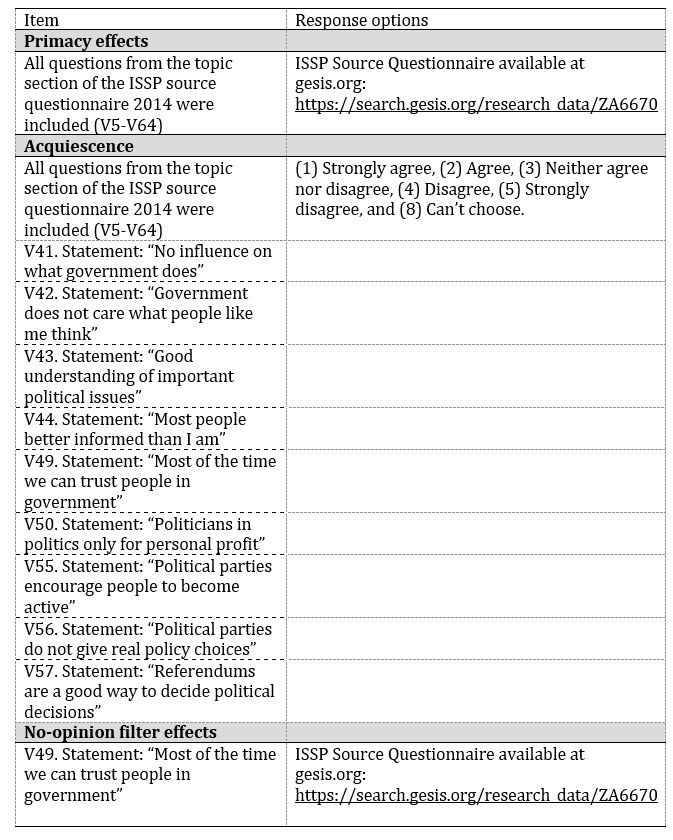
- Primacy effects is a type of response-order effect that may occur when respondents must choose from a list of (sometimes many) response options. Instead of thinking carefully about which option is most appropriate, the first reasonable answer is chosen, which is called a primacy effect (Holbrook et al. 2007; Narayan and Krosnick 1996; Schuman and Presser 1981). In this study, the primacy effect is measured by respondents’ answers to all 60 items from the topic section of the ISSP 2014 dataset. For each question to which the respondents selected the first possible response option, they were assigned 100 points. Subsequently, the respondents’ mean scores were calculated to form an index ranging from 0 to 100, where respondents with a score of 100 selected the first response option on all items and respondents with a score of 0 did not select the first response option on any of the items included in the index. Higher mean scores are interpreted as more pronounced satisficing behaviour.
- Acquiescence refers to a tendency to provide a positive response, such as agreement to any statement, regardless of its content (Baumgartner and Steenkamp 2001). There are several explanations for this, one being that acquiescence occurs partly due to social politeness norms. Consistently, the effect is stronger among cultures that value politeness and deference highly, and strongest among respondents who are less able or motivated to answer questions, or on questions that are considered complicated (Holbrook 2008). Theoretically, acquiescence differs from primacy effects. Empirically, however, when the first response option on an item is also positive, it is difficult to establish whether respondents’ satisficing behaviour is motivated by one or the other. In the ISSP data, response options on all attitude questions ranged from “Strongly agree” to “Strongly disagree”, that is, presenting the positive option first. However, although it is not possible to rule out primacy effects, examining response behaviour on these questions separately compared to the primacy measurement, will yield indications of acquiescence. Thus, in the present study, acquiescence is measured by an index based on respondents’ answers to nine attitude questions on citizenship with Likert scale response categories (for a detailed overview of the items, see Appendix A). As for the index of primacy effects, respondents were assigned 100 points for each item to which they selected either the “Agree” or “Strongly Agree” response option. Calculating mean scores, we constructed an index ranging from 0 to 100. The higher the mean scores across items, the more pronounced satisficing behaviour since the items included both positive and negative statements.
- No-opinion filter effects refers to respondents choosing “no opinion” response options instead of expressing an attitudinal stance to ease the cognitive burden. This kind of satisficing is based on the assumption that, when an attitude question is asked, respondents have an opinion about the specific issue. However, this need not be the case; they may simply not have an opinion on the subject matter. Also, if a factual question is asked, respondents may lack the knowledge to answer it. Therefore, a no opinion response option, such as “Don’t know” or “Can’t choose”, is typically allowed for, but it is usually done with considerable reluctance. The argument is that more people than the “true-no-attitudes” respondents will choose the no opinion category if it is made available (Krosnick et al. 2002; Schuman and Presser 1981). In the study, the no-opinion filter effects measure was calculated based on respondents’ answers to all 60 items from the topic section of the ISSP dataset. Again, for each item to which the respondents selected the “Can’t choose” response option, they were assigned 100 points. Afterwards, mean scores were calculated to form an index ranging from 0 to 100, where the closer the scores are to 100, the more pronounced no-opinion filter effects. A “Can’t choose” response can be a true no-attitude stance. However, the more inclined respondents are to select this response category across the questionnaire, the more pronounced satisficing behaviour.
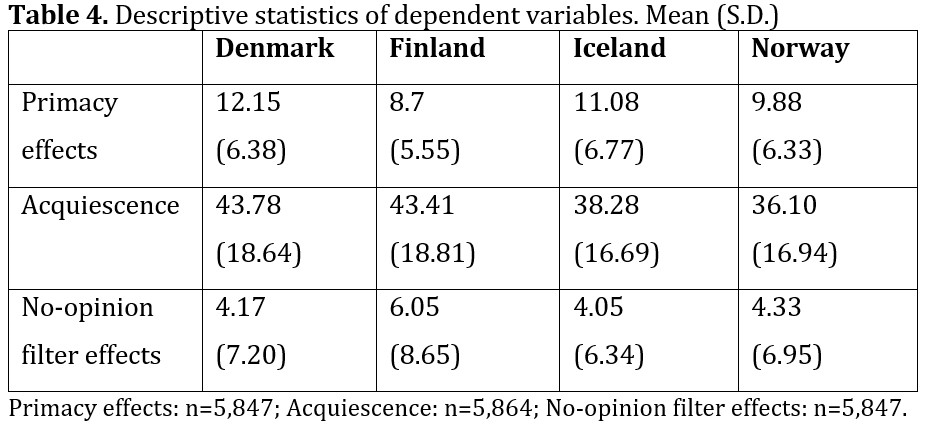
Table 4 provides an overview of respondent mean scores on the constructed measures of satisficing across the four countries. As evident from the table, the mean scores vary across the measures, with the highest mean scores on the acquiescence index and the lowest mean scores on the no-opinion filter effects index. Country and mode differences will be discussed further in the results section.
Data Analysis
The data analysis is carried out in three steps, i.e., one for each satisficing measure included. In each of the steps, multiple linear regression analyses are conducted in IBM SPSS Statistics 27 with one of the satisficing measures as the dependent variable and survey mode (0: paper group, 1: web group) as the main independent variable. This is conducted for each of the four countries separately to detect potential cross-country differences.
The regression analyses are built hierarchically, and each consist of two blocks. In the first block, the uncontrolled association between web-based survey response and the inclination to satisfice is examined (measured as either acquiescence, primacy effects, or no-opinion filter effects). In the second block, core demographic variables (gender, age, and years of education) are added to the model to account for the differences between the web and paper group, as mentioned previously. The regression analyses examine main effects and include Adjusted R2, p-values, and unstandardized parameter estimates to assess whether web-based survey response is associated with higher inclination to satisfice than paper-based survey response.
Results
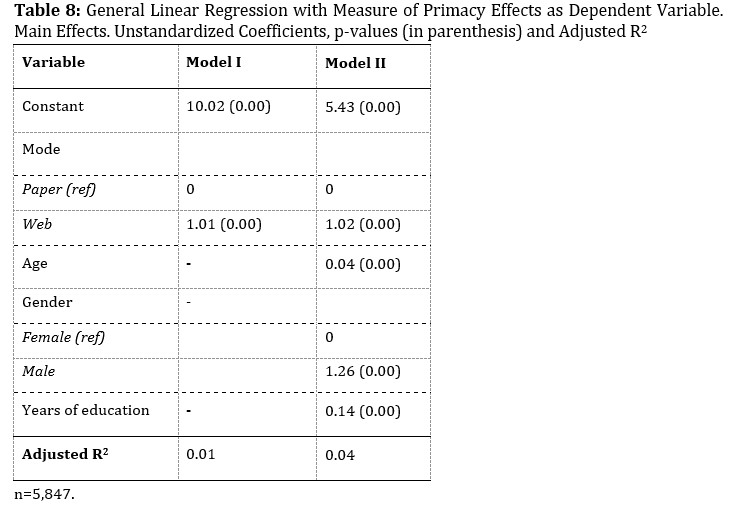
In the first regression analyses for each of the four countries, the measure of primacy effects is treated as the dependent variable in the models. As displayed in Table 5, in three out of the four countries, there is no statistically significant effect from web-based survey completion on respondents’ inclination to select the first response option compared to completions on paper. In Finland and Norway, the unstandardised coefficient for web mode in Model I is positive, indicating that compared to paper respondents, the score on the primacy index is respectively 0.31 and 0.41 points higher in the web group. However, both coefficients are insignificant and decrease in the controlled models (Model II). In Denmark, the coefficient for web mode is positive (0.05) in Model I and increases when controlling for gender, age, and years of education (Model II). Still, in both models the unstandardised coefficient is inconsiderable and statistically insignificant.

In the Icelandic sample, we find that respondents in the web group are more prone to choose the first option compared to the paper group. A significant coefficient indicates that when going from paper to web, the score on the primacy effect variable increases with 0.79 points. This holds in the controlled model, where the coefficient decreases, but remains significant.
Replacing the measure of primacy effects with acquiescence as dependent variable, we do not find any consistent support for the assumption that web mode increases satisficing behaviour. As demonstrated in Table 6, none of the coefficients for the web group are significant.
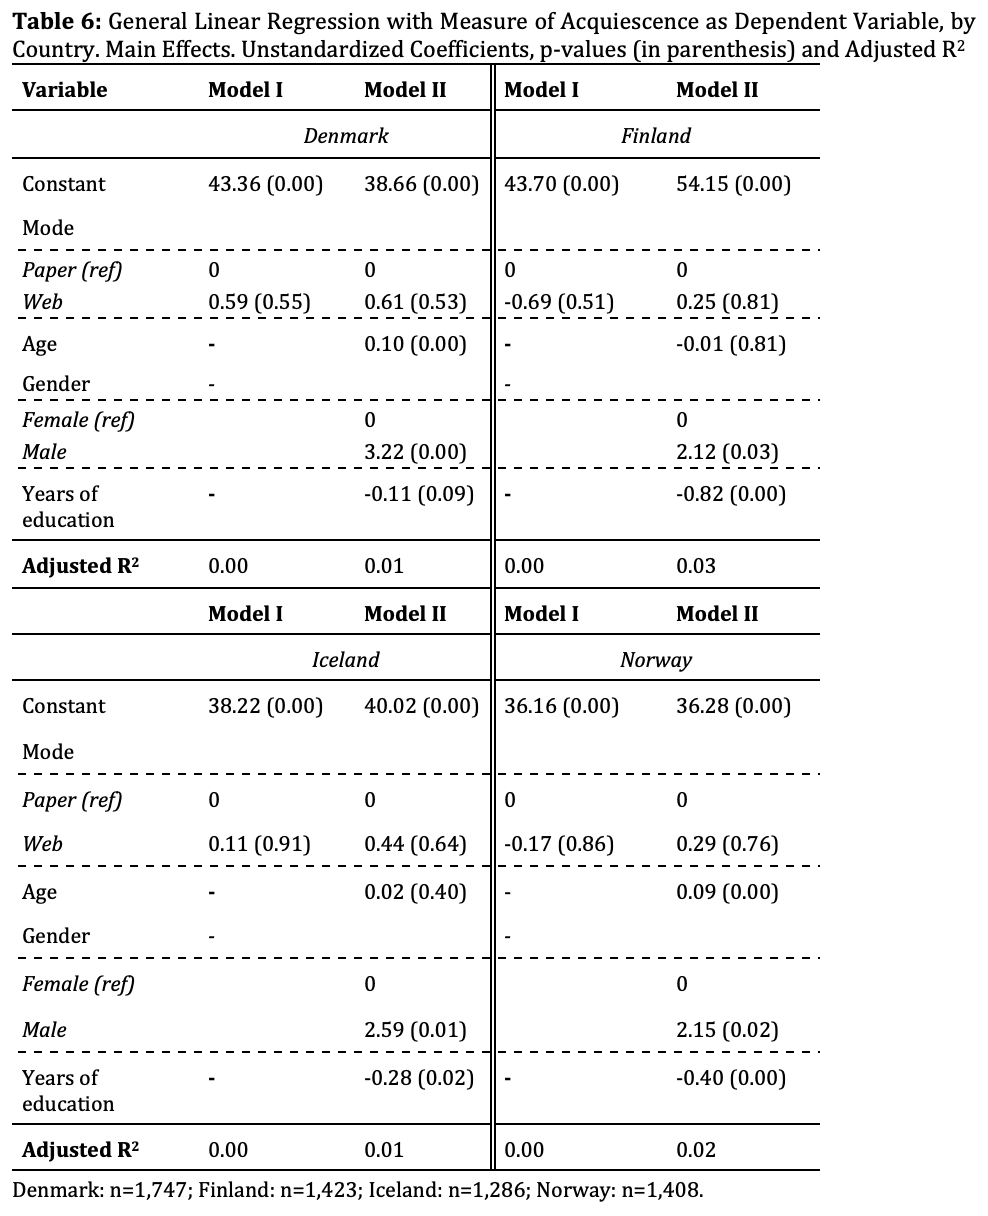
When controlling for gender, age, and years of education in the second models (Model II), the negative (insignificant) coefficients in Finland and Norway becomes positive, and the positive estimates in Denmark and Iceland increase a bit. However, none of them is even close to being statistically significant.
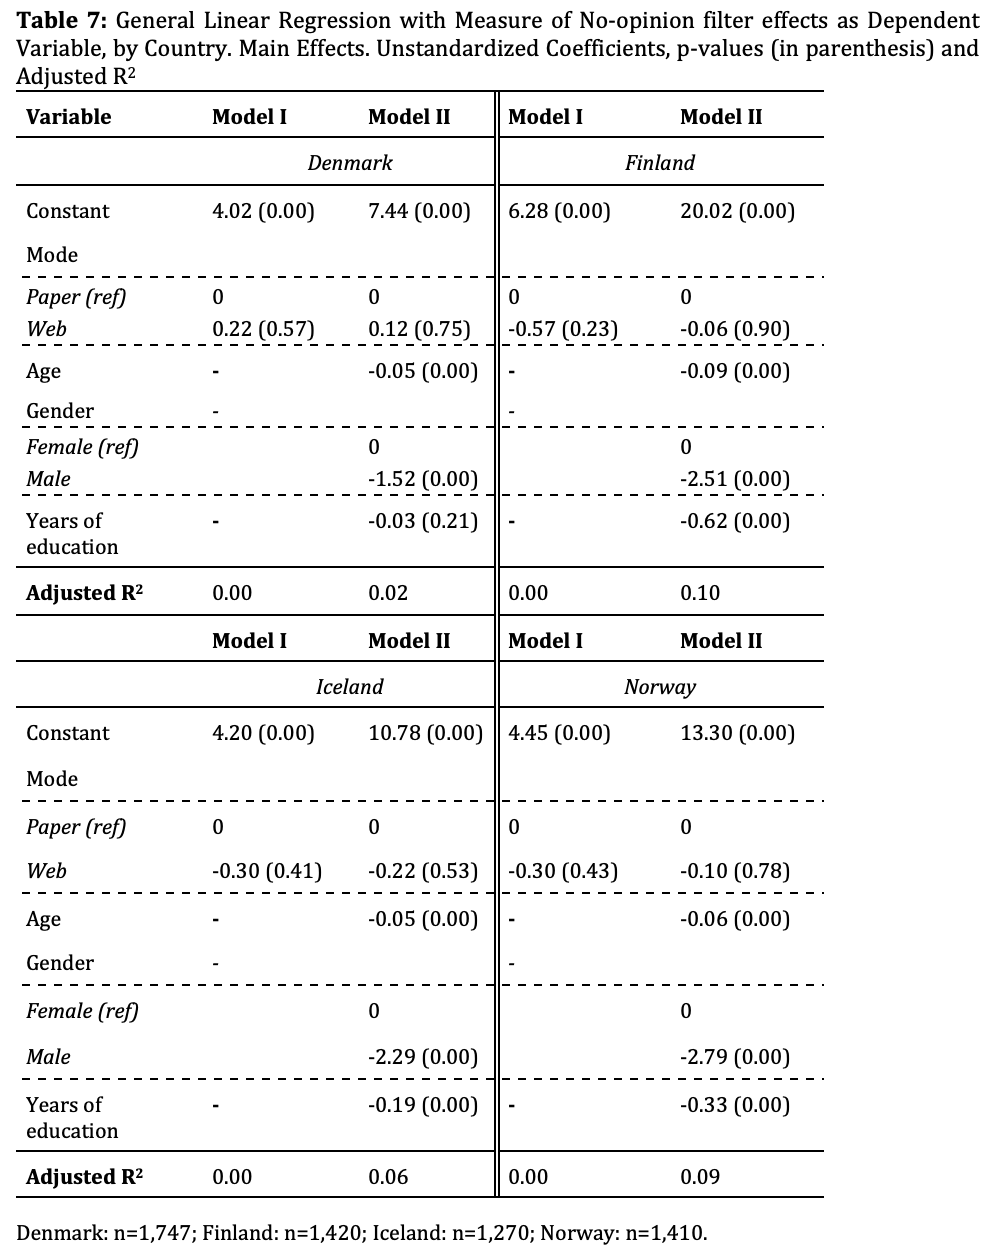
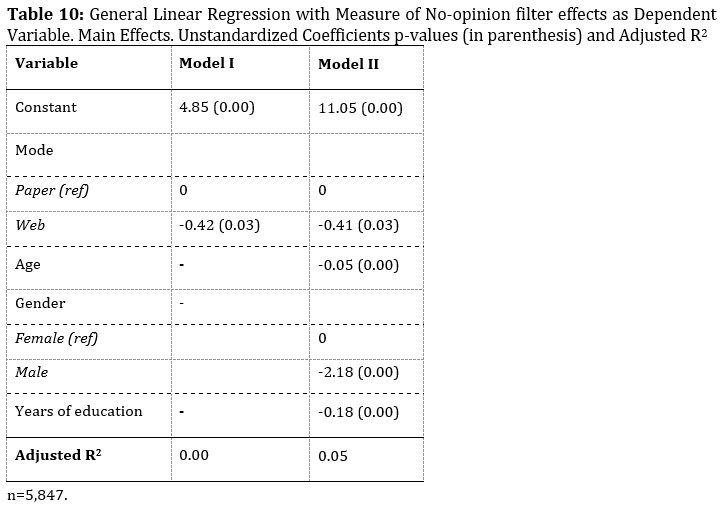
As evident from Table 7, the third regression analyses, where the measure of no-opinion filter effects is treated as the dependent variable, reveals evidence of a web mode effect on satisficing behaviour. In Finland, Iceland, and Norway the unstandardised coefficients for the web group are negative in Model I (-0.57, -0.30 and -0.30), indicating that the paper group is more prone to select the “Can’t choose” response option compared to the web group. In Denmark, a positive coefficient of 0.22 indicates the opposite. However, in all four countries coefficients are insignificant, and in the controlled models (Model II) all coefficients decrease and remain insignificant.
In the analyses above, the four countries are analysed separately. However, in order to examine differences in satisficing behaviour between web and paper questionnaire completions, data are tentatively pooled (see Appendix B). In the pooled sample, significant effects are found. However, no clear conclusion is to be drawn here either. As to the inclination to agree (p value < 0.01) and to select the first possible response option irrespective of the question content (p value < 0.001) there is a statistically significant positive effect from web-based survey response – which in both cases remains when controlling for core demographic variables. However, with regard to respondents’ inclination to select the “Can’t choose” response option, there is at significant negative effect from web, which remains significant at 0.05 level in the controlled model, indicating that the paper group is more prone to satisficing. Thus, whereas the un-pooled data quite consistently provided insignificant effects, the pooled data provide quite inconsistent, i.e., both negative and positive, but significant effects. Together it fosters the conclusion as regards web- and paper modes, that one does not promote satisficing behaviour more than the other.
Conclusion/Discussion
Results from analyses of three different measures of satisficing behaviour in survey responses do not give support to an assumption that self-administered web-based surveys cause respondents to put lesser effort into answering the questionnaire in general. As evident from above, there is not statistically significant indications of the web group in the present experiment being more prone to neither acquiescence, primacy nor choosing the “Can’t choose” response option than the web group. Effect estimates tend to go in different directions in the four countries – and controlling for core demographic variables also impacts the effect from mode differently, both across countries and across satisficing measures. Only in one case a statistically significant result was found: In Iceland primacy effects was significantly more present in the web group than in the paper group.
Thus, results do not substantiate greater satisficing behaviour among the web group. Rather, and in line with parts of previous research on the field, differences found in the present study are both minor and ambiguous – not revealing any systematic mode differences regarding satisficing.
To examine whether web-based surveys encourage satisficing behaviour, this study has compared completion on web to paper. Most previous studies are based on comparisons of web- and telephone-based surveys, but since interviewers can foster and maintain survey respondents’ motivation to make an effort during completion of the questionnaire, it was crucial to eliminate the potential interviewer effect. However, based on our results, we do not find indications of web-based surveys being more cognitively burdensome or distracting to respondents.
Regarding limitations, the present study would have benefitted from more measures of satisficing behaviour, including attitude questions with the positive response option presented last in order to separate acquiescence and primacy effects. Unfortunately, data did not enable further operationalisation. Additional measures would have allowed for analysing more dimensions of satisficing behaviour among respondents in the two groups, presumably substantiating the conclusion that web and paper respondents do not differ significantly as regards to satisficing behaviour.
Further, as we argue that many differences in data quality between web mode and paper mode most likely can be ascribed to differences in coverage, the present study is based on four high-coverage countries; Denmark, Iceland, Finland, and Norway, with general populations characterized by a high level of technological literacy. This in order to minimise potential effects from some respondents’ unfamiliarity with the Internet and new technologies. That means, however, that we are not able to determine whether results are applicable to low-coverage countries. Clearly, in countries with lower levels of technological literacy, web-based surveys could potentially increase the cognitive burden, ultimately leading to poorer response quality. However, in that regard it can be considered an advantage that data dates back to 2014/2015. Whereas the four high-coverage countries could be regarded as “critical cases” (cf. Flyvbjerg 2006) at the time, development – i.e., more and more countries reaching similar level of coverage – has led them and thus the present results to be more representative. That said, it is a limitation of the present study that the questionnaire was not designed for mobile devices but only for PC. Today, an increasing number of respondents will use smartphones or tablets to answer, and that has raised questions of data quality across completion devices (e.g., Couper, Antoun and Mavletova 2017), as well as survey designs need to adjust accordingly.
For further research into quality of web-based surveys, it would be beneficial to examine the potential they hold to motivate respondents and to decrease the cognitive burden – potentially improving data quality. The interactive and dynamic nature of web media allows for survey designs that are more visually appealing and interesting for respondents to interact with, e.g., by interactive feedback, motivational messages etc., just as it holds the potential to assist respondents during the process, e.g., by providing different language options, read-aloud of instructions, interactive voice response, etc. Studies have to some degree assessed these advantages, but the potential for cognitively engaging and maintaining respondents in web-based surveys deserve to be subjected to exhaustive examination.
Appendix A. Overview of items used to construct satisficing measures
Appendix B. Regression analyses on pooled data

[1] Access from household: Denmark: 94%, Norway: 97%, Iceland: 96%, Finland: 92% (Eurostat, 2016 figures).
[2] Data do not include information on respondents’ completion device. However, in the ISSP 2015/2016 web-only survey – where the respondents were not instructed to complete the survey via PC – 13 % of all respondents completed on their smartphone, 15 % on tablet, and 70 % on PC. The remaining 2 % completed on either paper, telephone, or multiple devices.
[3] The target population varied across the four countries. In Denmark and Norway, the target population was adults aged 18‒79; in Iceland adults aged 18 or older; and in Finland adolescents and adults aged 15‒74 (ISSP Research Group 2016).
References
- Baumgartner, J. E. and Steenkamp, H. (2001). “Response Style in Marketing Research: A Cross-National Investigation.” Journal of Marketing Research 38.
- Bech, M. and M. B. Kristensen (2009). “Differential response rates in postal and web-based surveys among older respondents.” Survey Research Methods, 3, pp. 1-6.
- Bethlehem, J. and Biffignandi, S. (2012). Handbook of Web Surveys. Hoboken, NJ: John Wiley.
- Bishop, G. F. (1987). “Experiments with the middle response alternative in survey questions”. Public Opinion Quarterly 51 pp. 220-232.
- Bradley, N. (1999). “Sampling for Internet Surveys: An Examination of Respondent Selection for Internet Research.” Journal of Market Research Society 41 pp. 387-94.
- Braunsberger, K., Wybenga, H. and Gates, R. (2007). “A Comparison of Reliability between Telephone and Web-based Surveys.” Journal of Business Research 60 pp. 758-64.
- Börkan, B. (2010). “The mode effect in mixed-mode surveys mail and web surveys.” Social Science Computer Review, 28, pp. 371-380.
- Cernat, A. and Revilla, M. (2021). “Moving From Face-to-Face to a Web Panel: Impacts on Measurement Quality”. Journal of Survey Statistics and Methodology (2021) 9, 745-763.
- Clement, S. L., Severin, M. C., and Shamshiri-Petersen, D. (2020). Device effects on survey response quality. A comparison of smartphone, tablet and PC responses on a cross sectional probability sample. Survey Methods: Insights from the field. https://doi.org/10.13094/SMIF-2020-00020
- Conrad, F. G., Couper, M. P., Tourangeau, R. and Zhang, C. (2017). “Reducing Speeding in Web Surveys by Providing Immediate Feedback.” Survey Research Methods 11 pp. 45-61.
- Couper, M. P. (2000). “Web Surveys: A Review of Issues and Approaches.” Public Opinion Quarterly 64 pp. 464-94.
- Couper, M. P., Antoun, C., and Mavletova, A. (2017). Mobile Web Surveys: A Total Survey Error Perspective. In: Biemer, P. P. et al. (eds.), Total Survey Error in Practice (chapter 7, 133-154). New York: Wiley.
- Crawford, S. D., Couper, M. P. and Lamias, M. J. (2001). “Web Surveys. Perceptions of Burden.” Social Science Computer Review 19 pp. 146-62.
- de Leeuw, E. (2018). “Mixed Mode: Past, Present, and Future.” Survey Research Methods 12(2) pp. 75-89.
- Dalati, S. and J.M. Gómez (2018). “Surveys and Questionnaires”, in J.M. Gómaz and S. Mouselli (eds.), Modernizing the Academic Teaching and Research Environment, Springer International Publishing
- Denscombe, M. (2008). “The length of responses to open-ended questions: A comparison of online and paper questionnaires in terms of a mode effect.” Social Science Computer Review, 26, pp. 359-368.
- Denscombe, M. (2009). “Item non-response rates: A comparison of online and paper questionnaires.” International Journal of Social Research Methodology, 12, pp. 281-291.
- Dillman, D. A. (2000). Mail and Internet Surveys: The Tailored Design Method. 2nd ed. Hoboken, NJ: John Wiley.
- Dillman, D. A., Smyth, J. D. and Christian, L. M. (2009). Internet, Mail and Mixed-mode Surveys: The Tailored Design Method. Hoboken, NJ: John Wiley.
- Dodou, D. and J.C.F. de Winter (2014). “Social desirability is the same in offline, online, and paper surveys: A meta-analysis.” Computers in Human Behavior 36 (2014) pp. 487-495.
- Felderer, B., Kirchner, A. and Kreuter, F. (2019). “The Effect of Survey Mode on Data Quality: Disentangling Nonresponse and Measurement Error Bias.” Journal of Official Statistics 35(1) pp. 93-115.
- Fenichel, E., Lupi, F., Hoehn, J. F. and Kaplowitz, M. D. (2009). “Split-Sample Tests of “No Opinion” Responses in an Attribute-Based Choice Model.” Land Economics 85 (2) pp. 348-362.
- Flyvbjerg, B. (2006). “Five Misunderstandings About Case-Study Research.” Qualitative Inquiry, 12 (2) pp. 219-245.
- Fricker, S., Galestic, M., Tourangeu, R. and Yan, T. (2005). “An Experimental Comparison of Web and Telephone survey.” Public Opinion Quarterly 69(3) pp. 370-92.
- Greene, J., Speizer, H. and Wiitala, W. (2008). “Telephone and Web: Mixed-Mode Challenge.” Health Services Research 43(1) pp. 230-48.
- Heerwegh, D. and Loosveldt, G. (2008). “Face-to-face versus Web Surveying in a High-internet-coverage Population: Differences in Response Quality.” Public Opinion Quarterly 72(5) pp. 836-46.
- Hoek, J., Gendall, P. and Healey, B. (2002). “Web-based Polling: An Evaluation of Survey Modes.” Australasian Journal of Market Research 10, pp. 25-35.
- Holbrook, A. (2008). “Acquiescence Response Bias”, in P.J. Laurakas: Encyclopedia of Survey Research Methods, SAGE Research Methods.
- Holbrook, A., Green, M. C. and Krosnick, J. A. (2003). “Telephone versus Face-to-face Interviewing of National Probability Samples with Long Questionnaires: Comparisons of Respondent Satisficing and Social Desirability Response Bias.” Public Opinion Quarterly 67 pp. 79-125.
- Holbrook, A., Krosnick, J.A., Moore, D. and Tourangeau, R. (2007). “Response Order Effects in Dichotomous Categorical Questions Presented Orally: The Impact of Question and Respondent Attributes.” Public Opinion Quarterly 71(3) pp. 325-48.
- ISSP Research Group. 2016. International Social Survey Programme: Citizenship II – ISSP 2014. Cologne: GESIS Data Archive.
- Jäckle, A., Roberts, C. and Lynn, P. (2006). Telephone versus Face-to-face Interviewing: Mode Effects on Data Quality and Likely Causes (Report on phase II of the ESS-Gallup Mixed Mode Methodology Project). Colchester: University of Essex.
- Kaye, B. K. and Johnson, T. J. (1999). “Methodology: Taming the Cyber Frontier. Techniques for Improving Online Surveys.” Social Science Computer Review 17(3) pp. 323-37.
- Kelfve, S., Kivi, M., Johansson, B. and Lindwall, M. (2020): “Going web or staying paper? The use of web-surveys among older people.” BMC Medical Research Methodology (2020) 20:252.
- Keusch, F. and Yan, T. (2017). “Web Versus Mobile Web: An Experimental Study of Device Effects and Self-Selection Effects.” Social Science Computer Review 35(6) pp. 751-769.
- Kreuter, F., Presser, S. and Tourangeau, R. (2008). “Social Desirability bias in CATI, IVR, and Web Surveys. The Effects of Mode and Question Sensitivity.” Public Opinion Quarterly 72(5) pp. 847–865.
- Krosnick, J. A. (1991). “Response Strategies for Coping with the Cognitive Demands of Attitude Measures in Surveys.” Applied Cognitive Psychology 5 pp. 2113-236.
- Krosnick, J. A., Narayan, S., and Smith, W. R. (1996). “Satisficing in Surveys: Initial Evidence.” In Braveman, M. T. and Slater, J. K. (eds), Advances in Survey Research. San Francisco: Jossey-Bass.
- Krosnick, J. A., Holbrook A. L., Berent, M. K., Carson, R. T., Hanemann, W. M., Kopp, R. J., Mitchell, R. C., Presser, S., Ruud, P. A., Smith, V. K., Moody, W. R., Green, M. C. and Conaway, M. (2002). “The impact of “no opinion” response options on data quality. Non-attitude reduction or an invitation to satisfice?” Public Opinion Quarterly, 66 pp 371-403.
- Lugtig, P. and V. Toepoel (2016). “The Use of PCs, Smartphones, and Tablets in a Probability-Based Panel Survey: Effects on Survey Measurement Error”. Social Science Computer Review 34(1) pp. 78-94.
- Malhotra, N. (2008). “Completion Time and Response Order Effects in Web Surveys”, Public Opinion Quarterly, 72(5) pp. 914–934.
- Mavletova, A. (2013). “Data Quality in PC and Mobile Web Surveys.” Social Science Computer Review 31(6) pp. 725-743.
- Narayan, S. and Krosnick, J. A. (1996). “Education moderates some response effects in attitude measurement”, Public Opinion Quarterly, 60 pp. 58-88.
- de Rada, V. D., and Domínguez-Álvarez, J. A. (2014). ”Response quality of self-administered questionnaires: A comparison between paper and web questionnaires.” Social Science Computer Review, 32(2), pp. 256–269.
- Revilla, M. (2016). “Impact of raising awareness of respondents on the measurement quality in a web survey.” Quality and Quantity, 50, pp. 1469-1486.
- Revilla, M., Saris, W., Loewe, G. and Ochoa, C. (2015). “Can a non-probabilistic online panel achieve question quality similar to that of the European Social Survey?” International Journal of Market Research, 57(2), pp. 395-412.
- Roberts, C. E., Gilbert, E., Allum, N. and Eisner, L. (2019). “Research Synthesis. Satisficing in Surveys: A Systematic Review of the Literature.” Public Opinion Quarterly, 83(3) pp. 598-626.
- Roberts, C. E. (2016). Response Styles in Surveys: Understanding their Causes and Mitigating their Impact on Data Quality. In Wolf, C., Joye, D., Smith, T. W. and Fu, Y. (eds.). The SAGE Handbook of Survey Methodology (chapter 35). London: SAGE
- Roberts, C. E. (2007). “Mixing Modes of Data Collection in Surveys: A Methodological Review.” ESRC National Centre for Research Methods, NCRM Methods Review Papers, NCRM/008.
- Roberts, C., Jäckle, A. and Lynn, P. (2007). “Causes of Mode Effects: Separating out Interviewer and Stimulus Effects in Comparisons of Face-to-face and Telephone Surveys.” Proceedings of the Social Research Methods Section of the American Statistical Association.
- Roßmann, J. and Silber, H. (2020). Satisficing and Measurement Error. In Atkinson, P., Delamont, S., Cernat, A., Sakshaug, J. W., and Williams, R. A. (eds.) Measurement in Surveys. SAGE Publications Ltd.
- Roster, C. A., Rogers, R. D., Albaum, G. and Klein, D. (2004). “A Comparison of Response Characteristics from Web and Telephone Surveys.” International Journal of Market Research 46(3) pp. 359-73.
- Sax, L. J., Gilmartin, S. K. and Bryant, A. N. (2003). “Assessing Response Rates and Nonresponse Bias in Web and Paper Surveys.” Research in Higher Education 44(4) pp. 409-32.
- Schuman, H. and Presser, S. (1981). Questions and Answers in Attitude Surveys. New York: Academic.
- Shin, E., T.P. Johnson, and K. Rao (2012). “Survey Mode Effects on Data Quality: Comparison of Web and Mail Modes in a U.S. National Panel Survey.” Social Science Computer Review 30(2) pp. 212-228.
- Solomon, D. J. (2001). “Conducting Web-Based Surveys.” Practical Assessment, Research and Evaluation 7(19).
- Tourangeau, R., Conrad, F. G. and Couper, M. P. (2013). The Science of Web Surveys. Oxford: Oxford University Press.
- Tourangeau, R., Rips, L. J. and Rasinski, K. (2000). The Psychology of Survey Response. Cambridge: Cambridge University Press.
- West, B.T. and Blom, A.G. (2017). “Explaining Interviewer Effects: A Research Synthesis.” Journal of Survey Statistics and Methodology 5, pp.175-211.

