A review of protein quantitation assays and a survey about the protein assays based on formal publications.
Accurate protein quantitation is essential to protein studies in a multitude of research topics. A wide array of different methods have been developed to quantitate both complex mixtures of proteins as well as a single type of protein. Total protein quantitation methods comprise traditional methods such as the measurement of UV absorbance at 280 nm, Bicinchoninic acid (BCA) and Bradford assays, as well as alternative methods like Lowry or novel assays developed by commercial suppliers, which often provide a well-designed, convenient kit for each type of the assay. Individual protein quantitation methods include enzyme-linked immunosorbent assay (ELISA), western blot analysis, and more recently, mass spectrometry, among others. Accurate protein quantitation is essential to all experiments related to proteins studies in a multitude of research topics. Different A wide array of different methods have been developed to quantitate both complex mixtures of proteins in a given assay for total protein content and as well as for a single type of protein. Total protein quantitation methods comprise traditional methods such as the measurement of UV absorbance at 280 nm, Bicinchoninic acid (BCA) and Bradford assays, as well as alternative methods like Lowry or novel assays developed by commercial suppliers. Typically commercial suppliers which often provide a well-designed, convenient kit for each type of the assays. Individual protein quantitation methods include enzyme-linked immunosorbent assay (ELISA) assay, western blot analysis, and more recently, mass spectrometry, among others. In certain cases trade group regulations or laws may require specific methods for protein quantitation. For example, International Serum Industry Association (www.serumindustry.org), a trade group for serum providers, recommends the Biuret method for the determination of protein contents in serum products.
Here we discuss some of the common methods used to determine protein concentration in solution, highlighting their utilities and limitations. It is important to note that none of these protein assays is either specific to proteins, which means that non-protein components may interfere, or uniformly accurate and compatible with all proteins. Moreover, protein modifications can interfere with the estimation of protein concentration for some of the assays when compared to the unmodified protein [3, 4]. In addition some assays, for instance the 3-(4-carboxybenzoyl)quinoline-2-carboxaldehyde (CBQCA) assay are also effective when used to quantify surface-attached or encapsulated peptides or proteins [5].
Table 1 summarizes the common total protein quantitation assays. Less common ones, such as Pierce 660 from Thermo (catalog #22660) [6], NanoOrange protein quantitation [7], Qubit fluorometer [8], O-proparyl-Puromycin-based Protein Synthesis Assay kit for nascent proteins [9], are not discussed. It is important to evaluate the compatibility of each assay with sample types, assay range, sample volume, and the availability of a suitable spectrophotometer, as well as the time and cost.
| assay | absorption | mechanism | detection limit | advantages | disadvantages |
|---|---|---|---|---|---|
| UV absorption | 280 nm | tyrosine and tryptophan absorption | 0.1-100 ug/ml | small sample volume, rapid, low cost | incompatible with detergents and denaturating agents, high variability |
| Bicinchoninic acid | 562 nm | copper reduction (Cu2+ to Cu1+), BCA reaction with Cu1+ | 20-2000 ug/ml | compatible with detergents and denaturating agents, low variability | low or no compatibility with reducing agents |
| Bradford or Coomassie brilliant blue | 470 nm | complex formation between Coomassie brilliant blue dye and proteins | 20-2000 ug/ml | compatible with reducing agents, rapid | incompatible with detergents |
| Lowry | 750 nm | copper reduction by proteins, Folin-Ciocalteu reduction by the copper-protein complex | 10-1000 ug/ml | high sensitivity and precision | incompatible with detergents and reducing agents, long procedure |
Aromatic amino acids tyrosine and tryptophan give proteins their characteristic ultraviolet (UV) absorption at 280 nm, which is routinely used to estimate protein concentration. Phenylalanine and disulfide bonds also contribute to absorption at 280 nm, albeit slightly. This method is simple, and can be performed with extremely small sample volume, as little as 0.5 ul, since new spectrophotometers employ a sample retention system during the measurement. However, the protein sample must not contain any non-protein components with substantial absorption at 280 nm, such as nucleic acids contaminants [10]. For pure protein samples, the exact amino acid sequence of the analyzed protein must be known and an absorption coefficient specific to the particular protein must be calculated prior to determining the concentration of solution [11, 12]. This method is quickest, but error-prone and is incompatible with a broad array of protein extraction methods which frequently employ detergents and denaturing agents.
The bicinchoninic acid (BCA) assay was invented in 1985 by Paul K. Smith at Pierce Chemical Company, the major distributor of this assay [13]. Both BCA and Lowry assays are based on the conversion of Cu2+ to Cu1+ under alkaline conditions. This conversion is called the Biuret reaction (Figure 1) and is influenced by several amino acid residues (cysteine, cystine, tyrosine, and tryptophan) and the peptide backbone.
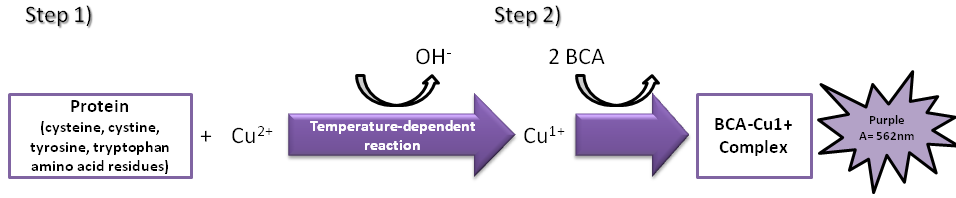
BCA is a specific chromogenic reagent for Cu1+ and in the second step of the reaction two BCA molecules react with one Cu1+ ion. The amount of Cu2+ reduced is a function of protein concentration that can be determined spectrophotometrically by a color change of the sample solution from blue into purple, which absorbs light at 562 nm. The absorbance is directly proportional to the amount of protein present in the solution and it can be estimated by comparison with a known protein standard, such as bovine serum albumin (BSA) [10, 14, 15]. Since BSA and the measured protein/peptide may have different chromophoric development, the protein/peptide amount should be adjusted. For example, Nortley R et al multipled the measured concentration of amyloid-beta peptides with the Pierce BCA protein assay kit and BSA as the standard by a factor of 1.51 [16].
The BCA assay is generally tolerant of ionic and nonionic detergents such as NP-40, Triton X-100 and denaturating agents like urea and guanidinium chloride that tend to interfere with other colorimetric protein assays such as Lowry (Table 2) [15]. However, some reagents, like ethylenediaminetetraacetic acid (EDTA) [17], reducing sugars [18, 19] and lipids [20], can interfere with the BCA assay. The effects of such interferences can be ameliorated by strategies such as reducing the interfering substances through dialysis, gel filtration or if the protein concentration is high enough, by diluting the sample. Reichelt et al proposed simple adjustments to the method that can lead to visible improvements in measurement accuracy, especially for unpurified protein in complex solutions like culture media [21]. They use a correction factor given by the measurement of an internal BSA protein spike added to each sample. Based on their studies the accuracy of the BCA protein quantification could be improved fivefold, making the accuracy of BCA quantitation comparable to that the more expensive approaches [21].
Another factor that interferes with the accuracy of the BCA assay is the presence of chemically modified residues in the protein. Brady and Macnaughtan evaluated the impact of lysyl methylation on the Bradford and BCA assays and found that for the BCA assay, the protein concentrations in the methylated protein samples were consistently overestimated [4].
| NP-40 | Sucrose |
| Emulgen | Glycine, pH 2.8 |
| HEPES | Glucose |
| DTT | EDTA |
| Triton X-100 | NaCl |
| Urea | NaOH |
| Guanidine HCl | Ammonium Sulfate |
| Sodium Acetate, pH 5.5 | SDS |
Thermo Fisher Pierce has a new version of the BCA Protein assay, called Pierce™ BCA Protein Assay Kit - Reducing Agent Compatible, that tolerates dithiothreitol (DTT), 2-mercaptoethanol (BME), TCEP and other disulfide reducing agents [22].
The BCA assay has a lot of advantages. Compared to other methods, the BCA assay is one of the most sensitive (it can detect proteins at concentrations as low as 5 ug/mL). It has less variability than others (i.e., Bradford assay), and it can be used to measure a wide range of protein concentration. Moreover, its sensitivity can be increased by performing the assay in the presence of plasmonic nanosensors as in the SPR-BCA (Surface Plasmon Resonance–BCA) assay proposed by Liu et al [23]. With this assay the limit of detection was 3.4 ng /ml and the general working range was 0.5 to 1000 μg /ml, thus lowering the protein concentrations that can be measured with the traditional BCA assay.
The Bradford assay, originally described by Dr. Marion Bradford in 1976, is a popular method to determine protein concentration. It relies on the formation of a complex between Coomassie brilliant blue G-250 dye and proteins in solution. The free dye exists in four different ionic forms. The more anionic blue form binds to proteins and has an absorbance at 595 nm (Figure 2). The protein concentration is determined by the amount of dye in the blue ionic form measured by the absorbance of the solution at 595 nm using a spectrophotometer [24]. The dye binds mostly to arginine, tryptophan, tyrosine, histidine, and phenylalanine residues [10].

Most researchers use BSA as the protein standard since it is inexpensive and easily available but it is not always suitable. Indeed, one disadvantage of using BSA is that it exhibits a strong dye response and may lead to under-estimating the protein concentrations of samples. This is not a problem if only relative concentrations of samples are needed. However, if a precise measure of protein concentration is necessary, immunoglobulin G (IgG), lysozyme, or other protein standard are often better choices, depending on the sample protein [24].
Among the advantages of the Bradford assay is the compatibility with reducing agents used to stabilize proteins in solution, which are not compatible with Lowry assay and to some extent not compatible with the BCA assay. Also, because the dye does not bind to peptides with low MW you can measure the concentrations of high molecular weight (MW) proteins in the presence of contaminating peptides [10, 24].
The main limitation of the Bradford assay is its incompatibility with most detergents, routinely used to solubilize membrane proteins. (Interestingly, however, very low levels of non-ionic detergent, such as Triton X-100, may improve sensitivity and variability of the Bradford assay [25] ). Detergents can be removed by gel filtration or dialysis, or through precipitation with calcium phosphate [24] or acetone. These methods can lead to sample dilution or sample loss, with the recovery of 70% or less of the initial protein amount. Cheng et al described a protein precipitation and Bradford assay-based method that allows for rapid protein quantitation, even when the protein solution contains interfering substances [26]. The method achieves an improved rate of protein recovery after only one-hour precipitation with acetone after the addition of sucrose, a component that does not interfere with the Bradford assay.
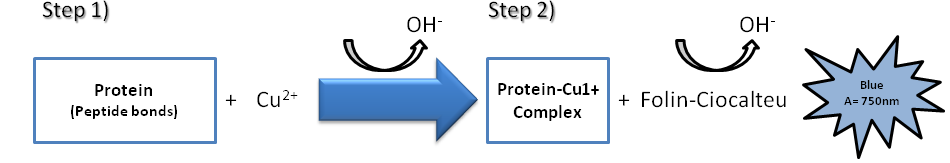
Lowry assay, proposed by Oliver H. Lowry in 1951, is based on two chemical reactions (Figure 3). The first reaction is the reduction of copper ions under alkaline conditions, which forms a complex with peptide bonds (the Biuret reaction discussed above). The second is the reduction of Folin-Ciocalteu reagent by the copper-peptide bond complex, which subsequently causes a color change of the solution into blue with an absorption in the range of 650 to 750 nm detectable with a spectrophotometer [10]. The amount of protein in the sample can be estimated using a standard curve of a selected standard protein solution such as BSA.
The advantages of this assay are its sensitivity, and most importantly, accuracy. However, it requires more time than other assays and many compounds commonly used in buffers for protein preparation (such as, detergents, carbohydrates, glycerol, Tricine, EDTA, Tris) interfere with the Lowry assay and form precipitates (Table 3) [10]. Nonetheless, the effect of these substances can be reduced by diluting out the sample, but only if the protein concentration is sufficiently high [27]. Moreover, it has been shown that the time to perform this assay can be reduced through raising temperatures or using a microwave oven [27].
| Detergents | Disulfide compound |
| Carbohydrates | Phenol |
| Glycerol | Uric acid |
| Tricine | Guanine |
| EDTA | Xanthine |
| Tris | Magnesium Calcium |
| Potassium compounds | Sulfhydryl compounds |
3-(4-carboxybenzoyl)quinoline-2-carboxaldehyde (CBQCA) is a sensitive fluorogenic reagent used for the detection of amines in proteins. Because it can detect only the accessible amines in the protein assayed, this method has the same limitations of spectrophotometric methods for which the outcome depends on the number of certain amino acids in the protein. However, CBQCA is very sensitive and can detect from 10 ng to 150 ug of protein in a 100 ul volume. Also on the positive side, the CBQCA reagent functions well in the presence of substances, such as lipids, known to interfere in many other protein determination methods [28], or when used to quantify surface-attached or encapsulated peptides or proteins [5].
A crucial step of many biomedical laboratory experiments is the quantitation of a specific protein in solution. Several techniques have been employed to accomplish that. The common ones of these quantitation methods are ELISA, western blot analysis, and mass spectrometry. ELISA and Western blot are discussed in Antibody Applications, mass spec is discussed here briefly, and is discussed at Labome review article Quantitative Bioanalysis of Proteins by Mass Spectrometry.
Protein mass spectrometry is a relatively new and developing method for protein quantitation. Besides protein characterization, an important step in the proteomic analysis is the possibility to quantify a specific protein. Many techniques have been introduced and implemented for protein quantitation by mass spectrometry. When protein labeling is possible, one protein or peptide sample is labeled with a stable heavier isotope (e.g., 13C or 15N) while a second sample (internal standard) is labeled with a lighter isotope (e.g., 12C or 14N). The samples are mixed and the mass differences due to the labels make it is possible to analyze the ratio of the two sample peak intensities by a mass analyzer, which corresponds to their relative abundance ratio. Alternative methods allow protein quantitation by mass spectrometry without labeling the samples [29].
Particularly exciting is the capacity to use mass spectrometry as a universal approach to performing both quantitative and qualitative assays in one measurement. For example, multiple MS-based methods developed for the quantitation of specific proteins in biological samples have been published recently. These include a method for the quantitation of the insulin-like growth factor 1 in serum [30], a method for the quantitation of albumin in urine [31], and of ubiquinone in serum/plasma [32]. Methods for quantitation of less specific target proteins can also be found in the recent literature [33-35]. Guidelines for targeted mass spectrometry measurements of peptides and proteins have been published [36] to try to ensure accurate and comparable methods in this rapidly developing approach. However, this method requires costly instrumentations that many laboratories cannot afford and this limits the utility of this approach [14, 37].

For mass spectrometric quantitation of proteins, internal peptide standards for several proteins can be concatenated to enable multiplex analysis of proteins (QCAT protein) [38]. An extension of this method was developed in which these concatenated peptides included antigenic epitopes for multiple antibodies. Concatenated calibration proteins termed DOSCATs (Double Standard conCATamers) can serve the needs for both mass spectrometry and western blot [39].
Protein expression can be monitored in living cells by genetically linking a protein of interest to a reporter protein or epitope, such as green fluorescent protein (GFP). Linking the protein of interest to the reporter with a particular cis-acting hydrolase element called a "Protein Quantitation Reporter" (PQR) [1] allows the protein and reporter to be transcribed together but translated as separate functional proteins. This can ensure stoichiometric expression of both the protein and the reporter; thus, the protein quantity can be inferred from the fluorescent intensity (Figure 4).

The limitations of quantitation methods discussed above have led to the development of new strategies for the determination of protein concentrations in simple and complex solutions. One of the most popular takes advantage of the optical properties of nanoparticles [40]. Briefly, the wavelength at which certain nanoparticles absorb light shifts due to binding other molecules or to aggregation [41]. Because the light absorption range is in the visible spectrum, this shift is perceived as a change in color. Nanoparticles have been so far used in conjunction to protein-binding particles, for example, antibodies, peptides or aptamers. Rogowski et al proposed a new type of nanoparticle sensor for the detection and quantification of proteins, which they called a “chemical nose” [42]. Their sensor consists of a mixture of gold nanoparticles with different shapes displaying differential aggregation when interacting with different proteins (Figure 5). Based on their light absorption spectra, the particles allow the detection and quantitation of purified proteins in aqueous solutions or unpurified proteins in complex solutions.

Kong et al developed a method using long DNA carrier molecules and solid-state glass nanopores to measure the concentration of proteins in solution in the nanomolar range [2]. In this method, DNA carrier molecules, able to bind proteins at specific locations, translocate through the nanopores with the help of an electric current. When translocating, the DNA causes a current drop signal. An additional drop is registered when a protein is attached to the DNA. The higher the protein concentration, the more “loaded” the carrier. The frequency of secondary current drop peaks also increases with increasing protein concentration (Figure 6).
Labome surveyed randomly selected peer-reviewed publications citing total protein assays. Thermo Fisher Pierce and Bio-Rad Laboratories are identified as the major suppliers of total protein assay kits (Table 4). The most commonly used methods are BCA and Bradford.
| Assay | Supplier | Num | Sample Reference |
|---|---|---|---|
| BCA / copper-based | |||
| Thermo Fisher | 132 | [43], A53227 [44], 23275 [45] | |
| MilliporeSigma | 8 | ||
| Beyotime | 2 | ||
| GE healthcare | 1 | 2-D quant [46] | |
| Bradford | |||
| Bio-Rad | 57 | [47, 48], 5000006 [49] | |
| Thermo Fisher Pierce | 11 | [50], 23200 [51] | |
| Sangon Biotech | 1 | C503041 [52] | |
| Expedeon | 1 | [53] | |
| Carl Roth | 1 | Roti-Nanoquant [54] | |
| Lowry / modified DC Assay | |||
| Bio-Rad | 17 | [55] | |
| MilliporeSigma | 1 | ||
| UV detection at 280 nm | |||
| Thermo Scientific (Nanodrop) | 3 | ||
Almost all BCA protein assays cited in the surveyed cohort were provided by Pierce, where one of the scientists invented the assay many years ago. Thermo Fisher purchased Pierce a number of years ago. Thermo Fisher Pierce BCA assays were used to study, for example, phase separation of proteasomes [56], Salmonella growth [57], Cox-2 and mPGES-1 expression in mouse bone marrow–derived dendritic cells [58], the effect of amyloid beta oligomers on pericytes and capillaries [16], the pathologic α-synuclein neurodegeneration in Parkinson’s disease [59] and others [60, 61]. Its Micro BCA protein assay kits were used to measure purified recombinant mutant tau [62].
MilliporeSigma BCA reagent and Bio-Rad BCA protein assay kit were cited as well.
Thermo Fisher Pierce is also one of the major suppliers of Bradford assay kits. Kapogiannis D et al measured the protein contents of exosome and plasma samples before western blot with a Bradford assay from Thermo Fisher (catalog: 23200) [51]. Bio-Rad Bradford protein assay reagents were used for measuring protein content in crude histone extracts (catalog: 5000006) [63], breast cancer cell lysates [48], and A549 cell lysates [49].
Other suppliers also provided the Bradford assay kits, for example, Carl Roth [54] and Expedeon [64].
The Pierce Lowry assay (catalogue number 23240) was used in [65] and Bio-Rad Laboratories Lowry assay was used in [66] and [67] for protein quantitation. Bio-Rad DC protein assay is a modified version of the Lowry assay. It is a popular protein assay, due to its compatibility with detergents. This assay was used to determine protein concentration to study the structure and function of human tetraspanin membrane protein CD81 [68] the effect of skeletal muscle-specific ablation of gamma(cyto)-actin on the mdx phenotype [65], among others [69, 70].
The best standard for protein quantitation is the same protein as the one being examined. However, this usually is not feasible. BSA (bovine serum albumin) is the most commonly used protein standard. It has limitations. It is more sensitive in Bradford assay than other proteins, thus the concentration of the protein sample is likely underestimated [71]. In addition, BSA, as a serum protein, cannot be prepared/obtained at very high purity, since it binds to many other factors. Other proteins, such as immunoglobulin G, and lysozyme have been used as protein standards as well. The best option in a given experiment can vary depending on both your protein(s) of interest and the quantitation method you choose.
No. It is very important that the sample data points fall within the standard curve range because the curve may vary unpredictably at higher or lower concentrations. The dilution of your samples and/or your standards should be adjusted to keep your samples within the standard curve.
- Noble J, Knight A, Reason A, Di Matola A, Bailey M. A comparison of protein quantitation assays for biopharmaceutical applications. Mol Biotechnol. 2007;37:99-111 pubmed
- Gill S, von Hippel P. Calculation of protein extinction coefficients from amino acid sequence data. Anal Biochem. 1989;182:319-26 pubmed
- Pace C, Vajdos F, Fee L, Grimsley G, Gray T. How to measure and predict the molar absorption coefficient of a protein. Protein Sci. 1995;4:2411-23 pubmed
- Thermo Scientific Pierce Protein Assay Technical Handbook. Available from: www.thermofisher.com/content/dam/LifeTech/Images/integration/1602063_PAssayHB_122910.pdf
- Smith P, Krohn R, Hermanson G, Mallia A, Gartner F, Provenzano M, et al. Measurement of protein using bicinchoninic acid. Anal Biochem. 1985;150:76-85 pubmed
- Walker J. The bicinchoninic acid (BCA) assay for protein quantitation. Methods Mol Biol. 1994;32:5-8 pubmed
- Wiechelman K, Braun R, Fitzpatrick J. Investigation of the bicinchoninic acid protein assay: identification of the groups responsible for color formation. Anal Biochem. 1988;175:231-7 pubmed
- Brown R, Jarvis K, Hyland K. Protein measurement using bicinchoninic acid: elimination of interfering substances. Anal Biochem. 1989;180:136-9 pubmed
- Redinbaugh M, Turley R. Adaptation of the bicinchoninic acid protein assay for use with microtiter plates and sucrose gradient fractions. Anal Biochem. 1986;153:267-71 pubmed
- Kessler R, Fanestil D. Interference by lipids in the determination of protein using bicinchoninic acid. Anal Biochem. 1986;159:138-42 pubmed
- Pierce™ BCA Protein Assay Kit - Reducing Agent Compatible. Available from: www.thermofisher.com/order/catalog/product/23250
- Kruger N. The Bradford method for protein quantitation. Methods Mol Biol. 1994;32:9-15 pubmed
- Friedenauer S, Berlet H. Sensitivity and variability of the Bradford protein assay in the presence of detergents. Anal Biochem. 1989;178:263-8 pubmed
- You W, Ryan D, Haugland R. 3-(4-Carboxybenzoyl)quinoline-2-carboxaldehyde, a reagent with broad dynamic range for the assay of proteins and lipoproteins in solution. Anal Biochem. 1997;244:277-82 pubmed
- Beynon R, Doherty M, Pratt J, Gaskell S. Multiplexed absolute quantification in proteomics using artificial QCAT proteins of concatenated signature peptides. Nat Methods. 2005;2:587-9 pubmed
- Jain P, Lee K, El Sayed I, El Sayed M. Calculated absorption and scattering properties of gold nanoparticles of different size, shape, and composition: applications in biological imaging and biomedicine. J Phys Chem B. 2006;110:7238-48 pubmed
- Leemput J, Masson C, Bigot K, Errachid A, Dansault A, Provost A, et al. ATM localization and gene expression in the adult mouse eye. Mol Vis. 2009;15:393-416 pubmed
- Stoscheck C. Quantitation of protein. Methods Enzymol. 1990;182:50-68 pubmed
- Materials and Methods [ISSN : 2329-5139] is a unique online journal with regularly updated review articles on laboratory materials and methods. If you are interested in contributing a manuscript or suggesting a topic, please leave us feedback.
- method
- Antibody Applications
- Aptamers and Affimers
- Current PCR Methods
- Identification of Ubiquitinated Proteins
- Incorporating Unnatural Amino Acids into Recombinant Proteins in Living Cells
- Protein Aggregates
- Protein Companies
- Protein Expression
- Protein/Peptide Tags
- Protein Purification
- Quantitative Bioanalysis of Proteins by Mass Spectrometry