GC-Mas Analysis and Estimation of Pomegranate Husks Extracts and Study the Biological Efficacy of Compound Tri-Butyl Acetyl Citrate as one of the Extracts Against Food Fungi
Alaa G. AL-Hashimi1, H. N. K. AL-Salman2 and Shaker A. N. Al-Jadaan2
1Food Science and Biotechnology Department, College of Agriculture, University of Basrah , Iraq.
2Pharmaceutical Chemistry Department, College of pharmacy, University of Basrah , Iraq.
Corresponding Author E-mail: hsennaserh@yahoo.com
DOI : http://dx.doi.org/10.13005/ojc/3404049
Article Received on : 14-05-2018
Article Accepted on : 26-06-2018
Article Published : 13 Aug 2018
Study of the biological efficiency of one of the (TBAC) compounds that isolated from the pomegranate husks extract. 200 gm dried pomegranate husks were extracted by a soxhlet and isolating seven compounds using a combination of organic solvents. Tri-butyl acetyl citrate (TBAC) was applied with the use of solvents such as methanol, chloroform, ethyl acetate and hexane. The extraction ratio was higher when using methanol and less on Chloroform. All the extracts prepared by the chromatographic mass spectrometer were analyzed to identify and characterize the chemical compounds present in the raw extract in both organic and aquatic layers. A number of internationally recognized detection methods were used to detect each type of extracted compounds. The biological efficacy of TBAC was investigated against food fungi by taking the highest concentration of the TBAC and less concentration of the compound. The study of the activity of inhibition fungal rot using the Potato-Dextrose Agar (PDA) culture medium. The TBAC has demonstrated excellent bioavailability against food fungi. The GC-Mas detection process showed the presence of seven compounds in the pomegranate husks extract. The same technique demonstrated the possibility of isolating TBAC compound using various solvents, its potential for inhibition evaluation and the study of its biological effect against food fungi. In the present investigation, seven active compounds have been identified from by GC-MS, one of this compounds as bioactive compound (TBAC) that probably use as against fungal rot. The presence of bioactive compounds in Pomegranate husks proved pharmaceutical importance. However, further studies will require to finding its bioactivity and toxicity profile.
KEYWORDS:Biological Efficacy of TBAC; Food Fungi; Pomegranate Husks Extracts
Download this article as:| Copy the following to cite this article: AL-Hashimi A. G, AL-Salman H. N. K, Al-Jadaan S. A. N. GC-Mas Analysis and Estimation of Pomegranate Husks Extracts and Study the Biological Efficacy of Compound Tri-Butyl Acetyl Citrate as one of the Extracts Against Food Fungi. Orient J Chem 2018;34(4). |
| Copy the following to cite this URL: AL-Hashimi A. G, AL-Salman H. N. K, Al-Jadaan S. A. N. GC-Mas Analysis and Estimation of Pomegranate Husks Extracts and Study the Biological Efficacy of Compound Tri-Butyl Acetyl Citrate as one of the Extracts Against Food Fungi. Orient J Chem 2018;34(4). Available from: http://www.orientjchem.org/?p=48305 |
Introduction
Pomegranate Scientific name Punica granatuml. It belongs to the Punicaceae family which contains one genus and two species P.proto-punica Balf is a small spread on the island of Socotra in the Republic of Yemen. The second type is Punica granatum. This tree was found in the Middle East in 5000 years age and it is believed that northern Iraq and Iran are the original native of pomegranate and because there is a national treasure of this shrub in Iraq and the possibility of preparation The study included the use of water extracts of pomegranate husks in the resistance of some pathogenic fungi, which were characterized by their production of Mycotoxin, a secondary metabolite that is exposed to agricultural products before and after harvest and during storage.1 Aspergillus flavns with its high ability to produce the most dangerous fungal toxins and presence on the surface of the ground ball Aflatoxin B1 is one of the most important compounds that have a significant role in the incidence of cancer diseases of most organisms that are exposed to the material carrying these compounds, while the fungus A.ochraceus is one of the most important Fungi that are able to produce Ochratoxin A poison on most substances and food media, causing “serious diseases of the organisms is primarily Nephrotoxic and affects the liver Heptatoxic and affected of the Aflatoxin B1; also causes the deformation of the embryos Teratogenic, a carcinogenic factor and activates the device Immunosuppressive, while Fusarium graminearum produces Zeralenon poison, which causes extensive damage to human and animal health and reduces the products of field animals of livestock and poultry and the seriousness of the fungi above, it is necessary to think about finding the best inhibitory or resistance to fungi producing toxins, so the study aimed to get the best Concentrations of pomegranate peel powder capable of inhibition of fungi under this study.2,3
All extraction compounds are lethal to various types of fungus , bitter plant poly-hydroxyl groups and phenols. The astringency from the alkane, aromatic hydroxyl carbon, fatty acid, and amides are that which causes the dry and pucker feeling in the mouth following the consumption of red pomegranates, strong tea, or an unripened figs fruit. the extract compounds from pomegranate husks are widely applied to any large poly-hydroxyl compounds as Tri-butyl acetyl citrate(TBAC) containing sufficient hydroxyls and other suitable groups (such as carboxyl) to form strong complexes with proteins and other macromolecules. pomegranate husks containing number of compounds that have molecular weights ranging from 500 to over 3000.
Polyhydric as Tri-butyl acetyl citrate (TBAC), glycols, hydrocarbon lipids, amides, alkanes, alkenes, tannins, ester, carbohydrates and phenols compounds are supplemented to various processed foods.4 They are also used as refining materials to precipitate amino acid and proteins in animals feed. As pomegranate husks especially Polyhydric, alkanes, tannins and derivatives carboxylic compounds often lower the absorption of some materials into the body.5 The maximum percentage of extract from pomegranate husks have Polyhydric, alkanes and tannins. Polyhydric compounds are also often known as anti-fungus, For example TBAC is found in pomegranate husks, tea and coffee and consuming too much of these pomegranate husks extract may lead to calcium and iron deficiency in the body. However, pomegranate husks extracts contains many compounds that are often effective against different types of fungi. These compounds are multi-hydroxyl such as TBAC.6,7
Materials and Methods
All solvents and reagents were of analytical grade unless indicated otherwise, and all experiments were performed with deionized water (18.2 Ω-cm) resistivity at 25°C8
Chemicals
Hexane for HPLC grade, BDH Chem. LTD.
Ethyl acetate, BDH Chem. LTD.
Ethanol and Methanol, BDH Chem. LTD.
Chloroform for HPLC grad. LTD.
PDA as culture medium, BDH Biochem. LTD.
Water was obtained by following purification in a deionized water system.
Collection of Materials
Pomegranate husks materials were collected of ripe pomegranate husks and washed from the soil with water. The crusts were then separated from the rest of the fruit. The crusts were placed on large filtration papers at room temperature. The crust was dried and grinded in a small electric mill. After the dry powder was obtained, Until they are used.9,10
Preparation of Pomegranate Husk Extracts
The method described globally was adopted by dissolving 200 g of pomegranate husk powder in 1 Liter of water. It was mixed well with an electric mixer and then placed in a shaker incubator at 24°C for 24 hours to increase the extraction ratio. When the filtrate was collected and concentrated in the rotary vacuum evaporator at a temperature of 40°C, the concentrated extract was placed in dishes with a large surface area. The remaining water was dried in an electric oven at a temperature of 40°C until the water completely evaporated and obtained Dry powder The powder is placed in tightly sealed containers and marked with PVC Net frozen in the heat of 18°C until use.11,12
Extraction Methods
The method extracted it from Pomegranate husks by two main steps with separator funnel, the first step by mix solvent Ethanol: Chloroform: Water (40:40:10 ). A number of organic compounds were obtained from the extraction process in the organic and aquatic layer, three compounds were obtained in organic layer are (1-Docosene, 2-piperidinone,N-[4-bromo-n-butyl]-,Eicosane) and four compounds in aquatic are (Tributylacetylcitrate TBAC,O-Veratramide, Methyl palmitate MP, Butanamide,N-decyl-N-methyl-).13,14
After isolating the two organic and water layers from each other, an isolation was done for the compound Tri-butyl acetyl citrate (TBAC) from the aquatic layer , being the compound to be studied biologically against different types of fungus. The Specific method for isolated and purified Tri-butyl acetyl citrate(TBAC)by isolating from aquatic layer with different solvent Methanol, chloroform, Ethyl acetate and Hexane each solvent separately using a modification of an existing procedure.15
Phytochemical screening of Pomegranate husks extracts
The pH value of the Pomegranate husks extract was determined by mixing 5 g of dried powder with 25 ml of distilled water and then the solution was filtered. The pH was measured by PH-Meter. After that, some qualitative chemical tests were conducted to determine some of the aggregates and active ingredients.16 The glycosides have been detected as follows:
Alkene (1-Decosene) have been detected using Nitrous reagent, similar amide (2-piperidinone,N-[4-bromo-n-butyl]-) measured at 260 nm with UV-Vis spectrophotometer against blank, alkane (Eicosane) was measured by using double beam UV-Vis spectrophotometer (UV) at fixed wavelength of 375 nm, polyhydric (Tri-butyl acetyl citrate TBAC) absorbance of the reaction mixture was measured at 410 nm with double beam UV-Vis spectrophotometer against blank, aromatic the hydroxyl-carbamide (O-Vertamide) was measured at 230 nm. The maximum wave length which was determined after scanning by itself instrument with double beam UV-Vis spectrophotometer against blank, fatty acid (Methyl palmitate MP) was measured at 310 nm The maximum wave length and The aliphatic amide (Butanamide, N-decyl-N-methyl-) was absorbance at 210 nm with UV-Vis spectrophotometer.17
Chemical Detection Results
The chemical detection results indicated the presence of seven active compounds in the organic layer and water layer that extract from pomegranate husks. Four hydrolysis compounds are (TBAC tributylacetylcitrate), (O-Veratramide), (MP Methyl palmitate), (Butanamide,N-decyl-N-methyl-) and three organic extracts are (1-Docosene), (2-piperidinone, N-[4-bromo-n-butyl]-), (Ecosane). The results of the analyzes were agreed with the GC-Ms spectra and the diagnostic findings of the UV spectrum.
Determination of 1-Docosene18
Nitrous reagent was used to determine the 1-Docoseneof the various organic crude extracts.1-Docosene was used as a reference standard (10-50 μg/mL) for plotting calibration curve. A volume of 1.0 mL of the plant extract (50 μg/ mL) was mixed with 1.0 mL of Nitrous reagent (diluted 1:10 with deionized water) and were neutralized with 3 mL of HNO3 (1 % w/v) + Two drops from Br2 solution. The reaction mixture was kept in dark at room temperature for 1 hour with intermittent shaking. The absorbance of the resulting nutty dark color was measured by using double beam UV–Vis spectrophotometer (UV) at fixed wavelength of 254 nm. The TPCs were determined using linear regression equation obtained from the standard plot of 1-Docosene, This compound was calculated as mean SD (n=3) and expressed as mg/g 1-Docosene equivalent of dry extract.
Determination of similar amide 2-piperidinone,N-[4-bromo-n-butyl]-19
By standard solution of 2-piperidinone,N-[4-bromo-n-butyl]-, the Directly measurement to plant extracts (1.0.mL) of different concentration (2.0, 4.0, 6.0, 8.0. and 10.0) µg/ml from 0.1 mL sample. The absorbance of the 2-piperidinone,N-[4-bromo-n-butyl]-was measured at 260 nm with double beam UV–Vis spectrophotometer against blank (deionized water). The amount of 2-piperidinone,N-[4-bromo-n-butyl]- was calculated from linear regression equation obtained from the quercetin calibration. The TPCs were determined using linear regression equation obtained from the standard plot of 2-piperidinone,N-[4-bromo-n-butyl]-. This compound was calculated as mean SD (n=3) and expressed as mg/g 2-piperidinone,N-[4-bromo-n-butyl]-equivalent of dry extract.
Determination of Eicosane20
Nitrous reagent was used to determine the Eicosane the various organic crude extracts[].Eicosane was used as a reference standard (10-50 μg/mL) for plotting calibration curve. A volume of 1.0 mL of the plant extract (50 μg/ mL) was mixed with 1.0 mL of Nitrous reagent (diluted 1:10 with deionized water) and were neutralized with 3 mL of HNO3 (1 % w/v) without bromination The reaction mixture was kept in dark at room temperature for 1 hour with intermittent shaking. The absorbance of the resulting light yellow color was measured by using double beam UV–Vis spectrophotometer (UV) at fixed wavelength of 375 nm. The TPCs were determined using linear regression equation obtained from the standard plot of Eicosane, This compound was calculated as mean SD (n=3) and expressed as mg/g Eicosane equivalent of dry extract.
Determination of Tri-butyl acetyl citrate(TBAC)21
TBAC in crude extracts was determined by the reported procedure and plant extracts was used as a standard to construct the calibration curve. Briefly 10 mg of plant extracts was dissolved in 80% ethanol and then diluted to 10, 20, 30, 40 and 50 μg/mL. The diluted standard solutions of plant extracts (1.0.mL) of different concentration were separately mixed with 1.0 ml of 99 % ethanol, 0.1 mL of 10 % aluminum chloride, 0.1 mL of 1 mol/L potassium acetate and 3.0 mL of deionized water in a test tube. The test tubes were incubated for 1 hour at room temperature to complete the reaction. The absorbance of the reaction mixture was measured at 410 nm with double beam UV–Vis spectrophotometer against blank. A typical blank solution contained all reagents except ferric chloride which is replaced by the same amount of deionized water. The amount of TBAC was calculated from linear regression equation obtained from the extract plant calibration. The TPCs were determined using linear regression equation obtained from the standard plot of TBAC, This compound was calculated as mean SD (n=3) and expressed as mg/g TBAC equivalent of dry extract.
Determination of O-Vertamide (2,3-dimethoxy-6-methylbenzamide)22
By standard solution of O-Vertamide, the Directly measurement to plant extracts (1.0.mL) of different concentration (0.1, 0.2, 0.3, 0.4 and 0.5)µg/ml from 0.1 mL sample. The absorbance of the O-Vertamide was measured at 230 nm. The maximum wave length which was determined after scanning by itself instrument with double beam UV-Vis spectrophotometer against blank (deionized water). The amount of O-Vertamide was calculated from linear regression equation obtained from the quercetin calibration. The TPCs were determined using linear regression equation obtained from the standard plot of O-Vertamide, This compound was calculated as mean SD (n=3) and expressed as mg/g O-Vertamide equivalent of dry extract. O-Vertamide his chemical structure is not currently classified in our databases, also identifying information including synonyms, ID numbers, use types chemical classification, We do not have full information on this chemical. The molar mass does not indicate its composition precisely because of this compound react with fragments are generated by cracking the same compound block by heat dissipation of GC-Mas device, therefore, the maternal mass is shown at 281.
Determination of Methyl Palmitate(MP)23
By standard solution of MP, the Directly measurement to plant extracts (1.0.mL) of different concentration (5, 10, 15, 20 and 25)µg/ml from 0.1 mL sample. The absorbance of the MP was measured at 310 nm The maximum wave length which was determined after scanning by itself instrument with double beam UV-Vis spectrophotometer against blank (deionized water) The amount of MP was calculated from linear regression equation obtained from the calibration curve. The TPCs were determined using linearity equation obtained from the standard plot of MP, This compound was calculated SD (n=3) and expressed as mg/g MP equivalent of dry extract.
Determination of Butanamide, N-decyl-N-methyl-24
By standard solution of Butanamide, N-decyl-N-methyl-, the Directly measurement to plant extracts (1.0.mL) of different concentration (1, 2, 3, 4 and 5)µg/ml from 0.1 mL sample. The absorbance of the Butanamide, N-decyl-N-methyl-was measured at 210 nm. The maximum wave length which was determined after scanning by itself instrument with double beam UV–Vis spectrophotometer against blank (deionized water). The amount of Butanamide, N-decyl-N-methyl- was calculated from linear regression equation obtained from the quercetin calibration. The TPCs were determined using linear regression equation obtained from the standard plot of Butanamide, N-decyl-N-methyl-, This compound was calculated as mean SD (n=3) and expressed as mg/g Butanamide, N-decyl-N-methyl- equivalent of dry extract.
GC-Mass Analysis
In general, studies demonstrate that all extract compounds can be analyzed more precisely by applying GC-MS technique (Gas Chromatography-mass, MSDCHEM\1\METHODS\MUAFAQ.M) for the determination of (M/Z Negative Ions). The fragments allow for easy identification by Mass Spectrum. To shorten the overall GC analysis time of these compounds, a short, narrow bore column such as the 30 mm × 0.250 µm I.D. × 0.25 μm, SS., Inlet He is recommended. The optimum conditions for the separation and diagnosis of all extract compounds mentioned in Table 1.
Chemical Composition of Extracts by GC-MS Analysis
The Compounds were studied through GC-Mass (Table 1) to create the molecular ion for each extract compound and it was found that the molecular ion is equal to formula weight minus one or more diagrams that confirm the all compounds molecules weight which give a good indication for the isolation and identification of extract compounds.25
Table 1: Data analysis parameters for separation and specific determination of microcrystalline Narcotic substances in GC-Mass spectrum.
| Column | HP-5MS, 5% Phenyl methyl Sillox(1629.5), |
| 30 m × 0.250 µm I.D. x 0.25 μm, SS., Inlet He | |
| EMV mode | Gain Factor (1.00) |
| Resulting EM Voltage | 1306 |
| Low Mass | 28 |
| High Mass | 441 |
| Threshold | 150 |
| Minimum Quality for all Narcotics | % (97-90) |
| Flow Rate | ml/min 1 |
| Run time | 24 min |
| Hold up Time | 1.5388 min |
| Solvent Delay | 3.00 min |
| Average velocity | 36.796 cm/sec |
| Temperature | Initial 70 oC to Maximum 375 oC |
| Pressure | 8.81 Psi |
Data Analysis
Data analysis are expressed as mean ±SD. Student’s t-test and One way ANOVA were applicable and used to analyze level of statistical significance between groups. P<0.05 were considered statistically significant.
Results
Various Extract Compounds
A number of biologically active compounds obtained from the organic and aquatic layers in the pomegranate husk extraction shown in Table 2 and figure 1. The process using different solvents. The highly effective TBAC was obtained biologically and biologically tested for this compound on fungal colonies.
Table 2: Various extract compounds in organic and aquatic layers.
| phase | 1-Docosene | 2-piperidinone,N-[4-bromo-n-butyl]- | Eicosane | Tri-butyl acetyl citrate (TBAC) | O-Vertamide | Methyl palmitate (MP) | Butanamide, N-decyl-N-methyl- |
| organic layer | + | + | + | – | – | – | – |
| aquatic layer | – | – | – | + | + | + | + |
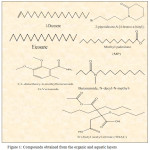 |
Figure 1: Compounds obtained from the organic and aquatic layers. Click here to View figure |
Percentage Yield of Crude Extracts
Approximately, 40 g (20 %) dry mass for all component extract compounds were obtained from extraction 200 g pomegranate husks powder after 16 h of continuous hot extraction in Soxhlet extractor by using ethanol solvent. Upon Kupchan’s partitioning method of crude alcoholic extract,26 different amounts of hexane, chloroform, ethyl acetate and methanol obtained are shown in Table 3.
Table 3: Amount and % yield of organic and aqua extracts from pomegranate husks.
| Extract | Amount (g) | Yield (w/w) % |
| Methanol | 22 | 55 |
| Chloroform | 1.5 | 3.7 |
| Ethyl acetate | 3.5 | 8.7 |
| Hexane | 13 | 32.5 |
TBAC Crude
The TBAC Crude extract is calculated using the following linear regression equation obtained from the standard plot of TBAC:
y=0.014x+0.050, R2=0.9998
Where y is absorbance and x is the amount of TBAC in μg.
The Crude extract of TBAC in Methanol, Chloroform, Ethyl acetate and Hexane, were 94±2.3,82.53±1.65, 74.26±3.70 and 88.56±3.53 respectively and the P value was considered (P ˂ 0.001).
Methanol extract was found to contain the highest amount of TBAC compounds followed by chloroform, ethyl acetate and Hexane. However, little quantity TBAC compounds were detected in Ethyl acetate extract. A significant difference in the aqua layer contents of different extracts was observed by ANOVA single factor test.
Fungus Isolates Used in the Study
The effect of the TBAC (Tributylacetylcitrate) extracted from pomegranate husks was studied on the growth of the fungus: Aspergillus flavus, Fusarium moniliforme and A.Ochracus fungus found in food specially in humid places, which cause foul odors due to corruption from their analysis of food as well as toxins cause.
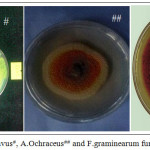 |
Figure 2: A.flavus#, A.Ochraceus## and F.graminearum fungus### Click here to View figure |
Study Effect of the Compound (tbac) on Experimental Fungus and Determination of the least Inhibitory and Deadly Concentration of Fungus
The efficacy of the compound (TBAC) on the radial growth of fungal pathogens in the method of food Poisoned in food Technique was studied. The following concentrations of the compound (TBAC) were included (30, 20, 10, 5, 2.5, 1.25, 0.65) µg/ ml where it was taken (2, 1, 0.5, 0.1, 0.05, 0.01, 0.005) ml of the compound (TBAC) by micropipette and add it to the prepared PDA medium prepared, sterilizer and coolant to 45°C in sterile conditions and with the following volumes: (0, 99.90, 99.95, 99.99, 99.995, 99.999, 1.0) ml of PDA and after good well mixing “pour in an integrated of sterile Petri-dishes with diameter of 9 cm, after hardening the center containing the essential oil to rude each dish with a piece of fungal colony with diameter 0.5 cm Age 7 days for each of the fungus after 5-7 days in the lap of a temperature of 25oC and at the arrival of diameter treatment comparison (center nutrient-free extract) to a greater extent towards the dish, after that calculated the inhibition of fungal growth percentage as in the following equation27:
(Percentage of inhibition)=[(growth rate of fungal in the control sample – growth rate of fungal in the treatment) Division (growth rate of fungal in the control sample)] ×100
Results
The results of the statistical analysis shown in Table (4) and Figure (3) indicate that the highest percentage of inhibition of the radial growth of fungi was recorded in 30 ml concentration of 60.1 % , 49.5% and 45.8% respectively in A.flavus, F.graminearum and A.Ochraceus respectively, while the lowest percentage of inhibition with a concentration of 0.05 ml with 1.2 % and 2.5 % and 3.3 % for A.flavus, A.Ochraceus and F.graminearum respectively.
Table 4: The percentage of inhibition of fungus growth using different volumes of TBAC compound.
| Volumes (ml) of TBAC | Percentage of inhibition % (Mean± SD) | ||
| Fusarium | Aspergillus | Aspergillus | |
| graminearum | ochraceus | flavus | |
| 2 | 49.5± 0.2 | 45.8± 0.2 | 60.1± 0.2 |
| 1 | 37.4± 0.1 | 32.0± 0.1 | 45.0± 0.1 |
| 0.5 | 26.1± 0.1 | 22.9± 0.2 | 35.6± 0.2 |
| 0.1 | 21.1± 0.1 | 18.0± 0.3 | 27.4± 0.2 |
| 0.05 | 12.6± 0.1 | 8.1± 0.2 | 12.0± 0.1 |
| 0.01 | 9.8± 0.1 | 5.9± 0.2 | 6.5± 0.2 |
| 0.005 | 3.3± 0.2 | 2.5± 0.2 | 1.2± 0.1 |
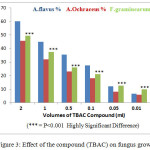 |
Figure 3: Effect of the compound (TBAC) on fungus growth.
|
Table 4. shows The statistical Analysis was done by SPSS program using Analysis of variance (ANOVA) to describe tests between subject factors and between groups of fungi. The results were: high significant difference (p< 0.001) among the concentrations of TBAC used high significant difference (p < 0.001) for interference of TBAC, and a highly significant difference (p < 0.001) among fungi used. (ANOVA tables are enclosed as appendices).
Discussion
All methods in procedure have been successfully applied to the determination and identification of seven organic compounds in organic and aqua layers, but the TBAC is further identified. Identification of extract compounds Via Gas chromatography-mass spectrometry (MSDCHEM\1\METHODS\MUAFAQ.M). The extract compounds were study through GC-MS to create the molecular ion for the compounds and found it equal to number mass for each one in chart figures that confirmed the present seven organic compounds. These results suggest good indication for isolation and identification for all compounds.28
The study demonstrates that the proper extract of TBAC can be easy analyzed by GC-MS, also; the fragments allowing for sensitive identification by GC-Mass Spectrum.
The polyhydric compound (Containing more than one hydroxyl group) as TBAC that extracts from pomegranate husks were used for the experimental study of inhibiting effect and lethal concentration on toxin producing fungi, since it was found to contain the highest extracted amount of TBAC. The 2.0 ml (30μg / ml) TBAC concentration resulted in the extremely significant inhibition (60.2%) of the radial growth of the fungus A.flavus observed experimentally in comparison to the other species A.cochraceus (45.8%), which may be due to its sensitivity to TBAC compound. In comparison, the genus F.graminearum shown resistance to TBAC compound with high significant inhibition (49.5%). The volumes of (0.05 ml, 0.01 ml, and 0.005 ml) of TBAC compound used on fungus F.graminearum caused significantly significant value inhibition effects of 12.7%, 9.8%, and 3.3% respectably which was higher than that for both other fungi A.flavus (12%, 6.5%, 1.2%) and for fungal A.cochraceus (8%, 5.9%, 2.5%). These results are consistent with the indicated high efficiency of the compound (TBAC) of pomegranate husks in the reduction of fungi29 in general with the inhibition of A.flavus, A.Ochraceus and F.graminearum fungi as indicated by the chemical results of compounds (Table 4). The composition of the extract contains several active compounds whose biological activity is being investigated for subsequent studies.
Funding of Research
The research was funded by the authors themselves.
Conflict of Interest
There is no conflict of interest.
Acknowledgements
The authors would like to thank Dr. Daoud Glob-Clinical and Clinical Analysis Branch/College of Pharmacy/University of Basrah for biological activity tests. The authors are also grateful to the chemical Mofigg head of chemical laboratory central to estimated extract compounds by GC–Ms analysis. This work was supported by the Food Science and Biotechnology Department, College of Agriculture/University of Basrah and the Department of Pharmaceutical chemistry, pharmacy College/University of Basrah.
References
- Dhakar, R.C.; Maurya, S.D.; Pooniya, B.K.; Bairwa, N.; Gupta, M. Chron. Young Sci., 2011, 2, 119-125.
CrossRef - Oluduro, A.O. J. Microbiol, 2012, 8, 59-67.
- Osman HE, Abohassan AA. Inter J. Theor. Appl. Sci., 2012, 4,174-184.
- Hanif, M.A.; Al-Maskri, A.Y.; Al-Mahruqi, Z.M.; Al-Sabahi, J.N.; Al-Azkawi, A.; Al-Maskari, M.Y. Nat. Prod. Commun. 2011, 6,1451-1454.
- Kumbhare M.R.; Guleha, V.; Sivakumar, T. Asian Pac. J. Trop. Dis. 2012, 2, 144-150.
CrossRef - Ifeson, B.O.T.; Fashakin, J.F.; Ebosele, F.; Oyerinde A.S. European J. Med. Plants 2013, 3, 465-473.
CrossRef - Jitendra, Patel; Venkateshwar; Reddy, G. S.; Kumar, D.; Satyasai, B. International J. Green Pharmacy 2017,11, 140-143.
- Waheed, I.; Ahmed, M.; Syed, N.H.; Ashraf, R. Indian J. Pharm. Sci. 2014, 76, 251-256.
- Mushtaq, M.Y.; Choi, Y.H.; Verpoorte, R.; Wilson, E.G. Anal. PCA, 2014, 25, 291-306.
- Yang, C.; Wang, J.; Li, D. A review. Anal. Chim. Acta 2013, 799, 8-22.
CrossRef - El-Alfy, T.S.; Ezzat, S.M.; Hegazy, A.K.; Amer, A.M.; Kamel, G.M. Egypt. Pharmacogn Mag. 2011, 7, 109-115.
- Dehshahri, S.; Wink, M.; Afsharypuor, S.; Asghari, G.; Mohagheghzadeh, A. Fiori. Res Pharm Sci 2012, 7, 111-118.
- Abdel-Rahman; Tahany, M.A.; Hegazy, A.K.; Sayed, A.M.; Kabiel, H.F.; El-Alfy, T.; El-Komy, S.M. J. Yeast Fungal Res. 2010, 1,15-24.
- Zenkevich, I.G.; Ostroukhova, O.K.; Dolzhenko, V.I. J. Anal. Chem. 2002, 57, 1, 35-39.
CrossRef - Muhit, M.A.; Tareq, S.M; Apu, A.S; Basak, D. Bangladesh Pharm. J. 2010, 13, 49-53
- Kawaguchi, M.; Ito, R.; Nakazawa, H.; Takatsu, A. Anal. Chem. 2013, 45, 280-293.
- Cevallos-Cevallos, J.M.; Garcia-Torres, R.; Etxeberria, E.; Reyes-De-Corcuera, J.I. Phytochem. Anal. 2011, 22, 236-246.
CrossRef - Popov, I.V.; Andreeva, I.N.; Gavrilin, M.V. Pharmaceutical Chemistry J. 2003, 37, 24-26.
CrossRef - Justesen, U.; Knuthsen, P.; Leth, T. Cancer Lett. 1997, 114, 165-167.
CrossRef - Komarova, A.S; ChermenskayaEmail, T.D.; Chelovechkova, V.V. J. Analytical Chemistry 2017, 72, 1076-1081.
CrossRef - Farajzadeh, M.A.; Nouri, N.; Khorram, P. Trac Trends Anal. Chem. 2014, 55, 14-23.
CrossRef - Martinez, G.; Morales, A.; Maestro, A.; Cermenj, S.; Oliva, J.; Barba, A. J. AOAC Int. 2015, 98, 6, 1745-1751.
CrossRef - Hu, M.; Liu, X.; Dong, F.; Xu, J.; Li, S.; Xu, H.; Zheng, Y. Food Chem. 2015, 175, 395-400.
CrossRef - Do, J.-A.; Kwon, J.-E.; Lee, E.-M.; Kim, M.-R.; Kuk, J.-H.; Cho, Y.-J.; Kang, I.-H.; Kim, H.-S.; Kwon, K.; Oh, J.-H. Korean J. Food Sci. Technol. 2013, 45, 3, 285-292.
CrossRef - Jens Rohloff Molecules 2015, 20, 3431-3462.
- Alhakmani, F.; Kumar, S.; Khan, S.A. Asian Pac. J. Trop Biomed 2013, 3, 623-627.
CrossRef - Jeyaseelan, E.C.; Jashothan, P.T. Asian Pac. J. Trop Biomed 2012, 2, 717-721.
CrossRef - Mooza Al-Owaisi; Nora Al-Hadiw;, Shah Alam Khan Asian Pac. J. Trop Biomed 2014, 4, 964-970.
- Gu, R.; Wang, Y.; Long, B.; Kennelly, E.; Wu, S.; Liu, B.; et al. Biol. Pharm. Bull 2014, 37, 903-915.
CrossRef

This work is licensed under a Creative Commons Attribution 4.0 International License.
![]()
A New Edition of Web of Science
Journal Impact Factor
2022: 0.5
Five Year: 0.8
Journal is Indexed in

Cabells Whitelist
![]()


