Application of Water Quality Index for Assessment of Surface Water Quality Status in Goa
Gurdeep Singh1 * and Rakesh Kant Kamal2
1
Vinoba Bhave University,
Hazaribagh,
825301
Jharkhand
India
2
Department of Environmental Science and Engineering,
Indian School of Mines,
Dhanbad,
826004
Jharkhand
India
http://dx.doi.org/10.12944/CWE.9.3.54
Copy the following to cite this article:
Singh G, Kamal R. K. Application of Water Quality Index for Assessment of Surface Water Quality Status in Goa. Curr World Environ 2014;9 (3) DOI:http://dx.doi.org/10.12944/CWE.9.3.54
Copy the following to cite this URL:
Singh G, Kamal R. K. Application of Water Quality Index for Assessment of Surface Water Quality Status in Goa. Curr World Environ 2014;9(3). Available from: http://www.cwejournal.org/?p=7777
Download article (pdf) Citation Manager Publish History
Water is addressed as a necessary resource and life preservative. It is required for most human activities like – drinking, cooking bathing, washing, agriculture, industry, recreation, navigation and fisheries etc. About 75% of the world’s surface area is covered with water. Out of which 97% of the earth’s water is in the ocean, not fit for human use due to its high salt content. Remaining 2% is locked in polar ice caps and only 1% is available as fresh water in rivers, lakes, streams reservoirs and ground water, suitable for human consumption. Now-a-day, water quality issues have become a significant concern due to the growth of population, urban expansion and technological development. Water can be easily contaminated in different ways through unregulated or regulated but not well designed and monitored disposal practices. In India’s case, the future is a bit more-worse, since we have only 2.45% of the word’s landmass supporting 16% of the world’s population and our freshwater resource does not exceeding 4% of the global water resources (Kumar 2005). Apart from availability, continuous water pollution due to disposal of sewage, industrial and mining wastes also threatens to reduce the available quantity of usable water and more and more of our ground and surface water resources including lakes, ponds and rivers are being categorized as polluted (Subramanian et al. 2000; Mohan et al 2000; Kumaresan et al. 2006; Singh et al. 2007; Singh et al. 2013). Access to safe drinking water remains an urgent necessity, as 30 % of urban and 90 % of the rural Indian population still depends completely on untreated surface or groundwater resources (Kumar et al. 2005).Access to drinking water in India has increased over the past few decades with the tremendous adverse impact of unsafe water for health (Singh et al. 2013).Scarcity of clean and potable drinking water has emerged in recent years as one of the most serious developmental issues in many parts of West Bengal, Jharkhand, Orissa, Western Uttar Pradesh, Andhra Pradesh, Rajasthan and Punjab (Tiwari and Singh 2014).
Water quality index (WQI) is defined as a technique of rating that provides the composite influence of individual water quality parameter on the overall quality of water (Singh et al. 2013). Water Quality Index, a technique of rating water quality, is an effective tool to assess quality and ensure sustainable safe use of water for drinking (Tiwari et al. 2014). Water quality index is one of the most effective tools to communicate information on the quality of any water body (Rizwan and Gurdeep 2010).WQI is an a superior way to the understanding of water quality issues by integrating complex data and generating a score, which ultimately describes the water quality status (Tiwari et al. 1985; Singh, D. F. 1992; Rao, S.N; 1997; Mishra et al. 2001). One of the major advantages of WQI is that, it incorporates data from multiple water quality parameters into a mathematical equation that rates the health of water quality with number (Yogedra and Puttaiah 2008).
Mining is one of the major activities causing water pollution and threatens the quality surface water. Water pollution in mining areas is mainly due to overburden (OB) dumps, surface impoundments, mine water, industrial effluents, acid mine drainage, tailing ponds etc. (Singh et al. 2013). River and other streams are not far from the mining industries and it contaminate continuously from point as well as non-point source. Waste generation due to the operation and expansion of mining and industrial activity in Goa is going to be a serious negative impact on the water resource in near future. The problems of water quality degradation and its adverse impacts on availability of potable and irrigation water, soil quality and agricultural productivity, and biodiversity in the area have been attracting increasing attention of people. The aim of this study is to assess the quality of surface water for the suitability of drinking and domestic purpose in Goa mining region. Study Area Goa is the 25th State of India, attaining statehood in May 1987.It lies between the latitudes 14°53'54" N & 15°40'00" N and longitudes 73°40'33" E & 74°20'13" E with geographical area of 3,702 km2 and coastline of 105 km. The study area comprises of 5 mining Talukas namely Bicholim, Sattari, Dharbandora, Quepem and Sanguem encompassing an area of 1513 km2. Study area entails all the areas wherein mining activities of Goa are encompassed along with a belt of five km from the lease boundary (Fig 1).
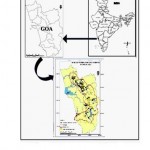 |
Figure 1: Sampling location map of the Goa Mining. Click here to View figure |
Materials and Methods
The water samples were collected from thirty six (36) different locations in all two seasons, Pre-monsoon post-monsoon season. Sampling locations were selected on the basis of different land use pattern (agricultural, mining, residential and barren etc.). Care was taken to collect subsequent samples from same location in all season. The Samples were taken from 10 to 15cm below the water surface using acid washed plastic container to avoid unpredictable changes in characteristic as per standard procedures (APHA, 2005). Details of sampling locations along with their latitude and longitude are illustrated in (table 4).
Water Quality Index
WQI’s aim at giving a single value to the Water quality of a source reducing great amount of parameters into a simpler expression and enabling easy interpretation of monitoring data (Singh et al. 2013).Water Quality Index (WQI) is a technique of rating that provides the composite influence of individual parameter on the overall quality of water. WQI a well known method as well as one of the most effective tools to express water quality that offers a simple, stable, reproducible unit of measure and communicate information about water quality to the policy makers and concerned citizens (Singh et al. 2013). The weights for various water quality parameters are assumed to be inversely proportional to the recommended standards for the corresponding parameters. One of the major advantages of WQI is that, it incorporates data from multiple water quality parameters into a mathematical equation that rates the health of water quality with number (Brown et al. 1970). In this study for the calculation of water quality index, twelve important parameters were chosen. The WQI has been calculated by using the standards of drinking water quality recommended by the World Health Organization (WHO), Bureau of Indian Standards (BIS), and Indian Council for Medical Research (ICMR).The weighted Arithmetic index method has been used for the calculation of WQI of the water body. Further quality rating or sub index was calculated using the following expression.
qn = 100 (Vn - Vio)/ (Sn - Vio) (1)
(Let there be n water parameter and quality rating or sub index (qn) corresponding to nth parameter is a number reflecting the relative value of this parameter in the polluted water with respect to its standard permissible value)
qn = Quality rating for the nth water quality parameter
Vn = Estimated value of the nth parameter at a given sampling station
Sn = Standard permissible value of the nth parameter
Vn = Ideal value of nth parameter in pure water. (i.e., 0 for all other parameter except the parameter pH and Dissolved oxygen (7.0 and 14.6 mg/l respectively)
Unit weight was calculated by a value inversely proportional to the recommended standard value Snof the corresponding parameter.
Wn = K/Sn (ii)
where Wn= Unit weight for the nth parameters,
Sn= Standard value for nth parameters,
K = Constant for proportionality.
The overall water quality index was calculated by aggregating the quality rating with the unit weight linearly:
WQI = Σqn Wn/ ΣWn (iii)
Different levels of water quality index and their respective water quality status were given in Table-1. Various parameters and their unit weight were calculated and summarized in Table -2 with their standards and recommended agencies.
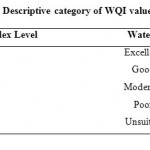 |
Table 1 : Descriptive category of WQI values Click here to View table |
Results and Discussion
The World Health Organization (WHO), Bureau of Indian Standards (BIS), and Indian Council for Medical Research (ICMR) for the drinking water together with its corresponding status categories of WQI are given in Tables 1, Table 2, Table 3 and Table 4, respectively. The WQI of water samples were found in the range of 34 to 83 in post monsoon, 28 to 81 in winter, 34 to 86 in summer and 23 to 107 in monsoon season. The WQI for all samples were found in the range of 34 to 107. Almost 94% of the total water samples were found in range of good and medium except SW2 and SW35 which were found to be in poor categories. Out of 36 water samples only two (6%) were found within poor category, it is due to transportation of iron ore and mining activities. Huge overburden dumps are piled in and around mining areas were suffered during monsoon seasons due to leaching. Among all the of the water samples, the percentage (%) of WQI categories Good (47.22%), Moderate (47.22) and Poor (5.56%) were observed in all four the seasons (Fig. 2).
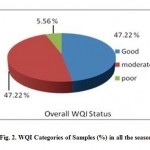 |
Figure 2: WQI Categories of Samples (%) in all the seasons Click here to View figure |
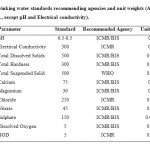 |
Table 2: Drinking water standards recommending agencies and unit weights (All values are in mg/L, except pH and Electrical conductivity). Click here to View table |
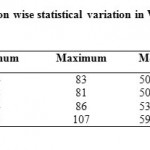 |
Table 3: Season wise statistical variation in WQI values. Click here to View table |
Table 4: Details of sampling locations and status of surface water quality.
| S.NO | Sample Code | Location | Type of water | Latitude(N) | Longitude(E) | Status |
| 1 | SW 1 | Assonora River in Bardez Taluka | River | 73°54’19.2” | 15°37’11.9” | Good |
| 2 | SW 2 | Tributary of Moide River in Shrigao, of Bicholim Taluka | River | 73°53’43.3” | 15°36’23.4” | Poor |
| 3 | SW3 | Valvanti River in Pariye of Sattari Taluka | River | 74°03’01” | 15°35’17.8’’ | Good |
| 4 | SW4 | Mandovi River near Amona Jetty in Bicholim Taluka | Nallah | 73°58’2.9” | 15°31’49.1” | Moderate |
| 5 | SW5 | Tributary of mandovi, Surla nallah in Bicholoim Taluka | River | 74°03’15” | 15°29’41.8” | Good |
| 6 | SW6 | Mandovi River in Khnodguinum Bicholim Taluka | River | 74°02’20.8” | 15°30’42” | Good |
| 7 | SW7 | Kudnem River Shonshi nallah Sattari Taluka | River | 74°02’23.7” | 15°32’37” | Good |
| 8 | SW8 | Advai nallah in Sattari Taluka | Nallah | 74.5°05’20” | 15°30’40.4” | Moderate |
| 9 | SW9 | Cudnem river in arvalem Bicholim Taluka | River | 74°01’36.5” | 15°33’2.1” | Good |
| 10 | SW10 | Cudnem river of cudnem in bicholim Taluka | River | 74°00’50.8” | 15°32’45.3” | Good |
| 11 | SW11 | Cudnem river in gauthan of Bicholim Taluka | River | 74°00’17.7” | 15°33’8.2” | Moderate |
| 12 | SW 12 | Ragda river in guleli of Sattari Taluka | River | 74°06’25.2” | 15°28’22.6” | Moderate |
| 13 | SW 13 | Mandovi river in Usgao of Dharbandora Taluka | River | 74°06’8.4” | 15°26’38.1” | Good |
| 14 | SW14 | Khandepar river in codli village of Dharbandora Taluka | River | 74°07’37” | 15°21’29.8” | Moderate |
| 15 | SW15 | Sigao in Khandepar of Dharbandora Taluka | River | 74°00’45.2” | 15°29’57.1” | Moderate |
| 16 | SW16 | Khandepar river in collem village of Dharbandora Taluka | River | 74°14’9.7” | 15°20’43.8” | Good |
| 17 | SW17 | Sanvordem nallah in Sanguem Taluka | Nallah | 74°07’37” | 15°16’37.9” | Good |
| 18 | SW18 | Selalulim Dam in Sanguem Taluka | Reservoir | 74°10’39.2” | 15°12’50.4” | Good |
| 19 | SW19 | Sanguem river in Sanguem Taluka | River | 74°08’58.7” | 15°13’57.2” | Good |
| 20 | SW20 | Kushavati river in kevona village of Quepem Taluka | River | 74°07’55.0” | 15°08’10.7” | Good |
| 21 | SW21 | Kushavati river in Sulcorna village of Quepem Taluka | River | 74°07’38.6” | 15°30’8.0” | Good |
| 22 | SW21 | Sal river in Betul village of Quepem Taluka | River | 73°57'12.1" | 15°8'17.44"N | Moderate |
| 23 | SW23 | Zuari river in Sanvordem of Quepem Taluka | River | 74°6'43.9” | 15°15'57.6” | Moderate |
| 24 | SW24 | Mayem lake in Bicholim taluka | Lake | 73°56'21.7" | 15°34'31.71” | Good |
| 25 | SW25 | Mandovi near cottombi jetty Bicholim Taluka | Jetty | 74°01'32.9" | 15°28'52.4" | Good |
| 26 | SW26 | Mandovi river sarmanas jetty in Bicholim taluka | Jetty | 73°57'34.39" | 15°32'41.20" | Moderate |
| 27 | SW27 | Moide river in sirsaim jetty in Bardez Taluka | Jetty | 73°52'53.65" | 15°36'53.161" | Moderate |
| 28 | SW28 | Mandovi river in Naveli jetty in Bicholim Taluka | Jetty | 74°0'42.68" | 15°29'58.884" | Moderate |
| 29 | SW29 | Mandovi river nera Rumda jetty in Bicholim Taluka | Jetty | 74°02'40" | 15°26'.56" | Moderate |
| 30 | SW30 | Mandovi river in mayni jetty in bicholim Taluka | Jetty | 73°59'58.96" | 15°30'34.671" | Good |
| 31 | SW31 | Zuari river Capxem jetties in Quepem Taluka | Jetty | 74°5'47.583" | 15°16'8.688" | Moderate |
| 32 | SW32 | Zuari river nera shelvaaana jetty in quepem Taluka | Jetty | 74°5'22.277" | 15°16'12.97" | Moderate |
| 33 | SW33 | Khandepar river in Opa village of Ponda Taluka | Jetty | 74°5'47.583" | 15°16'8.688" | Moderate |
| 34 | SW34 | Mandovi river near cumbharjua canal in Ponda Taluka | pond | 73°57'30.36" | 15°32'1.632" | Moderate |
| 35 | SW35 | Zuari river near Marmugao port in Marmugao Taluka | Harbour | 73°47'27.2" | 15°24'48.4" | Poor |
| 36 | SW36 | Mandovi river nera Surla jetty in Bicholim Taluka | Jetty | 74°01'44.0" | 15°28'.51.4" | Moderate |
Conclusion
On the basis of the above discussions, it may be concluded that the WQI for all samples were found in the range of 34 to 107 in the four seasons. The highest value of WQI was observed during the monsoon season while the lowest value was during the post monsoon season. The water quality analysis shows that the 47.22 % surface water samples were found as Good category and 47.22 % moderate category can be use for direct consumption while 5.56 % belongs to poor category shows that the water is not suitable for direct consumption in Goa mining region. After treatment of that water samples can be used for drinking purposes in the study area.
Acknowledgement
The authors are thankful to Ministry of Environment and Forest (MoEF) for financial support. Authors are also grateful to Prof. D.C. Panigrahi, Director, Indian School Mines, Dhanbad for his valuable support during the study. One of the authors is grateful to Indian School of Mines/MHRD/Govt. of India, for granting a great support.
References
- APHA., Standard methods for examination of water and waste water, 20th Edn., Washington, DC (2005).
- Brown R. M., McClelland N. I., Deininger R. A. and Tozer R.G., Water quality index-do we dare, Water Sewage Works, 117(10):339-343, (1970).
- Bureau of Indian Standards., BIS 10500, Manak Bhavan, New Delhi, India (2003).
- I.C.M.R., Manuals of standards of quality for drinking water supplies. I.C.M.R. New Delhi, (1975).
- Kumar R., Singh R.D. and Sharma K.D., Water resources of India, Curr Sci., 89, 794–81, (2005).
- Kumaresan M. and Riyazddin P., Major ion chemistry of environmental samples around sub-urban of Chenai city, Current Science, 9:1668-1677, (2006).
- Mishra P. C. and Patel R. K., Study of the pollution load in the drinking water of Rairangpur, a small tribal dominated town of North Orissa, Indian J. Environment and Ecoplanning, 5(2): 293-298, (2001).
- Mohan R., Singh A. K., Tripathi J. K. and Chaudhary G. C., Hydrochemistry and quality assessment of groundwater in Naini industrial area, District Allahabad, Uttar Pradesh, Journal Geological Society India, 55:77-89, (2000)
- Rao N.S. Studies on Water Quality Index in Hard rock Terrain of Guntur District, Andhra Pradesh, India, National Seminar on Hydrogeology of Precambrian Terrains and Hard Rocks Areas, Dharwad, 129-134, (1997).
- Rizwan R. and Gurdeep S., Assessment of Ground Water Quality Status by Using Water Quality Index Method in Orissa, India, World Applied Sciences Journal, 9(12):1392-1397, (2010).
- Singh A. K., Mondal G.C., Singh S., Singh P. K., Singh T. B., Tewary B. K. and Sinha A., Aquatic Geochemistry of Dhanbad District, Coal City of India: Source Evaluation and Quality Assessment, Journal Geological Society India, 69:1088- 1102 (2007).
- Singh A. K., Raj Beenu., Tiwari A. K. and Mahato M. K., Evaluation of hydrogeochemical processes and groundwater quality in the Jhansi district of Bundelkhand region, India, Environmental Earth Science, 70(3): 1225-1247, (2013).
- Singh D.F., Studies on the water quality index of some major rivers of Pune, Maharashtra Proceedings of the Academy of Environmental Biol., 1(1), 61-66, (1992).
- Singh P. K., Tiwari A. K. and Mahato M. K., Qualitative Assessment of Surface Water of West Bokaro Coalfield, Jharkhand by Using Water Quality Index Method International Journal of ChemTech Research, 5(5), (2013).
- Singh P. K., Tiwari A. K., Panigarhy B. P. and Mahato M. K., Water quality indices used for water resources vulnerability assessment using GIS technique: a review, International Journal Earth Science and Engineering, 6(6-1):1594-1600, (2013).
- Subramanian V., Water: quantity-quality perspectives in South Asia, Kingston International Publishers Limited Surrey, (2000), UK.
- Tiwari A. K. and Singh A. K., Hydrogeochemical investigation and groundwater quality assessment of Pratapgarh district, Uttar Pradesh, Journal of the Geological Society of India, 83(3): 329-343, (2014).
- Tiwari A. K., Singh P. K. and Mahato M. K., GIS-Based Evaluation of Water Quality Index of Groundwater Resources in west Bokaro Coalfield, India, Current World Environment, 9(3), (2014).
- Tiwari T. N., and Mishra M. A., A preliminary assignment of water quality index of major Indian rivers, Indian J. Environmental Protection, 5: 276-279, (1985).
- WHO., Guidelines for drinking water quality. Recommendations, Geneva: World Health Organization. 2nd Edn., 1, 188 (1993).
- Yogedra K. and Puttaiah E.T., Determination of Water Quality Index and Suitability of an Urban Waterbody in Shimga town, Karnatka.Sengupta,M and Dalwani,R (Eds.).Proceedings of Taal2007,The World Lake Conference, 342-346 (2008)


