Environmental Risk Assessment from 2018 To 2022 for Kota, Rajasthan (India)
Kuldeep Kamboj
*
 and Anil K. Mathur
1
Civil Engineering Department,
University Department, Rajasthan Technical University,
Kota,
Rajasthan
India
http://dx.doi.org/10.12944/CWE.17.3.18
Copy the following to cite this article:
Kamboj K, Mathur A. K. Environmental Risk Assessment from 2018 To 2022 for Kota, Rajasthan (India). Curr World Environ 2022;17(3). DOI:http://dx.doi.org/10.12944/CWE.17.3.18
Copy the following to cite this URL:
Kamboj K, Mathur A. K. Environmental Risk Assessment from 2018 To 2022 for Kota, Rajasthan (India). Curr World Environ 2022;17(3).
Download article (pdf) Citation Manager Publish History

Introduction
Continuously deteriorating quality of ambient air jeopardising human health 1–3. The severity of the problem varies in industrial and developing countries 4,5. Quick motorisation, rapid industrial and urban growth, and flying technological advancement have put air quality at stake globally 6–8. Many of the less developed countries becoming urbanised and industrialised do not have the resources or enough technologies to dispose of the pollutants with minimal environmental impacts 5,9. Humankind's ability to spontaneously assess and manage health risks has become fundamental to survival in today's changing environment 10,11.
Particulate matter pollution is now a serious worldwide concern due to its severe consequences on an ecosystem's biotic and abiotic components 12,13. Megacities of Rajasthan state of republic India have also experienced high concentration levels of particulate matter in the last few years, which puts an additional load on the Indian economy 14–18.
Fine particulate matter is getting more attention because of its small size. It has heterogeneous compositions of liquid and solid particles suspended in the environment. The size of dangerous particulates varies from large to too-small 7,19. Some particulates are so large that they can be watched even through the bare eye, although the rest are so minute that they could only be monitored with the help of an electron microscope 20,21. PM are broadly classified into two categories according to their aerodynamic diameter, i.e., PM2.5 (Día ? 2.5 µm) and PM10 (Día ?10 µm) 3,22.
Natural and man-made activities are answerable for the worst air quality 5,23. Volcanic eruption, dust storms, wildfires, burning of fossil fuel in coal-based industries 24–26, vehicular emissions 25,27, power generation 8,28, oil refineries 25, and stubble and wood burning are the leading causes of particulate matter formation 29,30.
The undesired detrimental effect of particulates on the health of humans has mild, moderate, or severe impacts according to their concentration level and duration of exposure. It has become a significant environmental risk factor for all-cause and disease-specific morbidity & mortality 31. Older age, Children, and pregnant women are susceptible to the exposure 32,33. PM2.5 exposure causes mortality from lung cancer 34, all-natural causes in adults (30+ years), chronic pulmonary obstructive disease (COPD) 11, acute lower respiratory infection (ALRI) 32, stroke 35, ischemic heart disease (IHD) 34, and Short-term impacts increase hospital admissions from diseases related to respiratory, cardiovascular disease (CVD), stroke, and adult mortality 36.
The ultimate objective of this work is to measure particulate matter's severe impact on inhabitants and identify the ecological environment risk category of Kota city, Rajasthan (India), during the observation period of four years (2018-2022). Not sufficient studies were available in the literature for Kota to quantify environmental risk. The educational hub of the Rajasthan state (India), Kota, is a rapid-growing metropolis with two million inhabitants. Kota is suffering from the harmful impact of particulate matter pollution.
Study Area & Research Methodology
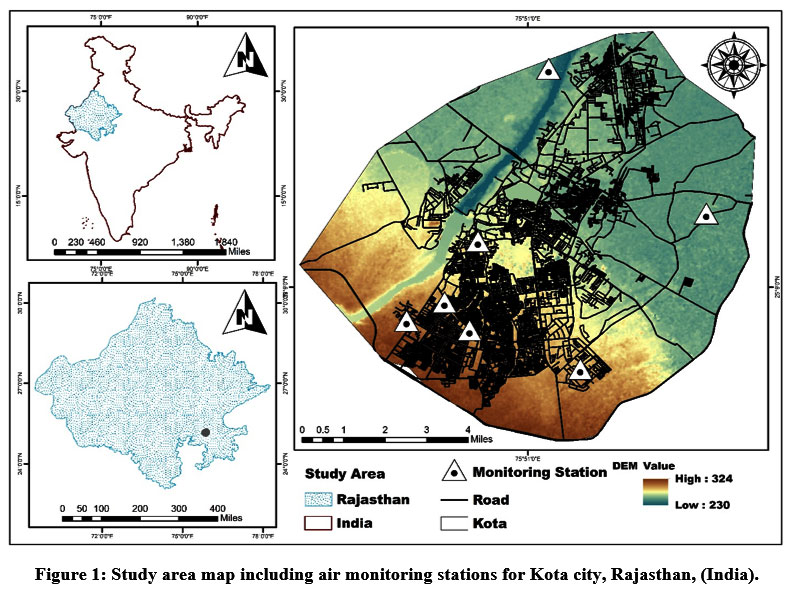
Kota, an industrial and educational district of Rajasthan, ranks 16th in terms of population, 24th in a geographical area, and 7th in population density in the Rajasthan State of India. The population of Kota was 19,51,014 in 2021 as per the census of India, 2011 37. PM10 and PM2.5 are the parameters selected for the study. Four-year air quality data is collected from January 2018 to December 2021. Seven monitoring sites on air quality were utilised to obtain the data to determine the city's air quality deterioration. Air quality stations for Kota are mentioned in Table 1.
Table 1: GPS locations of air monitoring sites available in Kota city, Rajasthan (India).
Site | Site Type | Latitude | Longitude | Description |
AQS-1 | Manual | 25.13 | 75.82 | Fire Station, Shrinathpuram |
AQS-2 | Manual | 25.16 | 75.83 | Municipal Corporation Building |
AQS-3 | Manual | 25.13 | 75.80 | Rajasthan Technical University |
AQS-4 | Manual | 25.12 | 75.86 | RSPCB, Regional Office |
AQS-5 | Manual | 25.17 | 75.91 | Samcore Glass Limited |
AQS-6 | Manual | 25.22 | 75.84 | Sewage Treatment Plant, Balita |
AQS-7 | Continuous | 25.14 | 75.82 | Shrinathpuram Stadium |
 | Figure 1: Study area map including air monitoring stations for Kota city, Rajasthan, (India).
|
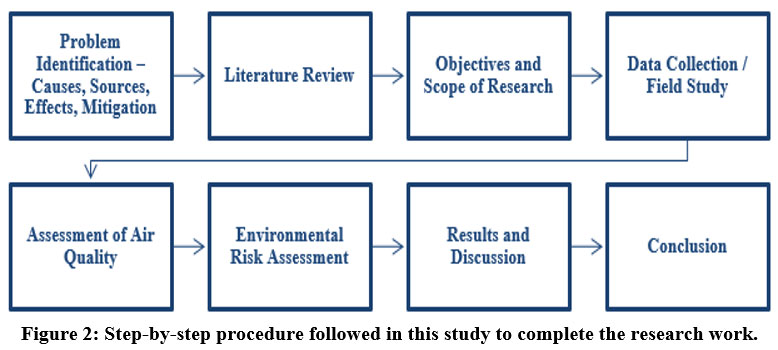
 | Figure 2: Step-by-step procedure followed in this study to complete the research work.
|
The average PM10 and PM2.5 concentrations are also compared with other regional districts of Rajasthan, namely, Jaipur, Udaipur, Ajmer, Pali, Alwar, and Jodhpur, with an additional 10 continuously monitoring air quality stations, including one continuous air quality station for Kota. The research methodology for the study is exhibited in Figure 2. Human health risk assessment has been evaluated with the help of AirQ+ software (WHO invented), while ecological hazard risk categories were recognised through risk quotient (RQ). A comparison with different regional cities, namely, Jaipur, Udaipur, Ajmer, Pali, Alwar, and Jodhpur, has also been done for PM2.5 andPM10 concentrations. The dust ratio (PM2.5/PM10) is computed for Kota and regional cities to validate the increasing levels of fine particulates than the larger ones. The fine particles have the capability of penetrating deeper into the respiratory tract which has more severe consequences for human beings than the large ones. The standards for PM10 and PM2.5 prescribed by different agencies worldwide are shown in Table 2.
Table 2: Standards for particulate matter prescribed by global agencies 24,35,38–43.
Regulating Agency | PM10 concentration, µg/m3 | PM2.5 concentration, µg/m3 | ||
Annual | 24-hour | Annual | 24-hour | |
WHO 44 | 15 | 45 | 5 | 15 |
EPA, U.S. | - | 150 | 15 | 35 |
NAAQS, India45 | 60 | 100 | 40 | 60 |
Environmental Risk Assessment
This study implements the environmental risk assessment for Kota due to particulate matter with the help of ecological environmental risk and human health risk assessments. Risk Quotient has been estimated to determine the hazard risk category for ecological environmental risk assessment. At the same time, the AirQ+ software is used to estimate human health risk analysis.
Ecological Environmental Risk
Ecological environment risk is a semi-qualitative risk based on particulate matter's physical and chemical characteristics to evaluate the ecological environment's probable risk category (Table 3). A risk Quotient is calculated with the help of the following equation 10,46:
RQp = CAP/CLP [1]
Where:
RQp = RQ for the pth pollutant,
CAp = Ambient quantity of the pth pollutant, µg/m3, and
CLp = Standard Limiting for the pth pollutant, µg/m3.
Table 3: Classification of different categories of environmental risk.
Risk Level | RQ Value | Hazard | Risk Level | RQ Value | Hazard |
A. | < 0.01 | Very Low Risk | C. | 0.1-1 | Medium Risk |
B. | 0.01-0.1 | Low Risk | D. | ? 1 | High Risk |
Human Health Risk Assessment
WHO developed AirQ+ software, which is used to assess human health risks from particulate matter. Default relative risk (RR) values for mortality from COPD, IHD, stroke, all-natural causes, LC, ALRI, HA-RD, HA-CVD, adult mortality, chronic bronchitis, bronchitis in kids, asthma in kids, postneonatal infant mortality, asthma symptoms in asthmatic kids were 1013, 132, 49, 101, 436, 436, 1260, 101, 1013, 1013, 66, 497, and 66 respectively, 32–34,36,47,48.
Results and Discussion
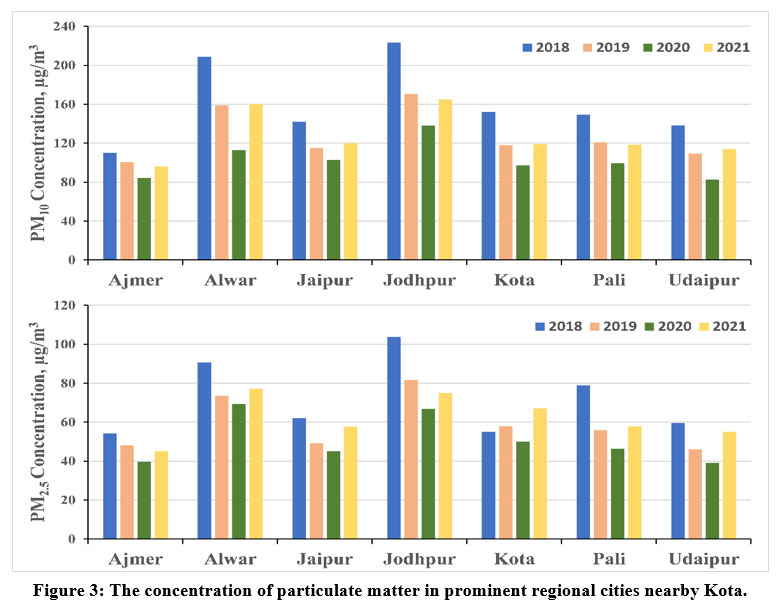
The results of this study reveal that PM2.5 and PM10 concentrations for Kota, Jaipur Ajmer, Udaipur, Pali, Jodhpur, and Alwar of Rajasthan were higher than those recommended by different agencies worldwide shown in Table 2. Particulate Matter concentrations for Kota, Jaipur, Ajmer, Udaipur, Pali, Jodhpur, and Alwar are shown in Figure 3.
 | Figure 3: The concentration of particulate matter in prominent regional cities nearby Kota.
|
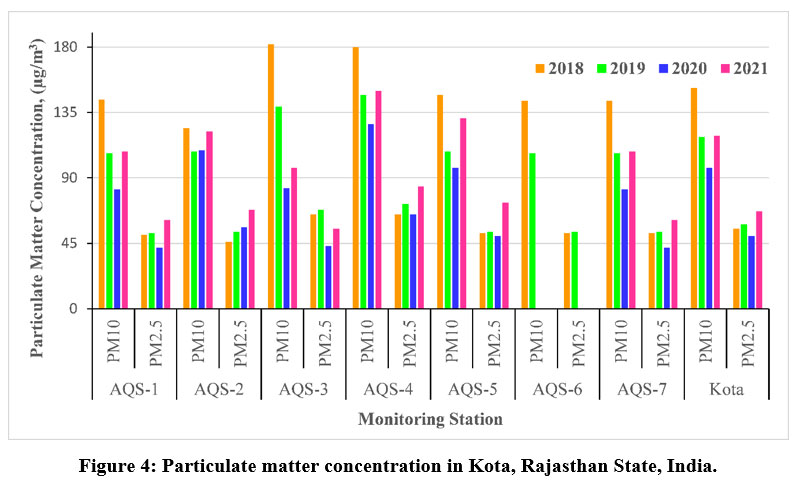
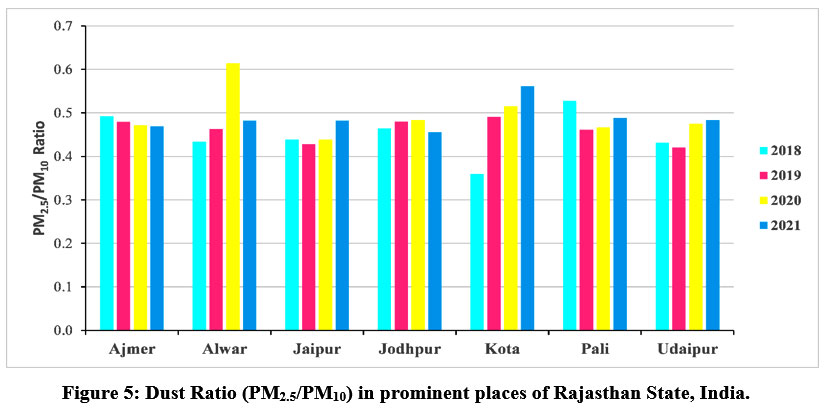
The annual particulate matter concentrations are mentioned in Table 4 for each sampling location in the city. The PM10 concentrations for Kota were 152, 118, 97, and 119 µg/m3 in 2018, 2019, 2020, and 2021, respectively. The PM2.5 concentrations for Kota were 55, 58, 50, and 67 µg/m3 in 2018, 2019, 2020, and 2021, respectively. The dust ratio for Kota were 0.36, 0.49, 0.52, and 0.56 in 2018, 2019, 2020, and 2021 respectively. An increasing trend has been seen in the dust ratio during the observation of four years. The dust ratio varies from place to palace and year to year. The PM2.5 concentration gradually increased during observation except in 2020 due to Covid-19 lockdown restrictions all over India in 2020 49,50.
A decreasing trend has been observed for PM10 till 2020, but it again starts increasing in 2021 with tremendous speed. Several studies suggest that these restrictions help to improve air quality worldwide. The annual particulate matter concentrations are exhibited in Figure 4 for each sampling location in the metropolitan area. 121 and 57 µg/m3 were the mean PM10 and PM2.5 concentration, respectively. At the same time, the average dust ratio was 0.48. The dust Ratio (PM2.5/PM10) in prominent places of Rajasthan State, India, is graphically presented in Figure 5. The dust ratio for Kota city is gradually rising from 0.36 to 0.51. The dust ratio for Kota was 0.36 in 2018, 0.49 in 2019, 0.51 in 2020, and 0.56 in 2021. High dust ratio values confirm the higher concentration of fine particles (PM2.5) compared to larger particles (PM10). The fine particles have the capability of penetrating deeper into the respiratory tract and creating many adverse effects on the human body. Hence, it is becoming a more serious concern for the inhabitants of Kota city.
Table 4: Annual PM10 and PM2.5 data for each station of Kota city, Rajasthan (India).
PM10 | ||||||||
Year | AQS-1 | AQS-2 | AQS-3 | AQS-4 | AQS-5 | AQS-6 | AQS-7 | Kota |
2018 | 144 | 124 | 182 | 180 | 147 | 143 | 143 | 152 |
2019 | 107 | 108 | 139 | 147 | 108 | 107 | 107 | 118 |
2020 | 82 | 109 | 83 | 127 | 97 | NA | 82 | 97 |
2021 | 108 | 122 | 97 | 150 | 131 | NA | 108 | 119 |
Average | 110 | 116 | 125 | 151 | 120 | 125 | 110 | 122 |
PM2.5 | ||||||||
Year | AQS-1 | AQS-2 | AQS-3 | AQS-4 | AQS-5 | AQS-6 | AQS-7 | Kota |
2018 | 51 | 46 | 65 | 65 | 52 | 52 | 52 | 55 |
2019 | 52 | 53 | 68 | 72 | 53 | 53 | 53 | 58 |
2020 | 42 | 56 | 43 | 65 | 50 | NA | 42 | 50 |
2021 | 61 | 68 | 55 | 84 | 73 | NA | 61 | 67 |
Average | 52 | 56 | 58 | 72 | 57 | 53 | 52 | 58 |
*NA stands for not availability of data.
 | Figure 4: Particulate matter concentration in Kota, Rajasthan State, India.
|
 | Figure 5: Dust Ratio (PM2.5/PM10) in prominent places of Rajasthan State, India.
|
Ecological Environmental Risk
The risk quotient can be assessed by determining the potential risk of particulate pollutants to the ecological environment. The risk quotient values for PM10 were 2.53, 1.96, 1.61, and 1.99 in 2018, 2019, 2020, and 2021, respectively, while the values for PM2.5 were 1.36, 1.44, 1.25, and 1.68 in 2018, 2019, 2020, and 2021, respectively. The whole of India was suffering from Corona Virus outbreaks in 2021. The citizens strictly followed lockdown restrictions to complete their duty toward the nation. Transport and industrial activities were under the limitation of government orders which positively impacted the quality of ambient air. The air pollutants concentrations went down, and inhabitants had clean air to breathe. Several studies on air quality reveal a meaningful impact of lockdown restrictions on the air quality globally 2,50–52, and a reduction in particulate matter pollution level was also seen in 2020 for Kota, also leading to low values of RQ for PM10 and PM2.5. The risk quotient values for Kota were calculated with the help of equation 1, which is mentioned in Table 5. The PM10 and PM2.5 for Kota were computed through the average of all monitoring stations' concentrations (Table 4). RQ values for each year for Kota city are evaluated from average PM10 and PM2.5 concentrations.
Table 5: RQ value and relative risk category for PM10 and PM2.5.
PM10 | Year | RQ | Hazard | PM2.5 | Year | RQ | Hazard |
2018 | 02.53 | H | 2018 | 01.36 | H | ||
2019 | 01.96 | H | 2019 | 01.44 | H | ||
2020 | 01.61 | H | 2020 | 01.25 | H | ||
2021 | 01.99 | H | 2021 | 01.68 | H | ||
Average | 02.02 | H | Average | 01.43 | H |
*H stands for High.
Human Health Risk Assessment
The average annual PM10 and PM2.5 were 123 and 57 µg/m3, respectively, during the observation of four years for Kota city. The particulate matter concentration plays a vital role in conducting the impact analysis through software (AirQ+). The estimated effects of PM10 and PM2.5 are mentioned in Table 6.
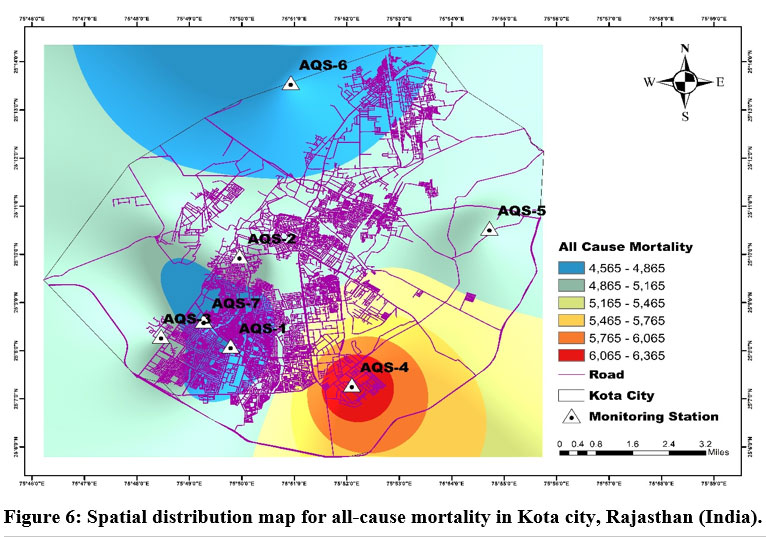
The ENACs for all-cause mortality from PM2.5 exposure for a long period was maximum at the AQS-4 location with 6365 deaths, followed by the AQS-3 location (5128 deaths), AQS-5 location (5036 deaths), AQS-2 (4943 deaths), AQS-1 (4565 deaths), AQS-6 (4565 deaths), AQS-7 (4565 deaths). The average all-cause mortality for Kota city is 5024 due to PM2.5 exposure for a long period.
Table 6: Station Wise Distribution of ENACs for Disease Caused by PM10 and PM2.5.
Disease | Air Monitoring Station | ||||||
AQS-1 | AQS-2 | AQS-3 | AQS-4 | AQS-5 | AQS-6 | AQS-7 | |
All-Cause Mortality | 4565 | 4943 | 5128 | 6365 | 5036 | 4565 | 4565 |
Lung Cancer | 809 | 872 | 903 | 1103 | 887 | 809 | 809 |
ALRI | 256 | 269 | 276 | 316 | 273 | 256 | 256 |
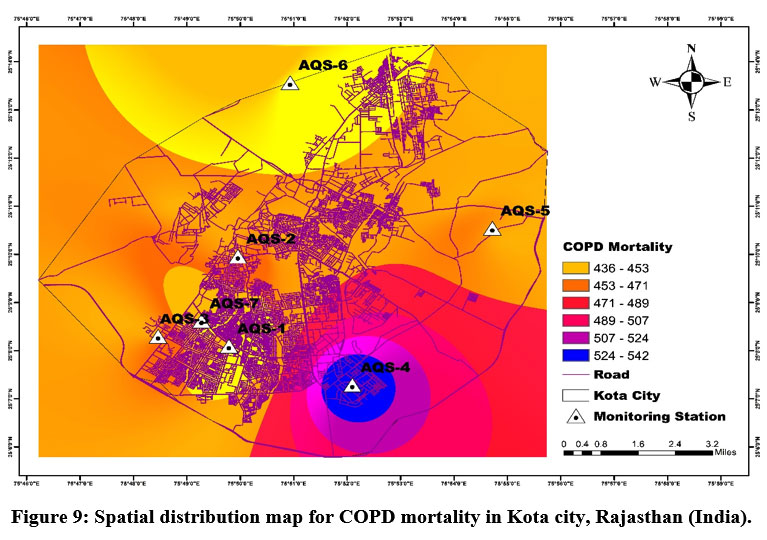
COPD | 436 | 460 | 471 | 543 | 465 | 436 | 436 |
IHD | 1962 | 2047 | 2088 | 2334 | 2068 | 1962 | 1962 |
Stroke | 1777 | 1865 | 1908 | 2171 | 1887 | 1777 | 1777 |
Chronic Bronchitis | 13685 | 14119 | 14719 | 16151 | 14460 | 13685 | 13685 |
Bronchitis in Kids | 715 | 743 | 782 | 882 | 765 | 715 | 715 |
Asthma in Kids | 321 | 338 | 362 | 430 | 352 | 362 | 321 |
HA-RD | 1260 | 1442 | 1532 | 2153 | 1487 | 1532 | 1260 |
HA-CVD | 49 | 56 | 60 | 85 | 58 | 60 | 49 |
Mortality adults | 664 | 760 | 808 | 1142 | 784 | 664 | 664 |
Postneonatal Infant Mortality | 325475 | 341237 | 364196 | 426146 | 354092 | 325475 | 325475 |
*ENAC stands for the estimated number of attributable cases.
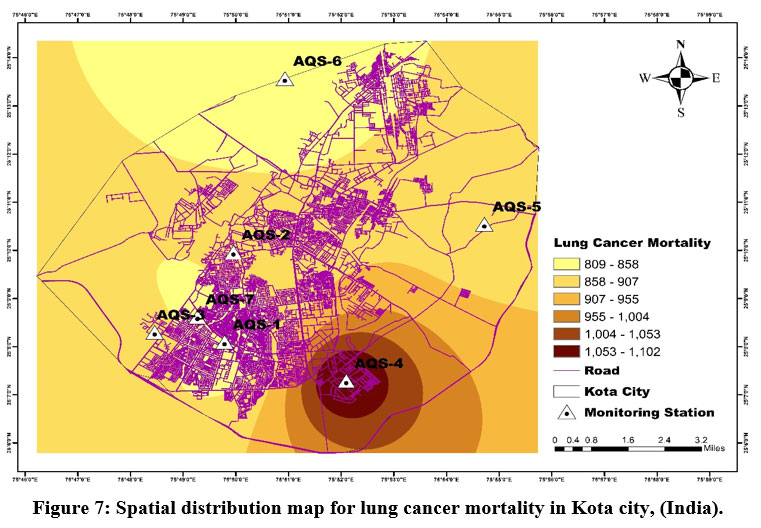
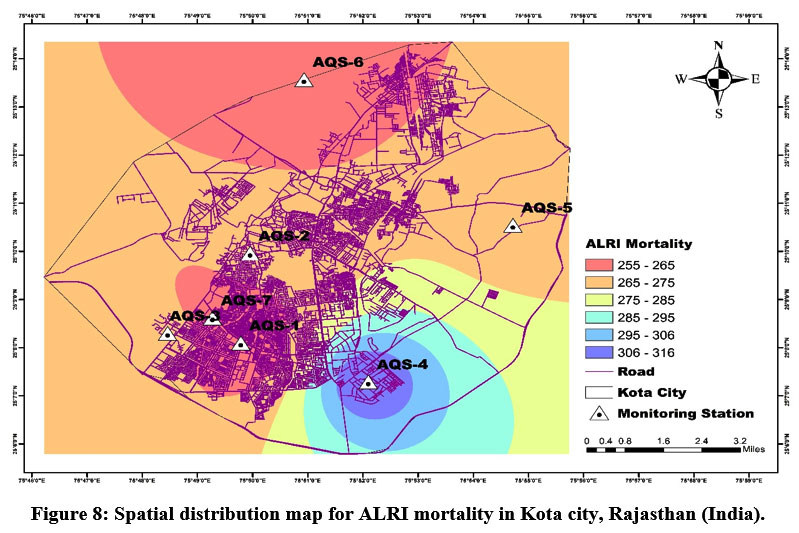
The lung cancer mortality was 1103 for the AQS-4 location, 903 for the AQS-3 location, 887 for the AQS-5 location, 872 for the AQS-2 location, and 809 for the AQS-1, AQS-6, and AQS-7 locations. The average lung cancer mortality for Kota city is 885 due to PM2.5 exposure over a long period. The ALRI mortality was leading at the AQS-4 location (316 deaths), followed by the AQS-3 location (276 deaths), the AQS-5 location (273 deaths), the AQS-2 l 7 location (269 deaths), and 256 for the AQS-1, AQS-6, and AQS-7 locations. The average ALRI mortality for Kota city is 272 due to PM2.5 exposure for a long period. The COPD mortality was maximum at the AQS-4 location with 543 deaths, followed by the AQS-3 location (471 deaths), AQS-5 location (465 deaths), AQS-2 (460 deaths), AQS-1 (436 deaths), AQS-6 (436 deaths), AQS-7 (436 deaths). The average COPD mortality for Kota city is 464 due to PM2.5 exposure for a long period.
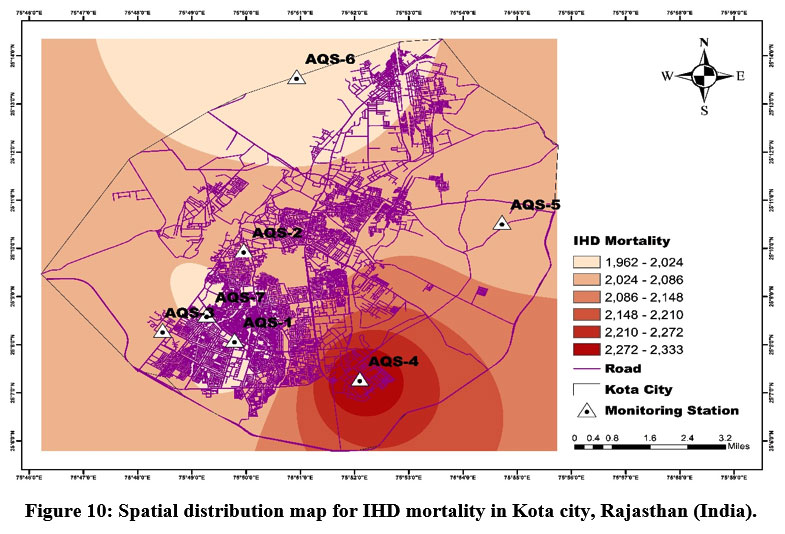
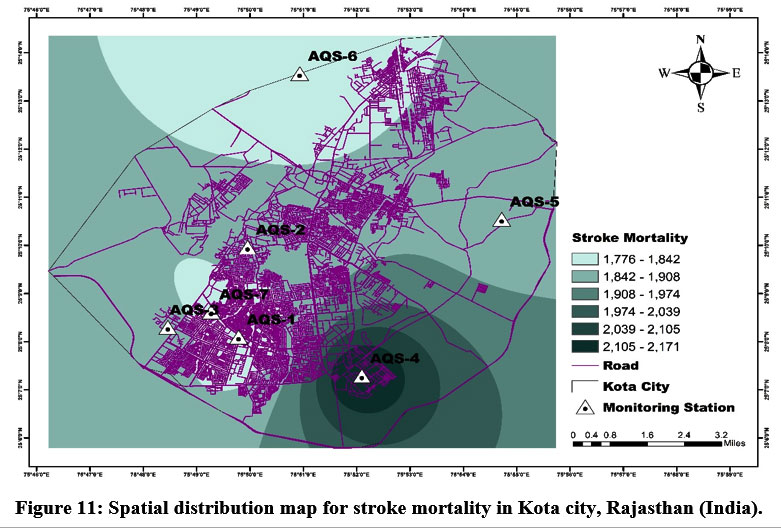
The IHD mortality was 2334 for the AQS-4 location, 2088 for the AQS-3 location, 2068 for the AQS-5 location, 2047 for the AQS-2 location, and 1962 for the AQS-1, AQS-6, and AQS-7 locations. The average IHD mortality for Kota city is 2060 due to PM2.5 exposure for a long period. Stroke mortality was leading at the AQS-4 location (2171 deaths), followed by the AQS-3 location (1908 deaths), the AQS-5 location (1887 deaths), the AQS-2 location (1865 deaths), and 1777 for the AQS-1, AQS-6, and AQS-7 locations. The average stroke mortality for Kota city is 1880 due to PM2.5 exposure for a long period. The postneonatal infant mortality due to PM10 exposure for a long period was maximum at the S-4 location with 426146 deaths, followed by the AQS-3 location (364196 deaths), AQS-5 location (354092 deaths), AQS-6 (354095 deaths), AQS-2 (341237 deaths), AQS-1 (325475 deaths), AQS-7 (325475deaths). The average postneonatal infant mortality for Kota city is 355816 due to PM10 exposure for a long period.
The chronic bronchitis incidence in adults was 16151 for the AQS-4 location, 14719 for the AQS-3 location, 14460 for the AQS-5 and AQS-6 locations, 14119 for the AQS-2 location, and 13685 for the AQS-1 and AQS-7 locations. The average chronic bronchitis incidence in adults for Kota city is 14469 due to PM10 exposure for a long period. The prevalence of bronchitis in kids was foremost at the AQS-4 location (882 cases), followed by the AQS-3 location (782 cases), the AQS-5 and AQS-6 locations (765 cases), the AQS-2 location (743 cases), and 715 for the AQS-1, and AQS-7 locations. The prevalence of bronchitis in kids in Kota city is 767 due to PM10 exposure for a long period. The hospital admission for respiratory disease (HA-RD) from PM2.5 exposure for a short period was maximum at the AQS-4 location with 2153 cases, followed by the AQS-3 location (1532 cases), AQS-5 location (1487 cases), AQS-2 (1442 cases), AQS-1, AQS-6, and AQS-7 (1260 cases). The average HA-RD for Kota city is 1485 due to PM2.5 exposure for a short period.
The hospital admission due to cardiovascular disease (HA-CVD) was 85 for the AQS-4 location, 60 for the AQS-3 location, 58 for the AQS-5 location, 56 for the AQS-2 location, and 49 for the AQS-1, AQS-6, and AQS-7 locations. The average HACVD for Kota city is 58 due to PM2.5 exposure for a short period. The all-cause mortality in adults was leading at the AQS-4 location (1142 deaths), followed by the AQS-3 location (808 deaths), the AQS-5 location (784 deaths), the AQS-2 location (760 deaths), and 664 for the AQS-1, AQS-6, and AQS-7 locations. The average all-cause mortality in adults for Kota city is 784 due to PM2.5 exposure for a short period. The asthma symptoms in asthmatic kids due to PM10 exposure for a short period were maximum at the AQS-4 location with 430 cases, followed by the AQS-3 location (362 cases), AQS-5 location (352 cases), AQS-2 (338 cases), AQS-1, AQS-2, and AQS-7 (321 cases). The mean asthma symptoms in asthmatic kids for Kota city is 349 due to PM10 exposure for a short period.
The EAP and ENACPL for long and short-term effects of PM2.5 and PM10 on humans. AirQ+ software gave the results at the ambient level tabulated in Tables 7 and 8, respectively. Notably, the higher concentration of particulate matter station has high ENACs, EAP and ENACPL.
Table 7: Station Wise Distribution of EAP (%) for Disease Caused by PM10 and PM2.5.
Disease | Air Monitoring Station | ||||||
AQS-1 | AQS-2 | AQS-3 | AQS-4 | AQS-5 | AQS-6 | AQS-7 | |
All-Cause Mortality | 22.33 | 24.17 | 25.08 | 31.13 | 24.63 | 22.33 | 22.33 |
Lung Cancer | 30.37 | 32.73 | 33.88 | 41.39 | 33.30 | 30.37 | 30.37 |
ALRI | 25.83 | 27.23 | 27.89 | 31.97 | 27.56 | 25.83 | 25.83 |
COPD | 21.39 | 22.55 | 23.11 | 26.61 | 22.83 | 21.39 | 21.39 |
IHD | 22.30 | 23.26 | 23.72 | 26.52 | 23.49 | 22.30 | 22.30 |
Stroke | 20.19 | 21.20 | 21.68 | 24.67 | 21.44 | 20.19 | 20.19 |
Chronic Bronchitis | 66.93 | 69.05 | 71.99 | 78.99 | 70.72 | 70.72 | 66.93 |
Bronchitis in Kids | 53.68 | 55.77 | 58.73 | 66.21 | 57.44 | 57.44 | 53.68 |
HA-RD | 4.95 | 5.67 | 6.02 | 8.47 | 5.85 | 4.95 | 4.95 |
HA-CVD | 2.42 | 2.77 | 2.95 | 4.17 | 2.86 | 2.42 | 2.42 |
Mortality adults | 3.25 | 3.72 | 3.95 | 5.58 | 3.84 | 3.25 | 3.25 |
Asthma in Kids | 24.13 | 25.38 | 27.21 | 32.25 | 26.40 | 24.13 | 24.13 |
Postneonatal Infant Mortality | 32.44 | 34.01 | 36.30 | 42.48 | 35.30 | 35.30 | 32.44 |
*EAP stands for the estimated attributable proportion.
The individual station data is utilised to exhibit the spatial distribution of mortality due to all causes (natural), lung cancer, COPD, ALRI, Stroke and IHD in Kota city. The software employed to exhibit spatial variability is ESRI ArcGIS with the inverse distance weighing (IDW) interpolation method.
Table 8: Station Wise Distribution of ENACPL for Disease Caused by PM10 and PM2.5.
Disease | Air Monitoring Station | ||||||
AQS-1 | AQS-2 | AQS-3 | AQS-4 | AQS-5 | AQS-6 | AQS-7 | |
All-Cause Mortality | 226 | 245 | 254 | 315 | 249 | 226 | 226 |
Lung Cancer | 40 | 43 | 45 | 55 | 44 | 40 | 40 |
ALRI | 13 | 13 | 14 | 16 | 14 | 13 | 13 |
COPD | 22 | 23 | 23 | 27 | 23 | 22 | 22 |
IHD | 97 | 101 | 103 | 116 | 102 | 97 | 97 |
Stroke | 88 | 92 | 95 | 108 | 93 | 88 | 88 |
Chronic Bronchitis | 678 | 699 | 729 | 800 | 716 | 716 | 678 |
Bronchitis in Kids | 35 | 37 | 39 | 44 | 38 | 38 | 35 |
HA-RD | 62 | 71 | 76 | 107 | 74 | 62 | 62 |
HA-CVD | 2 | 3 | 3 | 4 | 3 | 2 | 2 |
Mortality adults | 33 | 38 | 40 | 57 | 39 | 33 | 33 |
Asthma in Kids | 16 | 17 | 18 | 21 | 17 | 16 | 16 |
Postneonatal Infant Mortality | 161 | 169 | 180 | 211 | 175 | 175 | 161 |
*ENACPL stands for the estimated number of attributable cases per lac population.
The spatial variability maps for mortality due to all-natural causes (Figure 6), lung cancer (Figure 7), ALRI (Figure 8), COPD (Figure 9), IHD (Figure 10), and stroke (Figure 11) have been prepared through ESRI ArcGIS software. It can be easily verified through these maps that the peoples of the nearby area of station AQS-4 (Regional Office, RSPCB) are highly vulnerable to the adverse effect of particulate matter as this station has the peak average PM10 and PM2.5 concentrations among all. The AQS-4 station is only 3.5 km from the city's center, the aerodrome circle. The AQS-6 station (Sewage Treatment Plant, Balita) is situated on the outer periphery of Kota city, almost 12 km from the city's center, the aerodrome circle, and it is the least susceptible to the adverse effect of particulate matter due absence of air pollution sources.
 | Figure 6: Spatial distribution map for all-cause mortality in Kota city, Rajasthan (India).
|
 | Figure 7: Spatial distribution map for lung cancer mortality in Kota city, (India).
|
 | Figure 8: Spatial distribution map for ALRI mortality in Kota city, Rajasthan (India).
|
 | Figure 9: Spatial distribution map for COPD mortality in Kota city, Rajasthan (India).
|
 | Figure 10: Spatial distribution map for IHD mortality in Kota city, Rajasthan (India).
|
 | Figure 11: Spatial distribution map for stroke mortality in Kota city, Rajasthan (India).
|
Conclusion
The present study reveals that the particulate matter concentration for Kota during the observation period is clearly violating the standards prescribed by the different global agencies, namely, WHO, USEPA, and Indian NAAQS. Particulate matter pollution is identified as the foremost cause of air pollution in Kota. The air quality monitoring station situated at Regional Office, RSPCB shows the maximum degradation in the air quality due to the presence of different micro, small and medium enterprises. Transportation of goods with the help of heavy vehicles puts an additional deterioration in the ambient air quality. The amount of fine particulate matter (PM2.5) gradually increases in Kota city as the dust ratio shows an increasing trend during the observation period. The fine particles have the capability of penetrating deeper into the respiratory tract and creating many adverse effects on the human body. Hence, it is becoming a more serious concern for the inhabitants of Kota city.
The environmental risk assessment of particulate matter results shows that neither the state capital, Jaipur, nor other prominent cities such as Kota, Ajmer, Udaipur, Pali, Jodhpur, and Alwar of Rajasthan are competent to maintain or keep below the particulate matter concentration within the safe limits prescribed by different agencies worldwide. In other words, metro cities of Rajasthan state are suffering from regularly growing levels of particulate matter pollution.
The ecological environment of Kota city is under massive threat as the hazard risk is in the high category (RQ>1) for PM10 and PM2.5. Ecological environment risk assessment suggests that Kota inhabitants are highly vulnerable to negative impacts caused by particulate matter. The order of mortality cases for Kota city evaluated through AirQ+ software is the all-natural cause (4565-6365) > IHD (1962-2333) > stroke (1776-2171) > lung cancer (809-1102) > COPD (436-542) > ALRI (255-316).
Improving the management of solid waste, restricting open burning, increasing green beltways, prohibiting old vehicles, planting different plants, and shifting towards clean energy vehicles would effectively lessen the consequence of particulate matter on people.
Acknowledgements
We are grateful to CPCB and RSPCB for providing particulate matter data for the study. Highly obliged to University Departments, RTU, Kota (India), for providing financial support to this
study.
Conflict of Interest
There is no conflict of interest between the authors.
Funding Sources
There is no funding source.
References
- Kamboj K, Mathur AK. Air Quality Assessment with Human Health Effects for Kota Metropolis, Rajasthan India, 2022;17(2): 373-392. DOI: http://dx.doi.org/10.12944/CWE.17.2.10.
CrossRef - Lokhandwala S, Gautam P. Indirect impact of COVID-19 on environment: A brief study in Indian context. Environ Res. 2020;188(April):109807. doi:10.1016/j.envres.2020.109807
CrossRef - Janssen NAH, Fischer P, Marra M, Ameling C, Cassee FR. Short-term effects of PM2.5, PM10, and PM2.5-10 on daily mortality in the Netherlands. Sci Total Environ. 2013;463-464:20-26. doi:10.1016/j.scitotenv.2013.05.062
CrossRef - Bahino J, Yoboué V, Galy-Lacaux C, et al. A pilot study of gaseous pollutants' measurement (NO2, SO2, NH3, HNO3, and O3) in Abidjan, Côte d'Ivoire: Contribution to an overview of gaseous pollution in African cities. Atmos Chem Phys. 2018;18(7):5173-5198. doi:10.5194/acp-18-5173-2018
CrossRef - Pathakoti M, Muppalla A, Hazra S, et al. Measurement report: An assessment of the impact of a nationwide lockdown on air pollution - A remote sensing perspective over India. Atmos Chem Phys. 2021;21(11):9047-9064. doi:10.5194/acp-21-9047-2021
CrossRef - Nori-Sarma A, Thimmulappa RK, Venkataramana G V., et al. Low-cost NO2 monitoring and predictions of urban exposure using universal kriging and land-use regression modelling in Mysore, India. Atmos Environ. 2020;226(2):117395. doi:10.1016/j.atmosenv.2020.117395
CrossRef - Tian Y, Jiang Y, Liu Q, et al. Temporal and spatial trends in air quality in Beijing. Landsc Urban Plan. 2019;185(January):35-43. doi:10.1016/j.landurbplan.2019.01.006
CrossRef - Power AL, Tennant RK, Jones RT, et al. Monitoring Impacts of Urbanisation and Industrialisation on Air Quality in the Anthropocene Using Urban Pond Sediments. Front Earth Sci. 2018;6(September):1-18. doi:10.3389/feart.2018.00131
CrossRef - Kaur R, Pandey P. Air Pollution, Climate Change, and Human Health in Indian Cities: A Brief Review. Front Sustain Cities. 2021;3(August). doi:10.3389/frsc.2021.705131
CrossRef - Chalvatzaki E, Chatoutsidou SE, Lehtomäki H, et al. Characterisation of human health risks from particulate air pollution in selected European cities. Atmosphere (Basel). 2019;10(2):1-16. doi:10.3390/ATMOS10020096
CrossRef - Kumar A, Mishra RK, Sarma K. Mapping spatial distribution of traffic-induced criteria pollutants and associated health risks using kriging interpolation tool in Delhi. J Transp Heal. 2020;18(July):100879. doi:10.1016/j.jth.2020.100879
CrossRef - Al-Thani H, Koç M, Isaifan RJ. A review on the direct effect of particulate atmospheric pollution on materials and its mitigation for sustainable cities and societies. Environ Sci Pollut Res. 2018;25(28):27839-27857. doi:10.1007/s11356-018-2952-8
CrossRef - Neira DM, Director of Public Health, Environmental and Social Determinants of Health Ambient Air Pollution: A Global Assessment of Exposure and Burden of Disease. Vol 66.; 2016.
- Sisodiya S, Mathur AK, Verma P. Assessment of Particulate Matter Changes in Large Cities Of Rajasthan ( India ) During Covid-19 Lockdowns. 2021;(May). 25th International Clean Air & Environment Conference organised virtually by Clean Air Society of Australia and New Zealand (CASANZ2021), May 17-21, 2021.
- Kumar, Porush; Kuldeep, Kuldeep; Gautam Nilima An assessment of ambient air quality using AQI and exceedance factor for Udaipur City, Rajasthan ( India ). Weentech Proc Energy. 2021;7(December 2020):94-106. doi:https://doi.org/10.32438/WPE.102021
CrossRef - IQAir. World Air Quality Report. 2019 World Air Qual Rep. Published online 2019:1-35. https://www.iqair.com/world-air-quality-ranking
- Region & City PM2.5 Ranking. World Air Quality Report.; 2020. https://www.iqair.com/world-air-quality-ranking
- Region & City PM2.5 Ranking. World Air Quality Report.; 2018. https://www.iqair.com/world-air-quality-ranking
- Tobías A, Carnerero C, Reche C, et al. Science of the Total Environment Changes in air quality during the lockdown in Barcelona ( Spain ) one month into the SARS-CoV-2 epidemic. Sci Total Environ. 2020;726:138540. doi:10.1016/j.scitotenv.2020.138540
CrossRef - Lu X, Lin C, Li Y, Yao T, Fung JCH, Lau AKH. Assessment of health burden caused by particulate matter in southern China using high-resolution satellite observation. Environ Int. Published online 2016. doi:10.1016/j.envint.2016.11.002
CrossRef - Hamanaka RB, Mutlu GM. Particulate Matter Air Pollution: Effects on the Cardiovascular System. Front Endocrinol (Lausanne). 2018;9(November):1-15. doi:10.3389/fendo.2018.00680
CrossRef - Bathmanabhan S, Saragur Madanayak SN. Analysis and interpretation of particulate matter - PM10, PM2.5, and PM1 emissions from the heterogeneous traffic near an urban roadway. Atmos Pollut Res. 2010;1(3):184-194. doi:10.5094/APR.2010.024
CrossRef - Pozzer A, Dominici F, Haines A, Witt C, Münzel T, Lelieveld J. Regional and global contributions of air pollution to risk of death from COVID-19. Cardiovasc Res. 2020;116(14):2247-2253. doi:10.1093/cvr/cvaa288
CrossRef - Gautam S, Patra AK, Sahu SP, Hitch M. Particulate matter pollution in opencast coal mining areas: a threat to human health and environment. Int J Mining, Reclam Environ. 2018;32(2):75-92. doi:10.1080/17480930.2016.1218110
CrossRef - Brumberg HL, Karr CJ. Ambient air pollution: Health hazards to children. Pediatrics. 2021;147(6). doi:10.1542/peds.2021-051484
CrossRef - Kamboj K, Sisodiya S, Mathur AK, Zare A, Verma P. Assessment and Spatial Distribution Mapping of Criteria Pollutants. Water Air Soil Pollut. 2022;233(3):1-15. doi:10.1007/s11270-022-05522-y
CrossRef - Ravindra K, Singh T, Mor S, et al. Real-time monitoring of air pollutants in seven cities of North India during crop residue burning and their relationship with meteorology and transboundary movement of air. Sci Total Environ. 2019;690(June):717-729. doi:10.1016/j.scitotenv.2019.06.216
CrossRef - He H, Vinnikov KY, Li C, et al. Response of SO2 and particulate air pollution to local and regional emission controls: A case study in Maryland. Earth's Futur. 2016;4(4):94-109. doi:10.1002/2015EF000330
CrossRef - Sen A, Abdelmaksoud AS, Nazeer Ahammed Y, et al. Variations in particulate matter over Indo-Gangetic Plains and Indo-Himalayan Range during four field campaigns in winter monsoon and summer monsoon: Role of pollution pathways. Atmos Environ. 2017;154:200-224. doi:10.1016/j.atmosenv.2016.12.054
CrossRef - Gogikar P, Tyagi B. Assessment of particulate matter variation during 2011–2015 over a tropical station Agra, India. Atmos Environ. 2016;147:11-21. doi:10.1016/j.atmosenv.2016.09.063
CrossRef - Singh V, Singh S, Biswal A. Exceedances and trends of particulate matter (PM2.5) in five Indian megacities. Sci Total Environ. 2021;750:141461. doi:10.1016/j.scitotenv.2020.141461
CrossRef - Afghan FR, Patidar SK. Health impacts assessment due to PM2.5, PM10, and NO2 exposure in National Capital Territory (NCT) Delhi. Pollution. 2020;6(1):115-126. doi:10.22059/POLL.2019.286454.662
CrossRef - Khaniabadi YO, Polosa R, Chuturkova RZ, et al. Human health risk assessment due to ambient PM10 and SO2 by an air quality modeling technique. Process Saf Environ Prot. 2017;111:346-354. doi:10.1016/j.psep.2017.07.018
CrossRef - Kermani M, Arfaeinia H, Masroor K, et al. Health impacts and burden of disease attributed to long-term exposure to atmospheric PM10/PM2.5 in Karaj, Iran: effect of meteorological factors. Int J Environ Anal Chem. Published online 2020. doi:10.1080/03067319.2020.1807534
CrossRef - Rovira J, Domingo JL, Schuhmacher M. Air quality, health impacts and burden of disease due to air pollution (PM10, PM2.5, NO2, and O3): Application of AirQ+ model to the Camp de Tarragona County (Catalonia, Spain). Sci Total Environ. 2020;703(xxxx):135538. doi:10.1016/j.scitotenv.2019.135538
CrossRef - Manojkumar N, Srimuruganandam B. Health effects of particulate matter in major Indian cities. Int J Environ Health Res. 2021;31(3):258-270. doi:10.1080/09603123.2019.1651257
CrossRef - 2011 Census of India. Kota District Census Handbook 2011, Government of India. Published online 2011. https://www.censusindia.gov.in/2011census/dchb/DCHB.html
- CPCB. National Air Quality Index. Central Pollution Control Board. 2014;(January):1-44. https://www.cpcb.nic.in/uploads/National_Ambient_Air_Quality_Standards.pdf
- Massey DD, Kulshrestha A, Taneja A. Particulate matter concentrations and their related metal toxicity in rural residential environment of semi-arid region of India. Atmos Environ. 2013;67:278-286. doi:10.1016/j.atmosenv.2012.11.002
CrossRef - CPCB. Revised National Ambient Air Quality Standards (NAAQS). 2009;826:1-18. http://hppcb.nic.in/Standards/AQS.pdf
- Kuldeep, Sisodiya S, Mathur AK, Verma P. Assessment of Urban Air Quality for Jodhpur City by the Air Quality Index (AQI) and Exceedance Factor (EF). In: Verma P, Samuel OD, Verma TN, Dwivedi G, eds. Advancement in Materials, Manufacturing and Energy Engineering, Vol. I. Springer Singapore; 2022:585-596. doi:https://doi.org/10.1007/978-981-16-5371-1_51
CrossRef - Chauhan A, Singh RP. Effect of lockdown on HCHO and trace gases over India during March 2020. Aerosol Air Qual Res. 2021;21(4):1-19. doi:10.4209/aaqr.2020.07.0445
CrossRef - Rai PK. Multifaceted health impacts of Particulate Matter ( PM ) and its management?: An overview. Environ Skept Critics. 2015;4(1):1-26.
- WHO. WHO global air quality guidelines. Coast Estuar Process. Published online 2021:1-360. https://www.who.int/news/item/22-09-2021-new-who-global-air-quality-guidelines-aim-to-save-millions-of-lives-from-air-pollution
- Kuldeep, Kumar P, Kamboj P, Mathur AK. Air Quality Decrement After Lockdown in Major Cities of Rajasthan, India. In: ECS Transactions. ; 2022:18479-18496. doi:https://doi.org/10.1149/10701.18479ecst
CrossRef - Thi DO, Chi LAN, Toan VUDUC, Linh QHA, Chien VUVAN, Huyen VUTHU. Risk Assessment For PM10 And PM2.5 In Hanoi, Vietnam?: An Ecological Study. 2020;39(4):971-979.
- Goel A, Saxena P, Sonwani S, et al. Health benefits due to reduction in respirable particulates during covid-19 lockdown in India. Aerosol Air Qual Res. 2021;21(5):1-16. doi:10.4209/aaqr.200460
CrossRef - Markandeya, Verma PK, Mishra V, Singh NK, Shukla SP, Mohan D. Spatio-temporal assessment of ambient air quality, their health effects and improvement during COVID-19 lockdown in one of the most polluted cities of India. Environ Sci Pollut Res. 2021;28(9):10536-10551. doi:10.1007/s11356-020-11248-3
CrossRef - Anh Tuan Hoang, Thanh Tung Huynh, Xuan Phuong Nguyen TKTN& TH Le. anh Tuan. An Anal Rev Glob NO2 Emiss Dur lockdowns COVID-19 period. Published online 2021:22. doi:https://doi.org/10.1080/15567036.2021.190243
- Garg M, Goyal S, Bansal O. Effect of lockdown amid COVID-19 pandemic on air quality of most polluted cities of Punjab (India). J Earth Syst Sci. 2021;130(4):1157-1165. doi:10.1007/s12040-021-01713-z
CrossRef - Henry Pachecoa, Stephanie Díaz-López, Emilio Jarre, Henyerlin Pacheco, Williams Méndez EZ-L. Henry Pacheco.pdf. NO2 levels after COVID-19 lockdown Ecuador A trade-off between Environ Hum Heal. Published online 2020:6. doi:https://doi.org/10.1016/j.uclim.2020.100674
CrossRef - Bassim Mohammed Hashim, Saadi K. Al-Naseri, Ali Al-Maliki NA-A. Bassim Mohammed Hashim.pdf. Impact COVID-19 lockdown NO2, O3, PM2.5 PM10 Conc Assess air Qual Chang Baghdad, Iraq. Published online 2020:10. doi:https://doi.org/10.1016/j.scitotenv.2020.141978 0048-9697/© 2020
CrossRef


