

Introduction
Many organs and systems, especially the erythropoiesis, need iron as an essential nutrient to function and to grow properly. In fact, the Iron Deficiency (ID) and the Iron Deficiency Anemia (IDA) are among the most frequent morbid conditions that affect the public health in the world.1
Moreover, Anemia prevalence in the world is about 24.8% according to the World Health Organization and at any glomerular filtration rate (GFR) level, the Anemia still more common and more severe for diabetics than non-diabetic patients.2
By referring to the literature, we reveal that the earlier findings regarding the relationship between HbA1c and IDA still incoherent. In this context, some studies3 affirm that the reduced level of iron have a direct link with increased glycation of hemoglobin A1C (HbA1c) whereas other authors did not confirm this relationship between iron deficiency anemia and the HbA1c levels of anemic patients under control4, 6 or that the difference was insignificant as given in.5, 7
The study of Wenzel et al. revealed in 1962 the relationship between obesity and iron deficiency. They affirmed that the mean serum iron concentration in obese adolescents was significantly lower than in non-obese ones.8 These findings have been confirmed by several studies as like Micozzi et al.9 Their work shows that the BMI was inversely correlated with serum iron and positively with serum transferrin in women. They also showed that the transferrin concentration was significantly higher the BMI quartiles for both men and women.10
Furthermore, the prevalence of anemia in diabetics is twice as high as in non-diabetics.11 In fact, the authors in12 confirmed the association between IDA and A1 levels and the study13 has also demonstrated this relationship by measuring HbA1c values in non-diabetic patients with iron deficiency (Measurements are taken before and after iron treatment)
Finally, the etiology of obese people’s hypoferremia still unclear and an iron-poor diet could be suggested as a factor even if there is no advanced research done to establish the link between serum iron and dietary iron intake in obese adults.14 Obesity is considered as a chronic inflammation-mediated, the iron chelation in the reticuloendothelial system can result in hypoferremia despite adequate or even increased iron stores which plays a role in this disorder.15
We aim in this study to find out the correlation between iron deficiency and obesity among diabetic patients.
Materiels
Study Population
Our study concerns 114 diabetic patients from Oujda-ANGAD regional Reference Center. The average age of the patients is 63.2 ± 9.37 years.
The exclusion criteria includes pregnancy and any diabetes type other than type 2. More precisely, we consider in our study patients having the following conditions:
- Type 2 diabetes
- Age between 18 and 85 years.
- Duration of Diabetes > than one year
Ethics Statement
The consent was obtained from all participants before the start of this study. All data were collected and no personal identification was disclosed or compromised.
The protocol for this study was approved by the hospital ethic council board and the laboratory of Nutrition, Health and Environment, Biology department, Ibn Tofail University, Faculty of Sciences, Kenitra, Morocco.
Anthropometric Measurements
Height and body weight of diabetics patients were measured according to the recognized standards (with light clothing and without shoes). The body weight was measured by Mechanical column scale SECA 786 to the nearest 0.1 kg. While the Height was measured by the SECA 786 mechanical column scale to the nearest 0.1 cm .The diagnosis of obesity was based on the norms developed by the World Health Organization.
The BMI was classified to four categories16:
- Underweight: BMI < 18.5 kg/m2;
- Normal weight: 5 < BMI < 24.9 kg/m2;
- Overweight: 0 <BMI < 29.9 kg/m2;
- Obesity: BMI > 30.0 kg/m2.
Laboratory Measurements
After 12-h of fasting, we conduct a complete blood count using a Beckman Coulter LX-20 Auto-analyzer. The analyses include the iron, the serum iron and the hemoglobin for all patients in order to classify anemic patients following to the WHO criteria.17
In this work, we consider a patient as an anemic if his blood hemoglobin is: less than12 g/dL for females and less than <13 g/dL for males. Moreover, the measurement of serum ferritin is done using the ELISA kit (Enzyme-Linked ImmunoSorbent Assay). Furthermore, the Turbidimetric immuno-inhibition was used to measure the HbA1c levels using the AIA 360 Tosoh Automated Immuno Assay Analyser.
Statistical Methods
The statistical analysis of different results was obtained using SPSS software (version 20). We analyzed data using the following descriptive statistics:
- For quantitative variables: mean, standard deviation and median values,
- For qualitative values: number and percentage.
In other hand, we tested the frequencies between the groups by Chi Square test and independent sample t test for qualitative variables. Moreover, we used correlations in order to test the linear relations between variables.
The differences were considered:
- Significant when p <0.05,
- Highly significant when p <0.01,
- And very highly significant when p <0.001.
Results
114 diabetic patients were participated in this study. The distribution of patients was as follows: 76 women (66.66%) and 38 men (33.33%). The mean ferritin levels were 13.63 ± 5.9 for males and 12.65 ± 4.3 for females, respectively and the mean of serum iron levels were 46 ± 4.2. Moreover, the median duration of BMI for diabetic patients was 27.29 ± 5.59 and the duration of diabetes diagnosis ranged from 6 months to 41 years with an average of 11 years.
Table 1 shows the characteristics of the patients which are summarized as follows: 36.84% of women are overweight and 39.47% are obese. In contrast, the average age in the normal weight group was 59.67 ± 9.09 years. However, the average age was 61.79 ± 10.54 years in the obesity group.
In our study, anemia was classified as a hemoglobin level lower than 11g/dL in accordance with the.18 In this context, the mean Hemoglobin at the time of diabetes diagnosis was higher in men than in women. (13.28 ± 2.27; 12.34 ± 2.23; P>0.5). Moreover, the Ferritin concentrations were higher among men than women (18.71 ± 20.02; 15.61 ± 10.63; P>0.5) respectively. Finally, no significant relationship was observed between sex, ferritin, hemoglobin, age, weight and serum iron level.
Table 1: Repartition by gender of basic demographic and laboratory information.
| Parameters | Female (%) | Male (%) | P (value) | Test Used | |
| (n=76) | (n=38) | ||||
| Weight group | Underweight | 10.66 | 7.9 | 0.72 | Chi-Square Test** |
| Normal weight | 24 | 21.05 | |||
| Overweight | 37.33 | 31.58 | |||
| Obesity | 28 | 39.47 | |||
| Age (Y) | 20-39 | 1.15 | 0 | 0.23 | Chi-Square Test |
| 40-56 | 18.40 | 33.33 | |||
| >60 | 80.45 | 66.67 | |||
| Hemoglobin (g/dl) | Mean ± SD* | 12.34 ± 2.23 | 13.28 ± 2.27 | 0.98 | Student’s Test |
| Anemia(g/dl) | Yes | 46.55 | 41.02 | 0.9 | Chi-Square Test |
| No | 53.45 | 58.98 | |||
| Ferritin level (µg /l) | <15 | 74 | 59.22 | 0.54 | Chi-Square Test |
| >15 | 26 | 40.78 | |||
| Serum iron level (µg /dl) | <60 | 31.34 | 34 | 0.25 | |
| >60 | 68.66 | 66 |
*SD: Standard Deviation; ** X2: Chi-Square Test
The results obtained shows that 79,069% of the patients are obese, moreover 11,62% of the overweight patients suffered from anemia. In fact, the prevalence of ID was significantly higher in overweight and obese diabetes patients than normal weight people. The prevalence of ID in female patients was respectively 40%, 45.3% and 2.7% for obese, overweight and normal weight cases.
Furthermore, a significant relationship was found between iron deficiency and BMI (p<0.001)). Indeed, the mean serum iron level in the normal-weight BMI group (158.2±33.38μg/dl) was higher than that ones in group with overweight (54.54±35.07μg/dl) and the group with obesity (12.65±57.05μg/dl) (Table2).
Table 2: Hemoglobin and iron status according to age and sex.
| UnderWeight | Normal weight | Overweight | Obesity | P (value) | Test Used | ||
| Age (Year) | 20-39 | 0 | 0 | 2.5 | 0 | 0.72 | Chi-Square Test* |
| 40-56 | 42 | 42.3 | 12.5 | 18 | |||
| >60 | 58 | 57.69 | 85 | 82 | |||
| Sex | Female | 72.72 | 69.23 | 72.72 | 58.33 | 0.23 | Chi-Square Test* |
| Male | 27.27 | 30.76 | 27.27 | 41.66 | |||
| Ferritin (µg /l) | % <15 | 12 | 2.7 | 45.3 | 40 | 0.000 | Chi-Square Test* |
| Mean ± SD* | 16.96 ± 1.37 | 21.81±1.64 | 29.91± 3.15 | 31.77±1.39 | 0.000 | Student’s Test | |
| Hemoglobin Level (g/dl). | Anemia level | 9.3% | 0 | 11.62 | 79.069 | 0.000 | Chi-Square Test* |
| Mean ± SD* | 11.34 ± 4.01 | 14.2±2.05 | 12±2.005 | 12.93±1.64 | 0.000 | Student’s Test | |
| Serum iron level (µg /dl) | % <60 | 11 | 24 | 34 | 31 | 0.000 | Chi-Square Test |
| Mean ± SD* | 74.20 ± 54.59 | 158.2±33.38 | 54.54±35.07 | 124.65±57.05 | 0.000 | Student’s Test | |
| CRP (mg/dl) | Mean ± SD* | 10.36 ± 9.6 | 8.9±3.9 | 8.95±6.7 | 9.14±7.09 | 0.53 | Student’s Test |
The data are represented as the percentages unless otherwise specified.
*SD: Standard Deviation.
** Chi-square test.
In other hand, a negative association was observed between plasma ferritin and BMI (r= – 0.84; R²= 0.705; p <0.001) as being the case for iron (r =- 0.245; R²= 0.06; p<0.01) and Hemoglobin level (r= – 0.27; R²= 0.72; p <0.01) respectively.
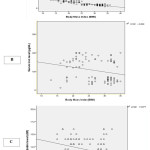 |
Figure 1: Correlation of BMI with iron parameters: (A) Ferritin level, (B) Serum Iron level (BMI), (C) Hemoglobin level. |
Table 3: Odds ratios (95% confidence intervals) of risks factors for association with plasma ferritin or serum iron levels.
| Variables | Plasma ferritin <15 µg/l | Serum iron <60 µg/dl |
| Total | Total | |
| Female vs. Male (sex) | 1.03 (0.78-1.36) | 0.84 (0.48-1.36) |
| Age Group (years) | ||
| 40-56vs20-39 | 1.7(1.2-2.53) | 0.8(0.4-1.51) |
| 20-39vs65 | 1.3(0.89-1.91) | 0.8(0.4-1.51) |
| Weight (Kg) | ||
| Under vs. Normal | 0.47 (0.07-0.23) | 0.31 (0.08-1.15) |
| Over vs. Normal | 0.04(0.06-0.3) | 0.39 (0.18-0.83) |
| Obese vs. Normal | 0.23 (0.25-0.45) | 0.7 (0.6-0.83) |
Discussion
The overweight and obesity reach alarming rates. Moreover, the prevalence of obesity increases with age, from 18% for the age group (40-56 years) to 82% For older subjects (>60 years).
In contrast, other similar studies19 have shown that obesity increases with age, but this increase is not the same for men and women. In fact, it is higher in women aged 20 to 30 and it peaks at 50.20
In this study, we showed that Hemoglobin Level (Hb) values are normal in obese patients, with a mean (12.34dl/l±2.23) and (13.28dl/l±2.27) in the female and male groups respectively. Another study was done, on the same subjects, by Cepeda- Lopez et al21 confirms our results. This study also found normal Hemoglobin Level (Hb) values in obese patients with an average of 13.7dl/l and 13.5dl/l in the female and male groups respectively. However, no difference according to the gender is observed in ferritin values among obese patients.
In addition, similar studies have shown that women suffer the most from iron deficiency. These results may be explained by menstrual periods which, in some cases, lead to a significant blood loss and therefore constitute a risk of anemia. A previous study reported that higher ferritin values are observed in obese male adolescents due to the effect of testosterone.22
Based on Pearson correlation coefficient, the figure above (Figure 1) shows a negative significance between Body Mass Index and Plasma ferritin, Serum iron level and hemoglobin level. This result remains in accordance with the research study guided by Lecube et al.23 Indeed, the authors in23 showed a negative correlation between the Body Mass Index and both serum iron level and hemoglobin (r= – 0.075, P>0.05) and (r= -1.24, P>0.05) respectively. Furthermore, the results presented in (Table2) show a very significant relationship between the BMI and the ferritin values (P<0.001).
Accordingly, Zhao et al have shown similar results in their meta-analysis.24 They have shown iron serum and transferrin level are very high in the obese persons. However, a positive correlation between the Body Mass Index and ferritin is detected by Yanoff et al25 but the role of iron deficiency in obesity remains unclear.
In general, iron deficiency in obese patients could be the result of low iron consumption, a low availability in the small intestine, or an increased need for iron due to a large volume of blood.26 Further studies affirm the relationship between obesity and the C-reactive protein (CRP) concentration and the study.27 Shows that the concentration of CRP decreases significantly after a significant weight loss. In our study, the results obtained show that 66.04% had positive CRP concentration with positive correlation to the Body Mass Index (BMI). Furthermore, obesity is associated with a chronic low grade inflammation state. The sequestration of iron through an inflammatory mediated mechanism can lead to iron deficiency.28 In fact, the authors stated that there was a high correlation between inflammation and adiposity that increased dramatically with BMI. The prevalence in normal, overweight, and obese women are respectively (20.1%, 37.6%, and 68.4%; P < 0.001).
Conclusion
We can conclude that the relation between overweight and iron deficiency depends mainly on the indicator used to establish such relationship. Additionally, overweight and obesity could be a risk factor of iron deficiency in diabetic patients.
Limitations
It is necessary to show up some limitation: limited sample size due to the lack of funding as all biochemical analysis were done on our charges.
Another limitation is that the study was carried out in the regional referral Center of Oujda-Angad-Morocco. This may bias the prevalence of diabetes in this study compared to the general population.
Significance for Public Health
This work investigates the relation between the iron deficiency and obesity among diabetic patients in oriental Morocco and more precisely in Oujda-Angad region.
To the best of our knowledge, this is the first study to be conducted in this regional epidemiological Center.
To this end, the study focuses on the determinants of iron deficiency and obesity, related to diabetic patients, in order to prevent severe complications.
Acknowledgement
All authors approved the final manuscript as submitted and agree to be accountable for all the work aspects.
Conflict of Interest
The authors declare that there is no conflict of interest regarding the publication of this paper.
References
- WHO and UNICEF.Focusing on anemia towards an integrated approach for effective anemia control. Geneva: World health organization; 2004. https://urlz.fr/bXZZ. Accessed 2004
- Kengne A.P, Czernichow S, Hamer M et al. Anemia, Hemoglobin level and cause specific mortality in people with and without Diabetes. PLoS ONE.2012; 7(8):e41875.
- Worldwide Prevalence of Anemia 1993-2005: WHO Global Database on Anemia. World Health Organization, 2008. https://urlz.fr/bY00 . Accessed 2008.
- Mitchell T.R, Anderson D, Shepperd J.Iron deficiency, hemochromatosis, and glycosylated hemoglobin. Lancet. 1980 Oct 4; 2(8197):747.
- Gram-Hansen P, Eriksen J et al. Glycosylated hemoglobin (HbA1c) in iron and vitamin B12 deficiency. J Intern Med. 1990 Feb; 227(2):133-6.
- Ford E.S, Cowie C.C et al. Iron deficiency anemia; Non iron deficiency anemia and glycated hemoglobin A1c among adults in the US. J Diabetes. 2011; 3(1):67-73.
- Saudek C.D, Herman W.H, Sacks D.B, Bergenstal R.M, Edelman D, Davidson M.B. A New Look at Screening and Diagnosing Diabetes Mellitus; The Journal of clinical endocrinology and metabolism. 2008; 93 (7): 2447-53.
- Wenzel B.J, Stults H.B, Mayer J. Hypoferremia in obese adolescents. 1962;18; 2(7251):327-8
- Micozzi M.S, Albanes D et al. Relation of body size and composition to clinical biochemical and hematologic indices in US women and men .Am J Clin Nutr. 1989 Dec; 50(6):1276-81
- Stevens P.E, O’Donoghue D.J and Lameire N.R. Anemia in patients with diabetes: unrecognised, undetected and untreated? Current Medical Research and Opinion, 2003.19 (5): 395-401.
- Lavanya Rajagopal,Sundaram Arunachalam, Shivashekar Ganapathy, Balaji Ramraj ,Veena Raja.A comparison of Effect of Iron Deficiency Anemia on HbA1c Levels in Controlled Diabetics and Non-diabetics:A Cross Sectional Analysis of 300 Cases, Annals of Pathology and Laboratory Medicine.2017;04(02): A 212-218
- Musa Abdelhaleem Alahaj Musa1, Nassr Eldin M. A. Shrif2 and Abdelgadir Eltom. Impact of iron deficiency anemia on heamglobina1c level among sudanese patients; European Journal of Biomedical AND Pharmaceutical sciences. 2018, 5(2) 1071-1073.
- Wenzel B.J, Stults H.B et al.Hypoferremia in obese adolescents. Lancet 1962 Aug 18;2(7251):327-8
- Bezwoda W.R, Bothwell T.H et al;The relationship between marrow iron stores ,plasma ferritin concentrations and iron absorption; Scand J Haematol 1979 Feb;22(2):113-20.
- Greenberg A.S,Obin M.S .Obesity and the role of adipose tissue in inflammation and metabolism; Am J Clin Nutr. 2006 Feb; 83(2):461S-465S.
- Sperrin M,Marshall A.D, Higgins Vet al .Body Mass Index Relates Weight to Height Differently in Women and Older Adults: Serial Cross-Sectional Surveys in England (1992–2011). Journal of Public Health, 2016; 3(38):607-13.
- Report of a WHO Expert Committee, Physical status: the use and interpretation of anthropometry. World HealthOrgan Tech RepSer. 1995; 854:1-452.
- World Health Organization(WHO). Haemoglobin concentrations for the diagnosis of anaemia and assessment of severity. Vitamin and Mineral Nutrition Information System. Geneva, Switzerland: World Health Organization; 2011.(WHO/NMH/NHD/MNM/11.1; http://www.who.int/vmnis/indicators/haemoglobin.pdf, accessed 1 December 2012).
- Jeon Y.J., Jung I.A., Kim S.H., et al .Serum ferritin level is higher in male adolescents with obesity: results from the Korean National Health and Nutrition Examination Survey 2010.Ann PediatrEndocrinolMetab. 2013; 18(3):141-7.
- Ofori-Asenso R, Agyeman A. A., Laar A, and Boateng D. Overweight and obesity epidemic in Ghana – A systematic review and meta-analysis;BMC Public Health, 2016;16(1)1239
- Cepeda-Lopez A.C., Aeberli I, Zimmermann M.B. Does Obesity Increase risk for Iron Deficiency? A review of the literature and the potential mechanisms.International journal for vitamin and nutrition research.2010; 80(4-5):263-70.
- Jeon Y.J.,Jung I.A.et al. Serum ferritin Level is higher in Male Adolescents with Obesity: Results from the Korean National Health and Nutrition Examination Survey 2010. Annals of pediatric endocrinology & metabolism.201318(3):141-7
- Lecube A et al ; Iron Deficiency in Obese post-menopausal women. Obesity. 2006;14(10):1724–30
- Zhao N et al;Iron regulation by hepcidin.JClin Invest.2013;123(6):2337-43
- Yanoff L.B.,Menzie C.M.et al; Inflammation and Iron deficiency in the hypoferremia of Obesity.2007; 31(9):1412–1419.
- Gartner A, Berger J, Bour A et al; Importance of correcting serum ferritin concentrations for inflammation.The American Journal of Clinical Nutrition, September 2013, 98 (3) :821–826.
- Alam F, Fatima F, Orakzai S, Iqbal N, Fatima ;Elevated levels of ferritin and hs-CRP in type 2 diabetes. SS J Pak Med Assoc. 2014 Dec; 64(12):1389-91.
- Gartner A, Berger J, Bour A et al; Importance of correcting serum ferritin concentrations for inflammation.The American Journal of Clinical Nutrition, September 2013, 98 (3) :821–826.

This work is licensed under a Creative Commons Attribution 4.0 International License.


