


Abstract
We report the structural and magnetic study of Cr-doped Bi2Se3 thin films using x-ray diffraction (XRD), magnetometry and polarized neutron reflectometry (PNR). Epitaxial layers were grown on c-plane sapphire by molecular beam epitaxy in a two-step process. High-resolution XRD shows the exceptionally high crystalline quality of the doped films with no parasitic phases up to a Cr concentration of 12% (in % of the Bi sites occupied by substitutional Cr). The magnetic moment, measured by SQUID magnetometry, was found to be  per Cr ion. The magnetic hysteresis curve shows an open loop with a coercive field of
  . The ferromagnetic transition temperature was determined to be
  analyzing the magnetization-temperature gradient. PNR shows the film to be homogeneously ferromagnetic with no enhanced magnetism near the surface or interface.
Export citation and abstract BibTeX RIS

Published by the EPLA under the terms of the Creative Commons Attribution 3.0 License (CC BY). Further distribution of this work must maintain attribution to the author(s) and the published article's title, journal citation, and DOI.
Introduction
Recently, the quantum anomalous Hall (QAH) effect [1] was experimentally observed at zero magnetic field in chromium-doped (Bi, Sb)2Te3 [2], a magnetic, three-dimensional topological insulator (TI) with a Curie temperature of  . The quantized Hall resistance
  is directly given by a topological characteristic of the band structure called the first Chern number. Also, higher-Chern-number QAH insulators have been proposed with Cr-doped Bi2(Se, Te)3 being a candidate [3]. Breaking time-reversal symmetry (TRS) of a suitable TI by introducing ferromagnetic order opens a band gap around the Dirac point [4–6], leading to the QAH effect.
It has been experimentally challenging to achieve long-range ferromagnetic ordering in the bulk of Bi and Sb chalcogenides. Earlier work focused on their use as dilute magnetic semiconductors, [7] and successful ferromagnetic doping with, e.g., Mn [8–10] and Fe [11], has been reported in thin film and bulk samples. Cr doping has been predicted to lead to an insulating ferromagnetic ground state in Bi2Se3 [1,12], as required for the QAH effect, whereas Mn and Fe doping leads to a metallic state [13]. Most importantly, Cr3+ is incorporated by substituting for isoelectronic Bi3+, thus not adding additional charge carriers to the system. Cr-doped Bi2Se3 and Bi2Te3 bulk crystals have been successfully grown, and for  (in CrxBi2−xSe3) antiferromagnetic order has been observed with Cr being divalent and having a magnetic moment of
  [14]. However, in thin films, and for Cr concentrations of < 5% (in Crx(Bi2Se3)1−x), magnetic long-range order has been reported up to 20 K [15]. For Cr-doped Sb2Te3 [16], long-range ordering of the magnetic ions was proposed to be through the local valence electrons (van Vleck mechanism) [1]. However, experimental data obtained for Cr:Bi2Te3 could not fully support this claim [17].
Here, we present a structural and magnetic study of Cr-doped, n-type Bi2Se3 thin films grown by molecular beam epitaxy (MBE) in the high doping limit using x-ray diffraction (XRD), magnetometry and polarized neutron reflectometry (PNR).
Sample preparation and characterization
Thin film growth
MBE was used to prepare (CrxBi1−x)2Se3 thin films (thickness  ) on c-plane sapphire substrates. The MBE chamber has a base pressure of
  . A standard effusion cell was used to grow with an elementally pure source of Bi (6N) and a high-temperature cell for Cr (5N). Se (6N) was evaporated from a cracker cell, with the cracker zone held
  higher than the bulk zone temperature. Samples were grown with a Se overpressure and a corresponding Bi : Se ratio of 1 : 10. Growth is limited by the Bi flux which was set to a beam equivalent pressure (BEP) of
  , leading to a growth rate
  .
.
The films were grown via a two-step process involving first the deposition of a 10-nm-thick low-temperature Bi2Se3 seed layer at  . Then, the temperature is raised to
  for the growth of the Cr-doped material. The sample was then slowly ramped down to room temperature under a residual background of Se, reducing defect formation.
Reflected high-energy electron diffraction (RHEED) images taken during growth show a sharp streaky pattern indicative of 2D growth (fig. 1(a)). The 3-fold symmetry of the pattern is visible upon rotation. The ratio of spacings between the RHEED images taken with an azimuthal rotation of 30° with respect to each other is  , indicative of the
  space group of the material. Atomic force microscopy (AFM) imaging shows a spiral growth mode and an overall flat surface (RMS roughness
  ) with the c-axis out-of-plane (fig. 1(c)).

Fig. 1: (Color online) (a) RHEED image of a 42-nm-thick (Cr0.12Bi0.88)2Se3 film recorded at the end of growth along the ![$[10\bar{1}0]$](https://content.cld.iop.org/journals/0295-5075/107/5/57009/revision1/epl16529ieqn18.gif) azimuth of the c-plane sapphire substrate. A streaky pattern is visible indicative of 2D growth. (b) RHEED taken along the
azimuth of the c-plane sapphire substrate. A streaky pattern is visible indicative of 2D growth. (b) RHEED taken along the ![$[11\bar{2}0]$](https://content.cld.iop.org/journals/0295-5075/107/5/57009/revision1/epl16529ieqn19.gif) azimuth. (c) AFM of the grown film showing 3-fold symmetric spiral growth with quintuple layer steps expected from Bi2Se3.
azimuth. (c) AFM of the grown film showing 3-fold symmetric spiral growth with quintuple layer steps expected from Bi2Se3.
Download figure:
Standard imageStructural characterization
X-ray diffraction (XRD) and rocking curves were obtained on a x-ray diffractometer with a Cu anode ( ). It is found that even with the relatively high doping of
  used here the crystalline quality remains good, in contrast to that reported in ref. [15], whose authors find a significant peak broadening at a similar doping level. XRD shows peaks of the
  family for Bi2Se3 with a measured lattice parameter, c, of
  for undoped Bi2Se3 and
  for (Cr0.12Bi0.88)2Se3, in close agreement with the expected value of 28.636 Å for Bi2Se3 (ICSD 617072) [18]. A slight reduction in the c-axis lattice constant was observed for films with
  , which is in contrast to earlier reports of Cr-Bi2Se3 with similar Cr doping concentrations [15], but is consistent with fully substitutional doping due to the smaller ionic radius of Cr compared with Bi. It is found that with higher-percentage doping of Cr
  an additional parasitic phase forms, as observed by XRD (not shown). Reference [15] attributes an increase in the c-axis to Cr clusters in the van der Waals gap. Since no such increase is seen here we determine there to be no evidence of the formation of Cr clusters [19].
Rocking curves were measured of the (006) peak of Bi2Se3 (fig. 2, inset). The reference Bi2Se3 film shows a FWHM of  , increasing to
  for the Cr-doped film with
  . It is anticipated that, similarly to other dopants into this material system, Cr substitutes on the Bi site, although some may also occur intercalated into the van der Waals gap, increasing the disorder in the c-axis and causing the increase in the measured FWHM. This increase in FWHM is, however, significantly lower than that seen by others [15]. This, combined with the absence of change in the c lattice parameter, strongly indicates that Cr is incorporated substitutionally on the Bi site, since interstitial defects would generally alter the lattice parameter.

Fig. 2: (Color online) X-ray diffraction of a Cr-doped film with  ((CrxBi1−x)2Se3) thin film (red) and reference Bi2Se3 film (black). Inset: rocking curve of the (006) peak of Bi2Se3.
Download figure:
Standard imageRutherford back-scattering spectrometry (RBS) was used for accurate determination of film thickness and dopant concentrations. The thickness of the sample used for the neutron experiments is determined to be  . The total peak areas for Cr, Bi and Se are measured as
  ,
,  and
and  , respectively, from which the concentrations are calculated to
  at% for Cr,
  at% for Bi, and
  at% for Se, resulting in a chemical composition of (Cr0.12Bi0.88)2Se3.
Magnetometry
The magnetic properties of the Cr-doped films were investigated using SQUID magnetometry and PNR. Measurements of the magnetic hysteresis, M(H), and the temperature dependence of the magnetization, M(T), were carried out in a Quantum Design MPMS XL and SQUID VSM, respectively. PNR measurements were performed on the PolRef beamline at the ISIS neutron and muon source of the Rutherford Appleton Laboratory.
Figure 3(a) shows the magnetic moment per Cr ion for a 103-nm-thick Cr-doped film with  measured at
  as a function of the applied field perpendicular to the c-axis (i.e., in-plane). The linear diamagnetic contribution of the sapphire substrate has been removed by subtracting a linear fit to the high-field region (not shown). An open loop is seen with a coercive field of
  , indicative of ferromagnetic ordering. The loop closes at
  , above which a continuous reorientation of the magnet moments is observed. Saturation is reached at
  . The measured saturation magnetization of
  is smaller than the moment of
  expected for a free Cr3+ ion (with quenched orbital moment). Our observation is in close agreement with earlier work by Haazen et al. [15], who found a moment of
  for concentrations of 5% (in Crx(Bi2Se3)1−x).
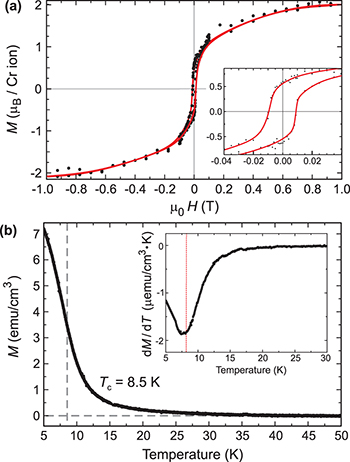
Fig. 3: (Color online) (a) Magnetization curve, M(H), of a (Cr0.12Bi0.88)2Se3 thin film measured at 2 K with the field in-plane. Inset: detail showing an open loop with  . The red lines are a guide for the eye. (b) Temperature dependence of the magnetization, M(T), measured in an applied in-plane field of 10 mT. Inset: plot of the differentiated M(T) curve, suggesting a
  of 8.5 K.
Download figure:
Standard imageFigure 3(b) shows the magnetization measured as a function of temperature upon heating under an applied field of  from 5–50 K. The sample was cooled in zero field. The diamagnetic background (taken to be T independent) has been subtracted from the data.
  is extracted from the data using the first derivative of the smoothed M(T) (see inset). The ferromagnetic-to-paramagnetic phase transition occurs over a broad temperature range. The Curie temperature is determined to be 8.5 K from the minimum point of the differentiated data (red dashed line).
Polarized neutron results
PNR was used to extract the structural and magnetic depth profile for the  sample. A field of 0.7 T was applied in the plane of the sample, parallel to the quantization axis of the neutron spin. Reflectivity curves for the two neutron spin eigenstates were measured without polarization analysis. Model fitting was carried out using an optical transfer matrix approach [20] and a differential evolution fitting algorithm using the GenX package [21]. Measurements were carried out at 5, 15, and 50 K.
The model shows a high-quality structural profile with densities within 6% of the nominal value for the doped layer and fixed to the nominal value for the buffer layer. The Cr concentration was fixed to the value determined by RBS measurements. Interface roughnesses were less than 6 Å for the sapphire and below a measurable limit for the surface. The interface between the buffer layer and the doped layer is ill-defined in the fits and transitions gradually over 3.3 nm. The buffer layer thickness was allowed to vary but converged at 17.5 nm, close to the expected value. To allow for variations in the magnetization depth profile the magnetic layer was split into several layers, two for the final model but more were tried without significantly improving the quality of fit.
The reflectivity data, spin asymmetry and corresponding model for the 5 K measurements are shown in fig. 4(a)–(c). All fit attempts returned a uniform magnetization profile with a gradual transition between the buffer layer and the doped layer and an even magnetization up to the surface. The moment at 5 K was estimated at  which agrees well with the SQUID results at the same field (0.7 T) and temperature.
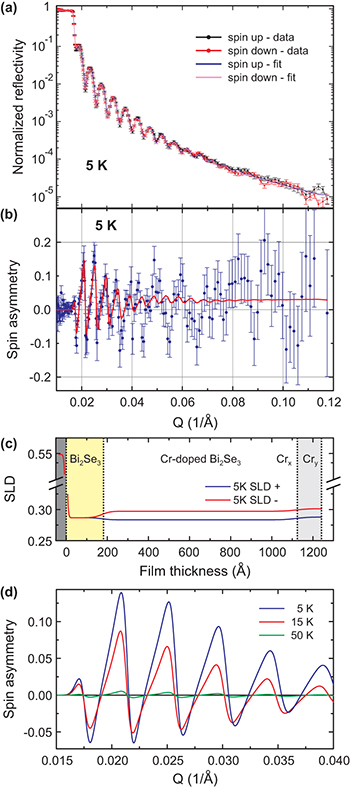
Fig. 4: (Color online) Polarized neutron reflectometry obtained in an applied field of  at a temperature of 5 K, showing the normalized reflectometry (a) and spin asymmetry (b) as a function of momentum transfer. The solid line is the best-fit calculation for the model described in the text. (c) Model of the scattering length density (SLD) at 5 K for the layered thin-film system, consisting of substrate (dark gray), Bi2Se3 buffer layer, and two Cr-doped top layers which have Cr concentrations of x and y, respectively. (d) Plots of the fitted spin asymmetries at 5 K, 15 K, and 50 K.
Download figure:
Standard imageNo enhancement of the magnetization in the surface region was found. Simulations assuming a thin surface layer with an enhanced magnetization showed that it manifests itself as a constant splitting of the two reflectivity curves at higher wave vector transfer  . The magnitude of the splitting is determined by the magnitude of the magnetization in the surface layer and the onset of splitting in Q is determined by the thickness of the layer. Our data shows no such splitting even at the highest Q values measured here. From this we conclude that there is no surface-enhanced layer within our detection limit of around 5 Å and a magnetization enhancement from
  to
to  assuming a constant Cr concentration of
  . Transport measurements [15] were able to rule out the possibility of magnetic clusters but could not inform the discussion on any surface enhancement. Our results unambiguously show that a near-surface modification to the polarization is not present.
For higher-temperature data, only the magnetization was allowed to vary with the structural parameters remaining fixed. At 15 K there is some remaining magnetization and the model indicates a higher magnetization in the bulk of the film (about  ) and a region near the surface where the magnetization is significantly diminished. The best-fit values are 13.5 nm for the top layer and
  in that region, but the exact extent of this region has a significant error as there is some correlation between the top layer thickness and the size of the magnetic moment. However, the finding of a reduced top layer region appears robust. 15 K is above, but not far away from, the Curie temperature of the sample. The remaining magnetization at 15 K is most likely induced by the large applied field during the PNR measurement and the proximity to
  . At 50 K the magnetic order has almost completely vanished. Figure 4(d) shows the model spin asymmetries for all three temperatures.
The magnetic moment of Cr in saturation obtained from magnetometry of  (at 2 K, SQUID) is less than the calculated moment of
  for Cr substitutional on Bi sites [22] but in good agreement with the moment obtained using polarized neutron reflectometry. For interstitial Cr the moment is
  , whereby both values have been calculated in a surface environment [22]. The magnetic moment of Cr2+ ions in the low-spin configuration is
  ; however, this requires an octahedral crystal field larger than
  [23]. Further, the "missing moment" could also be due to the presence of Cr that does not contribute to the long-range ferromagnetically ordered phase, but instead an antiferromagnetic or paramagnetic phase with the same crystal structure, or Cr being in a different valence state. In-depth magnetic studies that allow the determination of the valence state and moment of the Cr ions, such as x-ray magnetic circular dichroism, are needed to resolve this open question. The observed ferromagnetic ground state is a required precursor to observing the QAH effect in this system. Further studies of magnetic order at lower temperatures (
 ) [2] will further elucidate the nature of the magnetic ground state in the QAH regime.
Summary and conclusions
In summary, we found that Cr doping into Bi2Se3 thin films is possible up to a Cr concentration of 12% without loss of crystalline quality and formation of secondary phases. The lattice parameters of the films are consistent with substitutional doping of the Cr. A saturation moment of  was found, which is lower than the expected full, orbitally quenched moment for Cr3+. The magnetization loop is dominated by a ferromagnetic open loop with a small coercive field of
  and a
and a  of
of  . PNR showed that the ferromagnetism is prevalent throughout the film with no evidence of an enhanced surface magnetic layer. Gaining a deeper understanding of the magnetic behavior of these films will allow material advances to further increase the Curie temperature, thereby paving the way for low-power electronic applications of TIs in the future.
Acknowledgments
This publication arises from research funded by the John Fell Oxford University Press Research Fund. We thank ISIS for neutron beamtime (RB1320531), Diamond Light Source for AFM and XRD access, and RCaH for their hospitality. LCM and PS acknowledge partial financial support from EPSRC, and PS also from the Studienstiftung and Corpus Christi College. SEH acknowledges DARPA's MesoDynamic Architectures Program (No. N66001-11-1-4105) and VPGE (Stanford University).