

The English special hospitals constitute a national tertiary health service for the treatment of people with a mental disorder who are detainable under the Mental Health Act 1983 (MHA) and judged to pose an imminent risk of causing serious harm to others and thus also to need high security. More than 90% of admissions have had previous psychiatric treatment (Taylor et al, 1998). The health services in England and Wales also provide for assessment and treatment of such patients, where possible, in specialist medium-security units and, where risk is judged to be lower still, in ordinary psychiatric hospitals and within community mental health services. The Department of Health, the Special Hospitals' Service Authority (SHSA) and each special hospital have successively devised a check-list, setting out more detailed criteria for admission. Each person referred is assessed by a consultant psychiatrist from the relevant special hospital, and the completed assessment and recommendation put to a multidisciplinary panel for decision. Until 1989 this was in the Priority Care Division at the Department of Health; for a transitionary period (1990-1993) there were panels at each hospital and an SHSA audit and arbitration panel; since 1994 panels have been exclusively hospital-based.
1986-1995, a time of change for the services
During the study period, a number of events occurred with potential for influencing management and treatment of people in these services and elsewhere. In particular, the MHA was implemented (mostly, by the end of 1984). It introduced orders from the Criminal Courts for remand detention in hospital.
There were great changes in management for the special hospitals; direct management by the Department of Health gave way to management by a new special health authority (the SHSA) during 1990-1996 and then (April 1996) by a special health authority for each hospital, with purchasing by the High Security Psychiatric Services Commissioning Board of the National Health Service Management Executive.
Catchment areas for the hospitals were introduced in 1989, and fully implemented in 1990. Also in 1990, the Home Office mounted an initiative to ensure that, as far as possible, mentally disordered offenders should be assessed and treated in the health service rather than in prison (Home Office, 1990). A major interdepartmental review of services for such people followed (Department of Health & Home Office, 1992). In addition, there was specific consideration of high-security services, which was intended to have impact on all psychiatric and social services (Department of Health, 1994). In part, this followed from the Report of the Committee of Inquiry into Complaints about Ashworth Hospital (Blom-Cooper, 1992). The interdepartmental review, in making recommendations about the future of the service, made calculations based mainly on one year's figures (1992/93). This present paper and its companion (pp. 260-265, this issue) consider the position over 10 years.
METHOD
Referrals
Data relating to referral episodes for a bed in a special hospital between 1986 and 1988 were taken from reports published by the then Department of Health & Social Security (Department of Health and Social Security, 1987-89). Between 1989 and 1992, the central research unit at the SHSA collected data from each hospital as referrals were received, and re-checked with each medical records department (Special Hospitals' Service Authority, 1990-93). Aggregate data for the period 1993-95 were provided by the three medical records departments. There was a lack of conformity over the counting of referrals for a second opinion (and not necessarily only for a bed), both over time and between sites. Data were not available for the individual numbers of people referred.
Admissions
The admissions data were extracted from the special hospitals' case register. This is a research database containing information on everyone admitted to a special hospital since 1972, and a census of in-patients resident through 1976. The former is obtained from three sources at the time of admission - the medical records department at each hospital, the patient's clinical file, and interviews with consenting patients. Certain data, principally demographic data, are collected from each source and used to test reliability (Gunn et al, 1977).
Most people offered a special hospital bed are admitted. A few are not, for a variety of reasons, including: alternative accommodation being found at a lower level of security; (for those appearing in court) a ‘not guilty’ finding, or rejection of a recommendation for a mental health disposal. Data presented here relate only to actual admission episodes.
Organisation of data
MHA classifications of mental disorder at admission were used. Some people were classified under more than one head, but as subgroups involving multiple classifications were very small, the classification used for analysis was reordered, as in Table 1. In a special hospital sample, (severe) mental impairment loosely equates with a diagnosis of (severe) mental retardation; psychopathic disorder with personality disorder; and, although a slightly more flexibly used category, 88% of ‘mental illness’ is accounted for by psychosis (Taylor et al, 1998).
Table 1 Classifications of mental disorder used for analysis
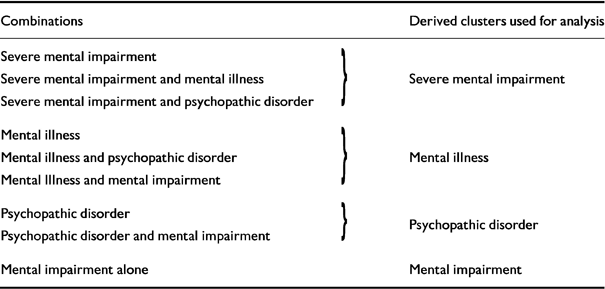
| Combinations | Derived clusters used for analysis |
|---|---|
| Severe mental impairment | } Severe mental impairment |
| Severe mental impairment and mental illness | |
| Severe mental impairment and psychopathic disorder | |
| Mental illness | } Mental illness |
| Mental illness and psychopathic disorder | |
| Mental Illness and mental impairment | |
| Psychopathic disorder | } Psychopathic disorder |
| Psychopathic disorder and mental impairment | |
| Mental impairment alone | Mental impairment |
Offending types of behaviour relating to the admission were also grouped for analysis, into: homicide, non-fatal violence, sexual offending, property damage, other offences, and behaviour not leading to criminal conviction. In cases of more than one offence, the most serious offence decided the grouping. In most cases, grouping of offence will be obvious; arson/firesetting was included in the property category, unless personal harm ensued. Legal terminology tends to be rather parochial, so we have attempted to use terminology throughout the paper which is descriptive of the nature of the legal detention used. A brief glossary is also included in an Appendix.
With respect to the type of detention, the very few cases admitted under the Criminal Procedure (Insanity) Acts 1964 and 1991 (n = 45; 2.4%) are included for analysis with hospital order cases, that being the effect here of this legislation.
Regional health authority population figures were provided by the Department of Health, Statistics Division. No one under the age of 16 was admitted to a special hospital during the study period. Because over 99% of special hospital patients were aged between 16 and 64, this was the age band adopted from general population figures.
Analysis
STATA 5 (StataCorp, 1997) was used to analyse the data. Proportions were analysed using logistic regression. For trends in absolute numbers of episodes over the 10-year period, Poisson regression and robust standard errors were used. This technique is similar to Poisson regression, but allows for any extra Poisson variation due to lack of independence in the data, which may occur where there are several episodes for a single patient. For all analyses, the year (1986 to 1995) was fitted as a linear trend. Trends over the 10-year period are expressed as rate ratios per year and their 95% confidence intervals (95% CIs).
RESULTS
Referrals
There were 3521 referral episodes mostly from England and Wales. Table 2 shows that there was consistency between teh years within each period of data collection. There may have been a real increase in referrals since 1993, but the fact that the threshold for recording was probably lowered means we cannot be certain. There certainly seems to have been no decline.
Table 2 Referrals and acceptances to special hospital by Mental Health Act classification 1986-1995

The population-adjusted referral rates are shown by health region in Table 3 for England only, again for 1986-1992 and 1993-1995 separately. By the second period, the health regions had been reorganised, more or less by combining old regions as indicated. Taking only the last three years, the referral range was considerable, with the highest rate of 17.41 per million population in North Thames, (the greater burden from the old North-East Thames region), and the lowest of 8.83 in Anglia & Oxford. This is not entirely reflected in bed use, since less than one-third of referrals resulted in admission in some regions, but about three-quarters in others. In order to investigate variations between regions in both referral and admission rates for 1993-95, Poisson distributions were fitted and deviances from the overall rates examined. This analysis confirmed that there are significant differences between the regions (P=0.001 in both cases, but with greater unexplained variation in referrals). There is only moderate correlation between referral and admission rates (0.4), and there is a high degree of variation in the proportions admitted of those referred. Three regional groupings (defined post hoc) showed significant differences in the proportions admitted (P<0.001): low (Trent, West Midlands, Mersey/North-West); medium (South-East Thames/South-West Thames, East Anglia/Oxford, North-West Thames/North-East Thames); High (Wessex/South-West and North/Yorkshire).
Table 3 Average annual referral and admission rates to special hospitals for different regional health authorities, per million population

| Regional health authorities | New regions | Referrals | Admissions | Referrals | Admissions | Average after merging of regions | Percentage admitted (95% CIs) |
|---|---|---|---|---|---|---|---|
| 1986-1992 | 1993-95 | 1986-92 | 1986-92 | 1993-95 | 1993-95 | 1993-95 | 1993-95 |
| Wessex | South & West | 6.74 | 9.5 | 9.14 | 8.66 | 7.38 | 80 (72-87) |
| South-West | 7.12 | 5.03 | 6.09 | ||||
| North | Northern & Yorkshire | 8.83 | 5.5 | 10.59 | 6.52 | 7.54 | 73 (64-80) |
| Yorkshire | 14.0 | 8.54 | 8.65 | ||||
| South-East Thames | South Thames | 14.49 | 6.72 | 13.78 | 7.36 | 6.7 | 49 (41-56) |
| South-West Thames | 10.5 | 4.76 | 6.01 | ||||
| East Anglia | Anglia & Oxford | 8.93 | 2.97 | 8.83 | 3.8 | 4.24 | 47 (37-58) |
| Oxford | 10.06 | 8.0 | 4.67 | ||||
| North-West Thames | North Thames | 8.85 | 3.17 | 17.41 | 3.87 | 6.78 | 40 (33-46) |
| North-East Thames | 13.85 | 10.26 | 9.6 | ||||
| Trent | Trent | 11.18 | 4.42 | 16.96 | 5.47 | 5.47 | 32 (25-40) |
| West Midlands | West Midlands | 7.14 | 4.84 | 10.61 | 3.17 | 3.17 | 29 (21-39) |
| Mersey | North-West | 7.51 | 5.19 | 14.34 | 5.26 | 4.42 | 29 (23-36) |
| North-West | 9.28 | 5.77 | 3.57 |
The corresponding referral figures for Wales are 0.51 per million population between 1986 and 1992. This increased to 0.62 referrals per million for the period 1993-95. The admissions figures were 0.2 and 0.1 per million respectively, yielding 16% admitted for the latter period.
Admissions to special hospitals 1986-1995
Overview
There were 1906 admission episodes during the 10 years, involving 1731 patients. One hundred and thirty-six patients were admitted twice, 18 patients three times and one patient four times; 83% of admission episodes were of men. The gender distribution did not change over time. The average age on admission was also constant, at 31.4 years for men (range 15.5-74.3; 95% CI 31.0-31.9) and 29.5 years for women (range 16.9-65.3; 95% CI 28.5-30.4).
Mental disorder trends
Table 4 shows that admissions to special hospitals have fallen from an average of 207 per year in the first three years of the study to an average of 185 in the last three years, with a rate ratio of 0.98 per year (95% CI 0.96-1.01), equivalent to a reduction over the 10-year period of 16%. This trend, however, has not affected all groups of disorders equally. The admission of patients under the classifications of mental impairment or psychopathic disorder has significantly decreased (rate ratio 0.93, 95% CI 0.91-0.96; and 0.85, 95% CI 0.80-0.90, P<0.001, respectively), whereas admission under the mental illness classification has been maintained (rate ratio 1.01, 95% CI 0.99-1.03, P=0.17).
Table 4 Numbers of men and women admitted to special hospitals under different Mental Health Act 1983 (MHA) classifications of mental disorder

| Year admitted | MHA classification | ||||||||||||||
|---|---|---|---|---|---|---|---|---|---|---|---|---|---|---|---|
| Mental illness | Psychopathic disorder | (Severe) mental impairment1 | Total numbers | ||||||||||||
| Male | Female | Male | Female | Male | Female | Male | Female | Grand Total3 | |||||||
| n | %2 | n | % | n | % | n | % | n | % | n | % | ||||
| 1986 | 114 | 67.06 | 22 | 45.83 | 45 | 26.47 | 24 | 50.00 | (3) 11 | 6.47 | 2 | 4.17 | 170 | 48 | (1M) 219 |
| 1987 | 119 | 69.19 | 16 | 45.71 | 39 | 22.67 | 18 | 51.43 | (1) 14 | 8.14 | (1) 1 | 2.86 | 172 | 35 | 207 |
| 1988 | 102 | 65.81 | 18 | 48.65 | 39 | 25.16 | 17 | 45.95 | (2) 14 | 9.03 | 2 | 5.41 | 155 | 37 | (2M) 194 |
| 1989 | 101 | 65.16 | 12 | 40.00 | 42 | 27.10 | 18 | 60.00 | (3) 12 | 7.74 | 0 | 0 | 155 | 30 | (1F) 186 |
| 1990 | 94 | 68.12 | 12 | 35.29 | 36 | 26.09 | 20 | 58.82 | 8 | 5.80 | 2 | 5.88 | 138 | 34 | 172 |
| 1991 | 112 | 72.73 | 15 | 51.72 | 34 | 22.08 | 12 | 41.38 | 8 | 5.19 | 2 | 6.9 | 154 | 29 | 183 |
| 1992 | 125 | 78.13 | 19 | 65.52 | 31 | 19.38 | 9 | 31.03 | 4 | 2.5 | 1 | 3.45 | 160 | 29 | 189 |
| 1983 | 139 | 77.22 | 11 | 50.00 | 36 | 20.00 | 11 | 50.00 | 5 | 2.78 | 0 | 0 | 180 | 22 | 202 |
| 1994 | 106 | 75.18 | 21 | 70.00 | 33 | 23.40 | 9 | 30.00 | 2 | 1.42 | 0 | 0 | 141 | 30 | (1M) 172 |
| 1995 | 130 | 83.33 | 16 | 61.54 | 23 | 14.74 | 8 | 30.77 | 3 | 1.92 | 2 | 7.69 | 156 | 26 | 182 |
| Total | 1142 | 72.23 | 162 | 50.63 | 358 | 22.64 | 146 | 45.63 | (9) 81 | 5.12 | (1) 12 | 3.75 | 1581 | 320 | 1906 |
Placement immediately prior to admission
Table 5 shows significant trends towards change in two of the three principal sources of admission considered. For both men and women, there was a decrease over the period in the numbers coming directly from court on a criminal conviction (rate ratio 0.92, 95% CI 0.91-0.93, P<0.001). There was an increase in the number of admissions of men from prison, predominantly pre-trial episodes (rate ratio 1.07, 95% CI 1.04-1.10, P<0.001), but a decrease in the number of women from prison (rate ratio 0.88, 95% CI 0.81-0.96, P=0.004). The differences in raw numbers are particularly striking in the first and last years (45,81 men; 13,3 women). Hospital admissions remained stable.
Table 5 Sources of admissions to special hospitals 1986-95
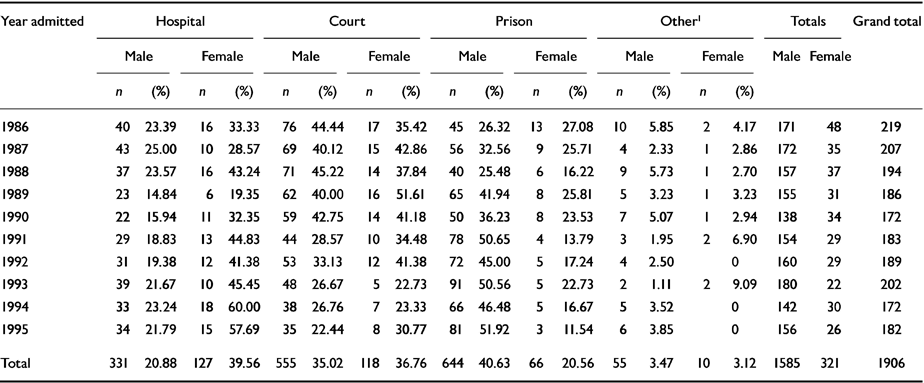
| Year admitted | Hospital | Court | Prison | Other1 | Totals | Grand total | |||||||||||||
|---|---|---|---|---|---|---|---|---|---|---|---|---|---|---|---|---|---|---|---|
| Male | Female | Male | Female | Male | Female | Male | Female | Male | Female | ||||||||||
| n | (%) | n | (%) | n | (%) | n | (%) | n | (%) | n | (%) | n | (%) | n | (%) | ||||
| 1986 | 40 | 23.39 | 16 | 33.33 | 76 | 44.44 | 17 | 35.42 | 45 | 26.32 | 13 | 27.08 | 10 | 5.85 | 2 | 4.17 | 171 | 48 | 219 |
| 1987 | 43 | 25.00 | 10 | 28.57 | 69 | 40.12 | 15 | 42.86 | 56 | 32.56 | 9 | 25.71 | 4 | 2.33 | 1 | 2.86 | 172 | 35 | 207 |
| 1988 | 37 | 23.57 | 16 | 43.24 | 71 | 45.22 | 14 | 37.84 | 40 | 25.48 | 6 | 16.22 | 9 | 5.73 | 1 | 2.70 | 157 | 37 | 194 |
| 1989 | 23 | 14.84 | 6 | 19.35 | 62 | 40.00 | 16 | 51.61 | 65 | 41.94 | 8 | 25.81 | 5 | 3.23 | 1 | 3.23 | 155 | 31 | 186 |
| 1990 | 22 | 15.94 | 11 | 32.35 | 59 | 42.75 | 14 | 41.18 | 50 | 36.23 | 8 | 23.53 | 7 | 5.07 | 1 | 2.94 | 138 | 34 | 172 |
| 1991 | 29 | 18.83 | 13 | 44.83 | 44 | 28.57 | 10 | 34.48 | 78 | 50.65 | 4 | 13.79 | 3 | 1.95 | 2 | 6.90 | 154 | 29 | 183 |
| 1992 | 31 | 19.38 | 12 | 41.38 | 53 | 33.13 | 12 | 41.38 | 72 | 45.00 | 5 | 17.24 | 4 | 2.50 | 0 | 160 | 29 | 189 | |
| 1993 | 39 | 21.67 | 10 | 45.45 | 48 | 26.67 | 5 | 22.73 | 91 | 50.56 | 5 | 22.73 | 2 | 1.11 | 2 | 9.09 | 180 | 22 | 202 |
| 1994 | 33 | 23.24 | 18 | 60.00 | 38 | 26.76 | 7 | 23.33 | 66 | 46.48 | 5 | 16.67 | 5 | 3.52 | 0 | 142 | 30 | 172 | |
| 1995 | 34 | 21.79 | 15 | 57.69 | 35 | 22.44 | 8 | 30.77 | 81 | 51.92 | 3 | 11.54 | 6 | 3.85 | 0 | 156 | 26 | 182 | |
| Total | 331 | 20.88 | 127 | 39.56 | 555 | 35.02 | 118 | 36.76 | 644 | 40.63 | 66 | 20.56 | 55 | 3.47 | 10 | 3.12 | 1585 | 321 | 1906 |
Type of detention
The type of detention overlaps considerably with the source of admission, and so is not shown in a separate table. Remands from both Court (under Sections 35, 36, 38) (see Appendix) and prison (under Section 48) have shown a significant average increase of 14% per year over the 10-year period (rate ratio 1.14, CI 1.10-1.19, P<0.001). However, this hides a large increase in the second half of the study period.
People on prison transfer orders almost invariably come from prison (95%), people on civil orders from hospital (94%), and people on any remand provision other than section 48 from court (89%). Examples of the few cases not fitting these patterns include civil orders imposed at the doors of a court after an acquittal on a criminal charge but in the light of sufficient evidence to enable the person to be detained under the MHA. By contrast, only 59% of people on hospital orders came from court. The hospital order group had often a more complicated history, reflecting an initial attempt at management in a less secure hospital. Most (74%) of the tiny group of patients from other sources were special hospital recalls.
Approximately two-thirds of all patients over the 10 years were admitted under orders restricting discharge, in addition to the primary detention order. There is an overall upward trend in the proportion of restricted patients: 73% of mental illness admissions are restricted, compared with 59% of the declining number of those admitted under the category of psychopathic disorder. A logistic regression with restriction status as dependent variable confirms a significant interaction between MHA classification and year (P=0.01). Not only is the proportion of restricted patients among mental illness admissions higher overall, but it has increased over time (adjusted odds ratio per year 1.06, 95% CI 1.01-1.10), whereas there is no evidence for increasing proportions in the categories psychopathic disorder and (severe) mental impairment.
Admissions under Section 37/41 have declined for all men admitted, from 42% to 15% over the 10 years, with a corresponding increase in men admitted under Section 47/49, from 23 to 30%.
Offences most directly pertinent to admission
These are shown in Table 6. There was a decrease in the number of cases not processed through the criminal courts (rate ratio 0.93, 95% CI to 0.88-0.98, P=0.002) and in property offence categories for both men and women (rate ratio 0.90, 95% CI 0.87-0.93, P<0.001). Although there was no evidence for an absolute increase in serious personal harm offences (homicide, violence and sexual), the proportion of these offences did increase significantly (adjusted odds ratio per year 1.08, 95% CI 1.04-1.12, P<0.001). The proportion of admissions for serious personal harm offences rose from 62% in 1986 to 75% at the end of the study period. In absolute terms, the category of other offences remained consistently small throughout.
Table 6 Types of offence committed by persons admitted to special hospitals
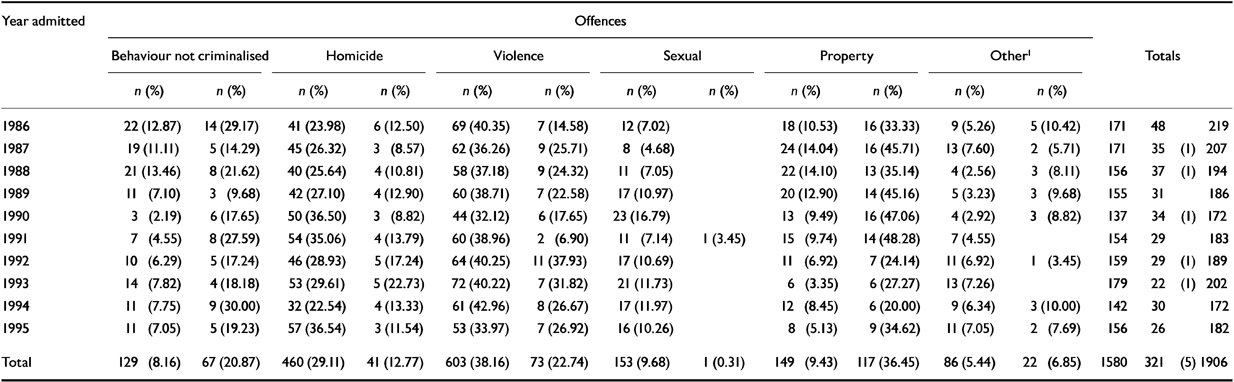
| Year admitted | Offences | ||||||||||||||
|---|---|---|---|---|---|---|---|---|---|---|---|---|---|---|---|
| Behaviour not criminalised | Homicide | Violence | Sexual | Property | Other1 | Totals | |||||||||
| n (%) | n (%) | n (%) | n (%) | n (%) | n (%) | n (%) | n (%) | n (%) | n (%) | n (%) | n (%) | ||||
| 1986 | 22 (12.87) | 14 (29.17) | 41 (23.98) | 6 (12.50) | 69 (40.35) | 7 (14.58) | 12 (7.02) | 18 (10.53) | 16 (33.33) | 9 (5.26) | 5 (10.42) | 171 | 48 | 219 | |
| 1987 | 19 (11.11) | 5 (14.29) | 45 (26.32) | 3 (8.57) | 62 (36.26) | 9 (25.71) | 8 (4.68) | 24 (14.04) | 16 (45.71) | 13 (7.60) | 2 (5.71) | 171 | 35 | (1) 207 | |
| 1988 | 21 (13.46) | 8 (21.62) | 40 (25.64) | 4 (10.81) | 58 (37.18) | 9 (24.32) | 11 (7.05) | 22 (14.10) | 13 (35.14) | 4 (2.56) | 3 (8.11) | 156 | 37 | (1) 194 | |
| 1989 | 11 (7.10) | 3 (9.68) | 42 (27.10) | 4 (12.90) | 60 (38.71) | 7 (22.58) | 17 (10.97) | 20 (12.90) | 14 (45.16) | 5 (3.23) | 3 (9.68) | 155 | 31 | 186 | |
| 1990 | 3 (2.19) | 6 (17.65) | 50 (36.50) | 3 (8.82) | 44 (32.12) | 6 (17.65) | 23 (16.79) | 13 (9.49) | 16 (47.06) | 4 (2.92) | 3 (8.82) | 137 | 34 | (1) 172 | |
| 1991 | 7 (4.55) | 8 (27.59) | 54 (35.06) | 4 (13.79) | 60 (38.96) | 2 (6.90) | 11 (7.14) | 1 (3.45) | 15 (9.74) | 14 (48.28) | 7 (4.55) | 154 | 29 | 183 | |
| 1992 | 10 (6.29) | 5 (17.24) | 46 (28.93) | 5 (17.24) | 64 (40.25) | 11 (37.93) | 17 (10.69) | 11 (6.92) | 7 (24.14) | 11 (6.92) | 1 (3.45) | 159 | 29 | (1) 189 | |
| 1993 | 14 (7.82) | 4 (18.18) | 53 (29.61) | 5 (22.73) | 72 (40.22) | 7 (31.82) | 21 (11.73) | 6 (3.35) | 6 (27.27) | 13 (7.26) | 179 | 22 | (1) 202 | ||
| 1994 | 11 (7.75) | 9 (30.00) | 32 (22.54) | 4 (13.33) | 61 (42.96) | 8 (26.67) | 17 (11.97) | 12 (8.45) | 6 (20.00) | 9 (6.34) | 3 (10.00) | 142 | 30 | 172 | |
| 1995 | 11 (7.05) | 5 (19.23) | 57 (36.54) | 3 (11.54) | 53 (33.97) | 7 (26.92) | 16 (10.26) | 8 (5.13) | 9 (34.62) | 11 (7.05) | 2 (7.69) | 156 | 26 | 182 | |
| Total | 129 (8.16) | 67 (20.87) | 460 (29.11) | 41 (12.77) | 603 (38.16) | 73 (22.74) | 153 (9.68) | 1 (0.31) | 149 (9.43) | 117 (36.45) | 86 (5.44) | 22 (6.85) | 1580 | 321 | (5) 1906 |
DISCUSSION
Referral trends
Referral figures suggest an increase in demand for special hospital beds. With medium-secure unit places underprovided and full in the first half of the 1990s (J. Coid, personal communication, 1999), it is possible that the increase is real, but we are cautious about our figures for referrals, given that the change in the collection of such data coincided in time. What can be said with more confidence is that neither within each subsidiary period (1986-92; 1993-5) nor between these periods is there any indication of a fall in referrals.
Regional differences in referrals and admissions
No health region manages without referral to high-security institutions although there is considerable variation between the regions in terms of demand and admissions. Over the last three years of the study, for which referrals data are the most complete, and special hospital catchment areas have become established, three regions (Trent, West Midlands and Mersey/North-West) appear to have used the hospitals very differently. Only about one-third of referrals for these three regions led to an admission, compared to 40-50%, and over 70%, in the other clusters of regions. This seems unlikely to have been accounted for entirely by differences in gate-keeping on the part of the hospitals, although three of the four with the lowest proportionate admissions related to Ashworth in Merseyside, and three of the four with the highest to Broadmoor to the south-west of London (Rampton near Nottingham appearing at both extremes). All of the regions had a specialist forensic psychiatric service, with beds, which in each case was growing through the period under study. Thus, for any of the regions, it seems unlikely that inappropriate referrals (for example, seeking only to place someone who should have been in medium security in a high-security bed by default) contributed much, if anything, to the finding. The nature of the demand on the part of the referrers may, nevertheless, have played a part in the differences. Clinicians in the regions with low proportions of admissions may have been more likely to use the special hospitals as a source of second opinion or advice, for example on risk assessment. Our data did not include reasons for referral.
Trends in admission
There has been a definite reduction in the number of admissions to special hospitals overall, but disproportionately according to the nature of the mental disorder, of the index offence, the source of admission and the nature of the detention. The pessimistic view promulgated about the treatment of personality disorder in a special hospital (Dell & Robertson, 1988), or indeed anywhere else, may well have had an impact. While Mawson (1983) responded by calling for a switch for such cases from direct admission to prison transfer in appropriate cases, it seems that clinicians have preferred simply not to admit. This being so, it seems hardly likely that the new direction order under Section 46 of the Crime (Sentences) Act 1997 will attract any more enthusiasm. A clearer relationship between treatment and outcome seems likely to be necessary before trends are reversed for this neglected group. The increase in prison treansfers has almost wholly been for people in the mental illness category. The number of admissions of women and people with learning disabilities seems to have decreased, in line with hospital policies.
Following the advent of secure units and changes in special hospital management, more complex routes to admission seem to have evolved. The majority of patients admitted as convicted offenders has increased, and whereas the largest single group (42%) used to come directly from court, by the mid-1990s the vast majority of convicted offender patients had been placed in prison or another hospital first (76%), and only on failure of those placements were they transferred to a special hospital. This, together with indicators that the types of offence associated with admission may have shifted towards the more serious, suggests that the smaller number of admissions may represent a greater challenge for the special hospitals in terms of the risk of violence within an institution as well as to the general public. The increase in the number of remand cases would also have the effect of increasing the workload, because of the consequent demand for faster comprehensive assessment and greater numbers of formal reports required for the courts.
Demand for high-security beds
An important question is how these trends relate to those elsewhere in the National Health Service. After being stable through the 1980s, the number of formal admissions rose sharply (from 16 276 to 21 356 between 1987/88 and 1992/93) (Department of Health, 1995), and the number of admissions of explicitly offender patients (part III) increased by 32% during the same period. This increase has not been uniform anywhere across the MHA sections; most is accounted for by the transfer of remand and sentenced prisoners and Sections 35 and 38 court remand orders, regardless of hospital setting. This suggests that the capacity of local services to contain this sort of work has improved, but that the trend for more challenging cases presenting to special hospitals is unlikely to decrease. An increase in prison transfers was also reflected in other hospitals, but the admission of psychopathic disorder cases had decreased. In 1991, 95 people classified as suffering from psychopathic disorder were admitted to hospitals nationally, and approximately half of these were admitted to special hospitals (n=46).
It thus seems likely that not only is there still a demand for patients to be admitted to special hospitals, but also a real need for high security, at least at the time of admission, for the majority of them. The question is whether a new plateau of admissions has been reached, which perhaps may vary only in the proportions of its constituent groups, or whether with improved recognition of the treatable disorders reported to be prevalent among sentenced and pre-trial prisoners (Gunn et al, 1991; Maden et al, 1995), the overall numbers may increase.
Clinical Implications and Limitations
CLINICAL IMPLICATIONS
-
▪ Referral and admission rates confirm the continuing demand for high security beds.
-
▪ No health region manages without using special hospitals.
-
▪ Routes into special hospital have become more complex over time, with more admissions resulting from failed placements elsewhere.
LIMITATIONS
-
▪ Referral data were not collected consistently over time and across sites, so that it is not possible to interpret accurately the apparent increase in 1993. Increases in referrals over time were consistent within each band of homogeneous data collected.
-
▪ Full clinical details of the patients referred and admitted to special hospital were unavailable. Therefore the Mental Health Act classification of disorder was used as a surrogate measure of mental disorder; however, it provides only an indicator of the complexity of diagnosis, and little data on severity.
-
▪ The nature of the study necessarily confined analysis to referrals and admissions of people already identified as likely to be suitable for a special hospital bed. Potentially suitable cases not recognised by prison doctors or psychiatrists can only be estimated from independent studies of other services.


eLetters
No eLetters have been published for this article.