- Research
- Open access
- Published:
Deep learning based approaches from semantic point clouds to semantic BIM models for heritage digital twin
Heritage Science volume 12, Article number: 65 (2024)
Abstract
This study focuses on the application of deep learning for transforming semantic point clouds into semantic Building Information Models (BIM) to create a Heritage Digital Twin, centering on Taoping Village, a site of historical and cultural significance in Sichuan, China. Utilizing advanced technologies such as unmanned aerial vehicles and terrestrial laser scanning, we capture detailed point cloud data of the village. A pivotal element of our methodology is the KP-SG neural network, which exhibits outstanding overall performance, particularly excelling in accurately identifying 11 categories. Among those categories, buildings and vegetation, achieves recognition rates of 81% and 83% respectively, and a 2.53% improvement in mIoU compared to KP-FCNN. This accuracy is critical for constructing detailed and accurate semantic BIM models of Taoping Village, facilitating comprehensive architecture and landscape analysis. Additionally, the KP-SG’s superior segmentation capability contributes to the creation of high-fidelity 3D models, enriching virtual reality experiences. We also introduce a digital twin platform that integrates diverse datasets, their semantic information, and visualization tools. This platform is designed to support process automation and decision-making and provide immersive experiences for tourists. Our approach, integrating semantic BIM models and a digital twin platform, marks a significant advancement in preserving and understanding traditional villages like Taoping and demonstrates the transformative potential of deep learning in cultural heritage conservation.
Introduction
A traditional village is a human settlement that reflects the historical and cultural characteristics of a particular region or community. Traditional villages are often distinguished by their adherence to longstanding customs, architectural styles, and ways of life that have been passed down through generations. Each of them has its own unique identity and is shaped by the specific history and heritage of its people. It now stands as a rich cultural ecosystem encompassing architecture, folklore, gardens, paintings, religion, and various other regional cultural manifestations. Nowadays 235 of the 1157 world heritage sites on the list maintained by the United Nations Educational, Scientific, and Cultural Organization (UNESCO) are associated with traditional communities, and 6819 traditional villages in China that have been identified and protected by the government. Recent research [1,2,3] predominantly focus on analyzing traditional villages from spatial and temporal perspective. And the articles [4,5,6] examine the evolution of the distribution of traditional villages in China, considering factors like geography, society, and culture. Moreover, rural revitalization have become a trend since 2017 in China, to activate village tourism, traditional industry empowerment and organic renewal of village, while maintaining their unique culture heritage [7,8,9]. For example, the work [10] redesigned vernacular architecture of Wen village and adopt traditional building techniques to enhance both the local cultural heritage and the rural development without blindly following urban globalisation. In general the main demand addressing traditional villages is to build a systematic regeneration process involving the inheritance of regional culture, and the sustainable development of heritage resources [11].
Taoping village is our study area, known for its distinctive stone-based architecture, the only well-preserved Qiang ethnic architecture to this day. The village’s stepped layout along the hilly terrain is both functional and aesthetically pleasing, and it has turned into a popular tourist destination where visitors can explore stone buildings, winding alleyways, and immerse themselves in the Qiang culture. Unfortunately, traditional villages are facing various threats of destruction. The village was damaged during Wenchuan earthquake in 2008, and the installation of modern living facilities and tourism development is causing the landscape and architectural function to undergo changes [12, 13]. In addition, the paper [14] promoted post-disaster community tourism development by encouraging local small business like building cultural walls, souvenir stalls, more tourist facilities supporting activities like Qiang dance, sheepskin drumming and accommodation and transportation, which means the village requires more reconstruction or new installation. Consequently the spatial pattern and cultural elements would be seriously jeopardized without control. To prevent the occurrence of the situation, the village is now listed as the culture rescue and protection project by the nation to restore the village buildings, roadway and underground water network. Therefore, it is significant to have sustainable regeneration and restoration while preserving the original architectural and cultural elements as accurately as possible, and to have experts decision making and community involvement and evaluation.
In order to carry out the digital preservation process for Taoping village, we analyze the demands from the perspective of technique. The first challenge arises from the densely packed nature of the village’s buildings. They are tightly squeezed together, leaving little to no open ground visible from an overhead perspective. And there are several internal alleyways hidden beneath the buildings, which cannot be captured by aerial drones. This results in photogrammetry reconstructed mesh models are not enough for creating informative building models. To overcome this issue, we gather data from both aerial and terrestrial scanners to gain a comprehensive view of the village. While this approach provides a wealth of survey data, it increases the workload as well. The second challenge is that there are hundreds of buildings in the village relying on one another, with most of them sharing a common wall with their neighbors, so that the point clouds are unable to maintain each building’s completeness. Therefore in order to facilitate spatial analysis, it is imperative to construct Building Information Models (BIM) models, which allow us to separate individual buildings, reconstruct structures, and discern distribution patterns. Thirdly, in order to transform point clouds to BIM, it is impractical to import all point clouds into Revit for reference, and necessary to develop algorithms for extracting and downsampling the parts of interest. The task is complicated because large size of the village and its complexity containing intricate buildings, pathways, and a rich natural environment. And conventional point cloud classification methods, such as Euclidean Cluster Extraction or Region Growing from PCL library, cannot solve the problem. The forth challenge is that diverse datasets are produced, there is no uniform platform to integrate them and providing comprehensive and customized services. In summary, we identify the gap in the current research. There is no detailed scanning data available for Taoping village, limiting the spatiotemporal analysis research on Taoping. Furthermore, traditional villages hold significant research value, but the capability of algorithms for processing the scanning data, namely the point clouds, is still limited. Lastly, while there is considerable research on the data storage, visualization, retrieval of heritage data, and analysis display, there is still potential for innovation for a comprehensive digital twin platform aimed at the regeneration and restoration services of the village.
To address the issue, this paper makes the following key contributions:
-
The study involves generating extensive datasets for Taoping village, including 272 million points via Unmanned Air Vehicle Digital Photogrammetry (UAVDP) and an additional 1.53 billion points through Terrestrial Laser Scanning (TLS). This comprehensive data collection provides a detailed digital representation of the village.
-
A novel neural network, KP-SG, is developed for efficient semantic segmentation of point clouds. This improved model demonstrates superior performance compared to existing methods, crucial for processing the vast and complex data of heritage sites like Taoping village.
-
Utilizing segmented point clouds, the study constructs parametric Building Information Models (BIM) with semantic information for spatial analysis and understanding of Taoping village.
-
Create highly detailed 3D models with immersive textures to enhance virtual reality experiences. This aspect is essential for visualizing the cultural heritage site in a more engaging and interactive manner.
-
Design a digital twin platform to integrate various datasets and future intelligent services.
The primary issue addressed by this scan-to-BIM method is the creation of diverse data sources for complex, large-scale heritage sites. The management of these datasets and their intelligent processing form the foundation for delivering high-level services. These contributions represent significant advancements in the fields of digital heritage preservation and development.
Related works
Research data and technology for traditional villages
For the research towards traditional villages, there are open map platform such as Google Map or Gaode, GIS data from Global Mapper, and satellite remote sensing map from some open source platform [1,2,3,4,5,6,7,8,9, 11, 15] providing valuable data source with limited resolution 30 m × 30 m. And other synthesized data sources obtained through field surveys or drone-assisted aerial photography, along with topography, rivers, economic data like GDP, population, and transportation, are integrated into ArcGIS to analyze the spatial characteristics of villages and form the criteria for recognizing village spatial types at the macro-level. Other than this, the work [9] built BIM models of Jiangnan regional villages based on on-site surveying including architecture outline, public space elements, architecture forms at the micro-level. They constructed 3D models in ArcGIS to classify vernacular architectures into five forms. Traditionally, ArcGIS is mostly used to conduct analysis for spatiotemporal data. Nowadays, with the booming digital 3D mapping technologies [16, 17], high quality 3D point cloud datasets are acquired through Unmanned Air Vehicle Digital Photogrammetry (UAVDP), Airborne Laser Scanner (ALS), Terrestrial Laser Scanner (TLS) or Mobile Laser Scanner (MLS), has overwhelming advantages for much higher resolution with sampling interval down to few centimeters which forms the precious initial heritage survey data containing large amount details. The research [18,19,20,21] used UAV photogrammetry and supplement TLS point data in inaccessible building zones where shadow data originated, and then converted survey data into BIM, which is well-established environment for integrating geometrical and non-geometrical semantic information for the purpose of documentation and visualization particularly for heritage buildings. Therefore, as paper [5] pointed out it is difficult to integrate comprehensive, continuous data on the same data platform, and develop analysis and services from both micro and macro manner.
3D digital mapping and scan to BIM technology
The mapping equipment generate point clouds, which are lack of topological information, therefore reverse engineering is the process of deconstructing, building BIM models including knowledge such as structure information, historical reports, decay and renovation records, are crucial in the field of ACH. And it is significant challenge for lack of guidelines and automation from data acquisition to HBIM [17, 22]. The conventional scan-to-BIM involves using specialized software like Autodesk Revit to interpret the segmented point cloud and construct corresponding parametric 3D models as architectural components. The project [23] deployed HBIM modeling for the Nasif Historical House based on TLS point clouds, and use Hijazi Architectural Object Library (HAOL) as a plugin for the models which helped save time. The work for Zee Ain Historical Village in Saudi Arabia [18] merged TLS point clouds with UAV photogrammetry data to build accurate parametric BIM models and BIM libraries with fine texture. The work for Fenghuang Village in China [19] constructed BIM models and BIM family for traditional architectures based on terrestrial laser scanning. These case studies serve the purpose of regional heritage documentation, characteristic analysis and visualization of certain effects. However parameterizing and manual modeling still take lots of work for BIM conversion. In order to handle irregular structure and surface, some work [24,25,26,27] focusing on mesh-to-BIM automation based on NURBS curves. Besides for the parts of architecture that are relatively regular in shape, such as walls, floors, roofs, etc., the automated conversion tools for scan-to-BIM, such as ClearEdge3D Edgewise, can speed up the production process. The work [28] combined two methods to build HBIM for “Paraboloide” of Casale in Italy. Regardless of the method of automation used, segmenting the point cloud by components is a very important prerequisite. Currently, the standardization level for processing individual buildings is high, but for large scenes in traditional villages, the key first step is to separate elements such as buildings, vegetation, and passageways.
3D models segmentation and classification technology
Researchers [22, 23, 27, 29,30,31,32,33] utilized historical building datasets for classification and segmentation to identify historical architectural elements, and even recognize the styles [34]. Point clouds automatic semantic segmentation is also an important step towards BIM models [17]. Segmentation techniques have experienced a considerable evolution recently. Most machine learning based methods for point cloud segmentation were carried out for historical buildings. The paper [30] employed DGCNN [35] to segment ArCH datasets, which are churches, chapels, cloisters, porticoes and loggias into 11 different architectural parts. The authors [31] implemented PointNet [36] to segment 3D point cloud data of heritage buildings in Gaziantep, Turkey. Scholars [32] segmented the buildings’ bricks based on images convolutional neural networks (CNN) for Basilica of St Anthony, Italy. The work [29] compared machine learning based methods, Random Forest, One-versus-One classifier, Convolutional Neural Networks [37] and Recurrent Neural Network [38] to automatically recognizing architectural components such as columns, facades or windows in Temple of Neptune in Paestum and Renaissance buildings in Bologna. The work [39] carried out a comparison with state-of-art neural networks, known as PointNet [36], PointNet++ [40], PCNN [41] and DGCNN [35], the DGCNN proved to be the best network architecture for the ArCH dataset, including the Trompone Church, the Palace of Pilato of the Sacred Mount of Varallo, and the Sacred Mount of Ghiffa.
Although in the field of culture heritage previous scholars have attempted various machine learning techniques to enhance the efficiency and accuracy of point cloud data processing for historical monuments, the process is rather complicate that practitioners often have to create their own methods to capture the existing condition of the built heritage based on the project’s characteristics, available resources, and their own experiences and knowledge [22]. While our dataset is a traditional village that covers 55,000 m2. The 3D point clouds are acquired by UAVDP and TLS, which are large scale outdoor datasets. According to investigation, the public outdoor UAVDP datasets are SensatUrban [42], and HRHD-HK [43], while the famous TLS dataset is Semantic3D [44]. Methods that show promising results and their performance rank very top on those public outdoor datasets are RandLA-Net [45] and KP-FCNN [46]. RandLA-Net is MLP-based method that wins its reputation of high efficiency by using a low-complexity random sampling. KP-FCNN is an innovative kernal-based method that captures local features through a set of kernel points with defined weights. Except these two models, DGCNN [35] is a graph-based method, and PointNet [36], PointNet++ [40] are the original work of MLP-based methods for point cloud recognition and segmentation. These methods have demonstrated promising results on public outdoor datasets.
Digital twin platform
Digital twin [47, 48] is hot topic in the field of building smart city platform, by applying technological advances of data integration and machine learning. In the realm of cultural heritage preservation, the paper [49] contributed to maintenance or visualization from perspective of architectural style or structure analysis. And the project [50] presented a live-guided remote VR tour of an underground oil-mill in the town of Gallipoli, Italy. Furthermore, intelligent algorithms were carried out based on point clouds or derived 3D mesh models due to feasibility, after all they are raw datasets directly exported from mapping equipment. The scholars [51] presented hybrid point clouds segmentation of the Carolingian church located in Germigny-des-Prés and ontology is created based on semantic attributes by segmentation algorithm. And finally visualization and knowledge graph is accessible to users on web by WebGL [52]. The paper [34] developed the server side to process point clouds, segment historical buildings and classify their styles for Cypriot architectural buildings, and users can visualize the heritage assets from browser by WebGL [52, 53]. Recently parametric BIM models are becoming more established practice, that are able to extract valuable information. Researchers develop hierarchical simulation model to assess structural conditions of historical buildings for Milan Cathedral [54] and Santa Mario of Portonovo church [25], and web application for browsing the structural geometry and ontology information. Except for the purpose of visualization and knowledge query, the authors [55] worked on a design application to generate Siheyuan by writing architectural designing rules. And the paper [56] advocated that the digital twin platform should be used as the management plan process and preventive policy formulation for the preventive conservation of built heritage. Traditional villages usually cover a large area that point cloud data are much larger than one single building. Technically, Cesium [57] is the best practice in class implementation of 3D Tiles for streaming massive amounts of data, and it supports for BIM models as well [58].
Materials and methodology
Study area
Taoping village, depicted in Fig. 1, is a traditional Qiang ethnic village renowned for its distinctive architectural style, characterized by stone buildings and watchtowers. Situated in the Aba Tibetan and Qiang Autonomous Prefecture in Sichuan Province, the village boasts a rich history dating back centuries. The indigenous Qiang people, native to the mountainous regions of western China, have resided in this village for generations, drawn by the fertile soil, ample water supply, and favorable lighting conditions. In ancient times, with limited technology and tools, these resourceful inhabitants adeptly adapted to their natural environment. They collaboratively constructed intricate architectural marvels and village layouts that catered to communal habitation, communication, and defense needs.

Surveyed area
Concerning heritage conservation, Taoping village has admirably preserved its unique culture and architecture. The village’s stone houses and watchtowers were originally constructed for defensive purposes and now stand as integral components of the local culture. The defining feature of Taoping’s architecture lies in its primary use of stone as the building material of choice. Stone houses and watchtowers dominate the village’s landscape, combining durability with defensive fortifications due to their solid construction. Simultaneously, they captivate with their aesthetic appeal, as illustrated in Fig. 2. The architectural layout showcases remarkable ingenuity, providing a sense of openness and harmony. Exploring Taoping village is a unique experience, akin to navigating a labyrinth. The tour path continuously winds through light and shadow, broad expanses and narrow passages, and elevated and lowered areas within the dense cluster of buildings. The village offers a wealth of tourism resources.

An overview of our dataset
Dataset
UAVDP data acquisition
Our dataset’s point clouds were acquired using UAVDP methods. The aerial survey was conducted in April 2021. For flight mapping, we used a Pegasus D2000 multi-rotor UAV outfitted with five D-OP3000 tilt cameras to take aerial pictures of the location. The camera sensor size is 23.5 × 15.6 mm, which is able to capture high resolution aerial images. In all total 483 aerial images and Ground Control Points (GCPs) from GNSS equipment were reviewed manually, then input into Pix4D. The software automatically recovered the images’ positions and orientation, and extract features by SIFT and combined with GCPs and multi-view image external orientation elements provided by POS. Digital Orthophoto Map (DOM) can be normalized and enhanced. The scene geometry was then calculated by Structure from Motion (SfM) utilizing redundant iterative bundle adjustment. Finally, a dense and colored 3D point cloud was reconstructed through multi-view stereo image matching.
Figure 2 depicts the original reconstruction result. This dataset covers an area of approximately 55,000 m2 and consisting of 272,091,243 points with resolution 2.8 cm based on CGCS2000 geodetic coordinate system. Each point in the dataset contains coordinates as well as color attributes. Limited by modern GPUs, the whole scene is divided into 47 smaller tiles as shown in Fig. 3. Each tile encompasses roughly 50 × 50 m2 of area.

Select more meaningful data blocks from the image reconstruction data to form our dataset. The orange box represents the training set, and the blue box is the test set
TLS data acquisition
The terrestrial 3D laser scanner obtained 3D point cloud data, collected from Taoping main street. The ground survey was conducted in August 2021. A total of 123 3D laser scanning stations were used throughout the process, and laser data acquisition of the scene was performed at each station to record RGB color and texture. Software Cyclone (8.0, Leica) is adopted to stitch point clouds acquired from 123 stations, remove outliers and noise, and assign color to points. Some manual work was required to remove overlapping points and moving objects. The final product contains high resolution point clouds with the density 11,257 points/m2 based on CGCS2000 geodetic coordinate system. The points are densely packed providing refined details.
TLS dataset is able to reveal details that cannot be obtained from the air, especially the surface of the streets, building facade and the dark passages hidden in the buildings. Figure 4 is a street crossing acquired by TLS. The dataset is useful in modeling complex surfaces and spatial levels down to the millimeter.

A street crossing point cloud acquired by TLS
Point cloud segmentation
Point-wise annotation
To train a deep learning segmentation network, the training data and testing data should be prepared. Part of UAVDP dataset is selected as two groups to be the data source of training. The network extracts parts like buildings, paths, and ground from the point cloud scene, forming the essential elements for developing the Taoping BIM scenario. It assigns a semantic label for each point.
The first process is to divide dataset into training and testing sets. We adopt the method employed by the SensatUrban [42] and HRHD-HK [43] by splitting the whole area into tiles and designate certain tiles for training and some for testing. Therefore, 16 tiles colored orange for training and 6 tiles colored blue for testing. The scenes from those 22 tiles, contain a wealth of semantic information, as shown in Fig. 3.
The second process is to annotate labels for each point in selected tiles. To ensure the quality of annotated data while also saving time and effort, we adhere to three main guiding principles to final determine the categories. Firstly, we strive for balance in the distribution of data across various categories and within the train-test set. Secondly, the volume of manually segmented data should be minimized but sufficient for effective network training. Lastly, each category’s objects should exhibit unique geometric structure or texture distinctions, and meet BIM modeling requirement. We underwent three rounds of label verification, employing schemes that evolved from five categories, to thirteen, and finally to eleven. The results from our training indicated that the eleven-category system was most effective. The following is how we define the label types:
-
1.
Building: historical buildings;
-
2.
Vegetation: including trees, hedges, shrubs, bushes;
-
3.
Traffic road: highways;
-
4.
Ground: including the squares, paths connecting historical buildings;
-
5.
Meadow: grass land and gardens;
-
6.
Wall: retaining walls representing the edge of terrace;
-
7.
Rock: large volume rocks;
-
8.
Car: cars on roadsides and in parking lots;
-
9.
Others: living facilities, such as work shed, trash cans, street lightening, traffic signs and solar panels;
-
10.
Bridge: bridges;
-
11.
Water: rivers and water canals.
Figure 5 displays the distribution of 3D points across the different semantic categories in both the training and testing tiles of the Taoping dataset, and exhibit imbalance, though it is the reflection of real world condition. The imbalance in the number of points per category is an inevitable issue, which indeed hinders the recognition results, and also occurs in SensatUrban [42] and HRHD-HK [43]. The Taoping dataset is dominated by categories such as Building and Vegetation, and contains least points of Car and Bridge due to the scarce occurrence, for instance there is only one bridge in the village Fig. 6, on the other hand, provides visual examples of the annotations we have applied to the dataset. The point clouds are segmented using the software Cloud Compare.

Our dataset’s distribution of the number of each label in the training and testing sets. It’s worth noting that the vertical axis is displayed using a logarithmic scale. The category number on the horizontal axis corresponds to category definition above

Examples of Taoping dataset. Top: raw unannotated dataset. Bottom: annotated dataset with semantic labels for each point. Different classes are color-coded according to the color table at the bottom
Process workflow of KP-SG
The segmentation of point clouds involves two fundamental stages, as depicted in Fig. 7. The left part encompasses the point selection as input phase, while the right part encompasses the neural network phase. Here’s an in-depth look at the key components of this architecture:
-
1.
Input phase: Points taking the shape of spheres are chosen as input to the network until all tiles have been processed. This division is necessary because segmenting an extensive scene in its entirety is impractical. The guiding principle behind sphere selection is to strike a balance—the spheres should be sufficiently large to encapsulate ample geometric data for object recognition, yet not so large as to overwhelm the computational capabilities of the GPU.
-
2.
Spatial feature enrichment (SFE): Before entering the encoder stage, the network incorporates the SFE module. This module’s primary role is to extract and refine neighbor features, enriching the spatial information available to the network. It helps improve the network’s ability to capture local details and context.
-
3.
Encoder stage: In the encoder stage, the architecture leverages Kernel Point Convolution (KPConv) operations defined in KP-FCNN [46] to convolve points by ball query. The strided KPConv operations accompanied by grid subsampling, effectively create multiple layer scales and increase the receptive field. Then hierarchical and fine-grained local feature can be aggregated in fewer key points.
-
4.
Decoder stage: In the decoder stage, the feature matrix, obtained after the encoder’s operations, is distributed to every point using a nearest neighbor upsampling method. This process ensures that the decoder generates predictions for each point in the point cloud. To further enhance the network’s performance, skip connections are utilized to fuse the features from various scales, allowing the network to leverage both global and local information effectively.
-
5.
Global feature aggregation (GFA): Following the distribution of features in the decoder stage, the output feature assigned to each point is represented in a 128-dimensional matrix. These 128-dimensional features are then passed through the Global Feature Aggregation (GFA) layer. The GFA layer plays a pivotal role in consolidating global context and ensuring that the network has access to holistic information from the entire scene. The 128-dimensional features are processed by 1 × 1 convolution and transformed into an 11-dimensional representation, which corresponds to the 11 semantic label types that the network predicts.
Our primary contributions to this framework are the Spatial Feature Enrichment (SFE) and Global Feature Aggregation (GFA) modules, which are integrated into the KP-SG network to enhance overall performance.

Illustration of our network architectures for segmentation of 3D point clouds. SFE, GFA represent our spatial feature enrichment module and global feature aggregation layer, respectively. During the forward pass, the input features are processed through a series of operations (each represented by a different colored box), while the points are passed to each layer as a structural guide for the operations
Spatial feature enrichment (SFE)
3D point clouds contain abundant semantic information that goes beyond just 3D coordinates and color information. Spatial geometric structure of the point cloud can also be derived computationally, providing valuable insights. Existing networks fail to fully utilize the richness of 3D point clouds, as they typically only take into account the raw features of the point cloud as input, while ignoring the significance of contextual information. Instead, before feeding the point cloud into the network, we stitch the geometric details of the points’ neighbors to the original feature matrix as the initial features. Specifically, this layer includes the following steps:
Ball query to determine the neighborhood. We use the ball query method to determine a point’s neighborhood by selecting all points within a specified radius of the center point. Notably, in practice, we set an upper limit for the number of neighborhood points assigned to a point. When the number of points inside a ball exceeds K, we select the closest K points as the neighborhood points.
Feature enrichment. We stitch the 3D coordinates of the centroid, the coordinates of the neighbors, the relative coordinates of the neighbors concerning the centroid, and the distance of the neighbors from the centroid. We next perform the pooling operation to express the geometric features of the centroid. Specifically, for each of the K neighborhood points of a center point, their spatial structural features are encoded as follows:
where \(p_{i}\) and \(p_{i}^{k}\) denote the 3D coordinates of points, \(r_{i}\) denote the set of \(r_{i}^{k}\), and \(f_{i}\) represent the rest of the information besides the 3D coordinates of the \(i{\text{th}}\) point. The concatenation operation is denoted by \(\oplus\), and \(\Vert \cdot \Vert\) calculates the Euclidean distance between neighboring and center points. The process is illustrated in Fig. 8.

Left: spatial feature enrichment module. Blue represents the coordinate attributes, orange represents the remaining attributes such as RGB. Right: global feature aggregation layer. N is the number of points and D represents the feature dimension
Global feature aggregation (GFA)
As previously mentioned, the labeling of each point in a 3D scene is not only dependent on its own representation, but also on the representations of other points in the scene. There are other earlier works [59,60,61,62] that incorporate global features using attention mechanisms. However, these approaches can be computationally expensive, limiting their practical use in real-world scenarios.
Our proposed approach, on the other hand, is designed to strike a better balance between computational effort and prediction effectiveness. By using a simple operation to capture global features, our approach is able to achieve comparable accuracy compared to previous approaches while being more computationally efficient.
As illustrated in Fig. 8, our global feature aggregation unit consists of the following steps:
Capture global feature. Given the feature set \(F_{i}\), we use average pooling to capture global feature. Then the function g( ) is used to extend the global feature to a feature set having the same shape as \(F_{i}\). Formally, it is defined as follows:
Feature fusion. We begin by concatenating the original feature set \(F_{i}\) with the global feature set \(G_{i}\). Subsequently, we apply a shared function f( ) to reduce the dimension of the merged feature set. This function f( ) is essentially a shared multi-layer perception (MLP). This step can be formulated as follows:
Experiment setting
We have selected 5 representative methods, PointNet [36], PointNet++ [40], DGCNN [35], RandLA-Net [45], and KP-FCNN [46], as baseline approaches to evaluate the performance of our Taoping dataset. The intersection over union (IoU) of each class, overall accuracy (OA), and mean IoU (mIoU) are used to evaluate semantic segmentation results.
where N/N′ is the total number of points/labels, n is the nth label in N′, TP, FP and FN represent the number of points of true positives, false positives and false negatives of the predictions respectively. OA and mIoU evaluate the overall quality of semantic segmentation, and the IoU of each class measures the performance of each class.
16 tiles are used to train the model, and 6 tiles are used as the testing set. The experimental configurations are described as follows:
Initially, for networks such as PointNet, PointNet++, and DGCNN, the input points form a 3 m × 3 m block base area, containing 4096 points. KP-FCNN and KP-SG employ a grid downsampling method with a cell size of 0.08 m and a fixed input sphere radius of 3 m, containing between 5000 to 20,000 points. RandLA-Net’s input involves a KNN query with 50,000 points, the largest point set among all models. This standardization of data preprocessing, in terms of point density and input scale, is the result of extensive testing to determine the most optimal configuration for each network framework, at the same aligns the five models to a similar input scale, facilitating a more effective evaluation of each network’s inherent architecture.
Furthermore, four layers of each network, except PointNet, are configured to query 32 points as local neighbors. In terms of neighborhood feature extraction, RandLA-Net encompasses the broadest range, succeeded by KPConv, and subsequently, PointNet++ and DGCNN, which corresponds to their own input scale.
Additionally, all networks are set to use the Adam optimizer with a learning rate of 0.01. The experiments are conducted on an NVIDIA RTX2080Ti GPU.
BIM modeling
Revit modeling
As the deep learning model is trained, it becomes capable of segmenting entire scenes obtained from both UAVDP and TLS. The model intelligently assigns semantic labels to individual points, allowing us to import partial and downsampled point clouds into Revit in rcp format as positioning reference. This BIM modeling work is done by three groups, one group builds the terrain and path, one for buildings, and one for ethnic building components, and all models are textured. The three parts are then integrated to get the whole scenery. This entire process is illustrated in Fig. 9.

Revit hierarchical modeling process
To construct terrain and path models, point clouds from UAVDP, representing elements such as ground, meadow, traffic road, and similar features, are imported into Civil 3D. Here, they are used to create terrain curves in DWG format. Subsequently, these DWG curves are utilized in Revit to generate a Digital Elevation Model (DEM). However, UAVDP point clouds may not fully capture details due to tree or roof shading during aerial scanning, leading to potential inaccuracies in the terrain contours generated. To address this, TLS point clouds are employed to construct detailed and accurate models of paths, stairs, squares, flowerbeds, parking lots, and drainage channels, including their material aspects.
For architectural modeling, standard library objects in Revit are used to represent basic structural components like walls, roofs, and roof access ladders. However, UAVDP point clouds often lack data on interior alleyways created by overlapping buildings, which are a distinct feature of Taoping village. In contrast, TLS point clouds provide detailed descriptions of these alleyways, enabling us to clarify the architectural structure and incorporate additional details. The most challenging job is to distinguish individual buildings in Taoping, as buildings are closely packed and even share walls, increasing the complexity of BIM modeling.
To model unique ethnic architectural elements specific to Taoping, such as doors, windows, street crossings, railings, and arches, which are not found in standard BIM libraries, we analyze the point clouds to identify common features. Based on these observations, we develop a customized Taoping library. This allows for the integration of these unique elements into the scene by adjusting their corresponding parameters to suit the specific context.
Ultimately, the process of integrating three parts, facilitates the creation of Level of Detail 200 (LoD-200) BIM architecture models with materials. These models feature clear building appearances and accessible passageways, which are essential for spatial analysis and virtual reality roaming.
Semantic enrichment
The BIM models provide complete geometry, it is essential to integrate semantic information pertinent to our area of interest. This integration begins with the documentation of spatial forms, which encapsulate the village’s diverse architectural styles and its complex network of paths, along with their varied combinations. Furthermore, we have identified 18 scenic spots based on tourism narratives, providing textual descriptions of the historical functions associated with each spot. These three attribute types not only embody the historical construction wisdom but also stand as significant tourist attractions in Taoping, deserving of preservation and in-depth study.
Path encoding and semantic information
The streets and alleys of Taoping, characterized by their undulating elevations, winding paths, and varying widths that expand and contract unpredictably, actively adapt to the complex terrain using various methods. This approach not only minimizes excavation and construction costs but also contributes to a streetscape that is rich in diversity, offering a dynamic and visually engaging experience. Besides, due to the complexity of architectural space distribution, some passages are hidden beneath buildings, forming labyrinth-like dark tunnels, while others utilize rooftops of buildings as pathways, creating spacious and efficient thoroughfares. From a visitor’s perspective, these two modes of passage offer completely contrasting experiences.
To quantify the spatial characteristics of paths, we first segment path into 54 sections and encode them in the BIM model. Then, following the three aspect of spatial features, we assign appropriate labels to each segment of paths.
-
Path type:
The paths in Taoping village are winding and intricate, we marked the changes in path direction as five types: straight, turn, expansions and contractions, intersections and squares. straight means a path has no direction change. turn indicates changes in the direction of the path, while expansions and contractions reflects variations in the width of the path. intersections represent the possibility of the path extending in multiple directions. There are several squares inside the village, where villagers hold meetings, religious ceremonies, and celebrations. The five path types are shown in Fig. 10.
Fig. 10 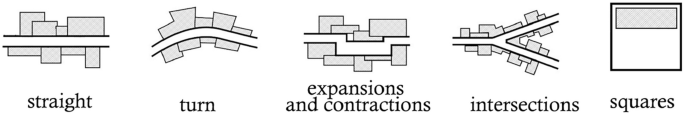
Path types
-
Height variation: To adapt to the variations in mountainous terrain, the elevation of Taoping village paths also varies. We have categorized the changes in path elevation into three types: flat, uphill, and downhill. The three path height variation types are shown in Fig. 11.
Fig. 11 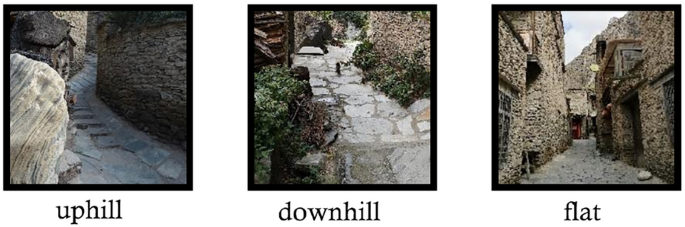
Path height variation types
-
Section type: The cross-sectional profile of the streets reflects the enclosing forms created by buildings and vegetation, directly affecting how people on the street perceive the architectural space. In Taoping, the variety in cross-sectional combinations of streets and alleys creates a fascinating interplay of openness, enclosure, light, and shadow. Here, we categorize the spatial types of street and alley cross-sections into three classes: open, single-sided, double-sided, and enclosed. An open section space refers to areas where the path is not bounded by vertical spatial interfaces on either side, typically found in squares or rooftop platforms, giving a sense of spaciousness and bright transparency. A single-sided section indicates that one side of the path is lined with buildings or tall plants, while the other side is either open or has a vertical drop, creating a sense of reliance. A double-sided path flanked by building walls on both sides gives a feeling of being enclosed and compressed when one is walking through it. A enclosed section mean the path is surrounded by plants and buildings on both sides, and even the top may be covered by structures, like underpasses beneath buildings, creating a feeling of strong compression, dim lighting, and a loss of spatial and temporal awareness. The four path section types are shown in Fig. 12.
Fig. 12 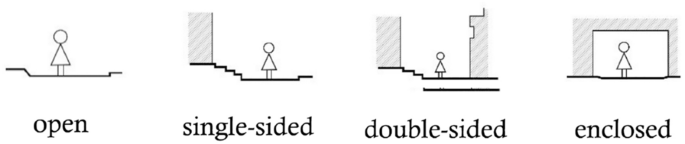
Path section types
-
Scenic spot with history significant.


Building encoding and semantic information
According to the results of the BIM model, there are 206 buildings in Taoping village. The spatial structure layout of the settlements is based on the natural landscape environment. The buildings are densely packed, clustered layer by layer, and facing the same direction. It fully embodies the regional cultural characteristics of the Qiang people and forms a mountain fortress style with free personality and changeable forms.
To quantify the spatial forms and distribution pattern of Taoping settlements, we encode each building for the BIM models. Then, following the two aspects of spatial features, we assign appropriate labels to each building.
-
Building types:
Based on the differences in function and structure, we categorize building types into five classes: terraced buildings, detached buildings, whistle watchtower, street crossing and landscape pavilions. terraced buildings are usually multi-story buildings, and the second and upper floors were set back a few meters to allow the flat roof on the lower floors to form a large open-air terrace space, thus giving the building a “stepped” stacked form. Detached buildings come in two main forms. The first is the independent detached building, while the other type serves to fill the gaps between the main structures. Therefore, the buildings of Taoping village cover almost the whole ground of the village. Whistle watchtowers, that are over 15 ms in height, serve as the village’s “eyes,” keeping a watchful gaze on the activities both within and outside the village. Street crossing acts as a “bridge” constructed above the road, linking the buildings on either side of the street. It serves as an efficient solution to maximize space within the confined residential area of the walled village. Landscape pavilions are in the style of square pavilions with pointed roofs, which can be used for resting and people can also walk underneath the pavilions. The five building types are shown in Fig. 13.
Fig. 13 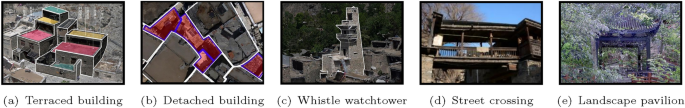
The examples of building types
-
Morphology types:
Architectural morphology form is the external expression of architectural space. It is composed of abstract points, lines, surfaces, and bodies, and their relative relationships are determined by the environment. Taoping village buildings have extremely strong geometric features and are very varied and irregular. They are too compactly distributed, with multiple buildings sharing a common wall to evaluate from traditional measurement method. Therefore we sorted out all the morphology types based on our constructed BIM models. The Fig. 14 illustrates buildings’ planar morphology types.
Fig. 14 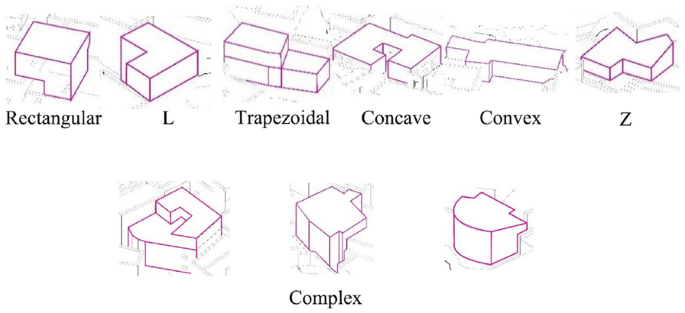
Planar morphology types
-
Scenic spot with history significant.


In essence, our approach emphasizes the external spaces related to architectural design and spatial forms, offering data support for future digital twin services in architectural conservation and enhancing the human touring experience.
Results and discussion
KP-SG network performance
The Kernel Point Segmentation and Global feature aggregation (KP-SG) algorithm represents a significant advancement in the field of point cloud processing. This approach builds upon the foundation laid by previous models like KP-FCNN, introducing key enhancements that improve segmentation performance in complex Taoping point cloud datasets.
Table 1 displays the results of the baseline methods for semantic segmentation on the Taoping dataset. It can be seen that the accuracy of KP-SG for building reached 81%, for vegetation it is 83%, for traffic road it achieves 93%, and for water, it was 71%. The approach outperforms other semantic segmentation baseline methods in both mIoU and OA on our dataset. We improved mIoU by 2.53% compared to the original KP-FCNN [46] network, demonstrating the effectiveness of our spatial feature enrichment module and global feature aggregation layer. The recognition accuracy of eight out of eleven categories has been improved. It is particularly significant enhancement in the precision of identifying ground, meadow, car, and water. The poor performance in the others category is attributable to the absence of distinct and uniform geometric and color features in the objects classified under this category. Similarly, the categories bridge and car exhibit subpar performance, which can be ascribed to the limited samples of these two categories.
We illustrate the effectiveness of our improvements by visualizing the results of KP-FCNN [46] and KP-SG in Fig. 15 on six contiguous tiles for testing. Box a and b represents KP-SG accurately identified ground so that the complete paths can be presented. Box c demonstrates that KP-SG is better at differentiating between water and ground, Box d demonstrates that KP-SG is better at segmenting car, and Box e demonstrates that KP-SG is better at differentiating between meadow and vegetation.

Visualization results of KP-SG and its original network architecture KP-FCNN [46] on the Taoping dataset
KP-SG algorithm marks a significant step forward in point cloud segmentation. Its ability to integrate local and global features effectively results in improved segmentation accuracy and efficiency, making it an invaluable asset in the realm of 3D data processing and analysis.
KP-SG network advantages analysis
One of the primary improvements offered by the KP-SG algorithm is its Spatial Feature Enrichment (SFE) module. This module enriches the spatial context of each point by incorporating more geometric details from neighboring points into the original feature matrix. By doing so, KP-SG effectively captures local geometric structures, which are crucial for distinguishing the small-sized objects, for example car. After removing it from the network, there is a decrease in mIoU from 53.03 to 51.20 from Table 2.
Another significant enhancement in KP-SG is the Global Feature Aggregation (GFA) layer. It allows KP-SG to integrate global contextual information from the entire input. This global perspective ensures that the segmentation is not only based on local point characteristics but also informed by the overall structure. Such a holistic approach leads to more accurate and coherent segmentation results, especially in differentiating between ground and building, as well as between vegetation and meadow. From Table 2, when the layer is removed, there is a decrease in both OA and mIoU.
Ultimately, the superior performance of the KP-SG and KP-FCNN networks can also be attributed to their input configuration, the initial step of segmentation framework. For our dataset featuring traditional villages, we encounter a broad range of building sizes, spanning from just a few meters to several tens of meters, alongside smaller objects like cars and garbage cans (1–2 ms). This wide size range poses a recognition challenge. Therefore we conducted two distinct sets of experiments employing these methods. In the first set, we utilized input shapes in the form of 4 m × 4 m boxes and spheres with a similar volume, having a radius of 2 ms and containing 4096 points. In the second set, our inputs took the shape of 10 m × 10 m boxes and spheres with a 4 m radius, accommodating 4096 × 6 points. Notably, both sets of experiments employed the RandLA-Net due to its rapid computation capabilities. The experiment shown in Table 3 reveals two key findings. In general, larger input sphere blocks generally lead to better recognition performance for the ability containing the whole objects’ geometrical structure. However large inputs also increase computational time. Meanwhile smaller objects mIoU can occasionally decrease. The two findings imply that larger input sizes don’t always yield better results. Thirdly, when input volumes are similar, sphere-shaped input surpasses box-shaped input. This distinction is visually evident in Fig. 16, where box-shaped input produces less accurate segmentation results with box-like edges and corners. The choice of input method significantly influences semantic segmentation results. In our model tuning process, we ultimately selected a 3 m radius spherical point cloud as the input, striking a balance between computational efficiency and high performance.

Visualization of segmentation results by different input shapes
KP-SG effects on BIM model transformation
The integration of the Kernel Point Segmentation and Global feature aggregation (KP-SG) algorithm into the Building Information Modeling (BIM) transformation process has notably revolutionized the digital reconstruction and preservation of heritage sites, exemplified by its application in Taoping village. This synergy between advanced deep learning techniques and BIM methodologies significantly enhances the accuracy and detail of BIM models derived from complex point cloud data, a crucial advancement for historical and cultural preservation.
Firstly, KP-SG streamlines the BIM reconstruction workflow and enhances collaborative efficiency. It segments the BIM workflow into distinct layers managed by different teams, each focusing on specific elements like terrain, paths, buildings, and interior alleys. These teams work on their respective layers independently, extracting relevant point clouds instead of all datasets, which significantly help reduce computer computational load, accelerate modeling speed, and enhance efficiency.
Secondly, KP-SG ensures increased accuracy and consistency in integrating data from two different sources: UAVDP and TLS. The UAVDP data, though less accurate due to software estimations and lacking detail because of obstructions from trees or rooftops, is refined and aligned with the more detailed TLS data. KP-SG’s advanced segmentation capabilities are instrumental in extracting and enhancing building and ground elements, providing accurate references and supplementing data. Moreover, KP-SG is effective in reconciling datasets acquired at different times, removing transient elements like people, garbage, or other variable and distracting components from the scene.
This enhanced precision is vital for accurately capturing the unique architectural features and layout of Taoping village, ensuring that the digital reconstruction authentically represents its historical and cultural significance.
Digital twin platform and future application development
The transformation of semantic point clouds into Building Information Models (BIM) for heritage sites like Taoping Village is pivotal for their preservation and analysis. Utilizing UAVDP and TLS technologies, these BIM models capture highly accurate and detailed representations of heritage structures. Crucially, they integrate semantic information with geometric data, thereby enriching 3D models with details about characteristics and functions, such as building types and historical significance. This enriched data not only aids in architectural analysis and restoration efforts but also enhances the creation of immersive virtual reality experiences, allowing for a more dynamic visualization of heritage architecture.
In the future based on the integrated data and the semantics, the heritage site digital twin platform is to provide comprehensive services, such as accuracy evaluation and process automation in BIM Modeling, site reconstruction monitoring, real time spatial analysis, AI powered generative building design and user behavior monitoring and analysis by incorporating VR. Technically, the platform is based on Cesium [57], a library that provides rapid pipelines for creating 3D Tiles from diverse data sources for massive geospatial 3D data streaming and rendering [63]. Cesium also supports interactive end-user applications, making user behavior monitoring and data collection practical. By integrating these insights, a synergistic digital twin platform with built-in advanced intelligent algorithms are beneficial for the sustainable regeneration and restoration of heritage sites, that goes beyond simple documentation.
Conclusion
The research undertaken in Taoping Village, an architecturally and culturally significant location in Sichuan, China, stands as a groundbreaking endeavor in heritage preservation, harnessing the power of advanced digital technologies. This study adeptly converted semantic point clouds into intricate BIM, utilizing the KP-SG deep learning neural network for effective segmentation of point clouds. The BIM models not only embody spatial characteristics and historical data within the BIM framework but also are enriched with detailed materials and culturally-specific elements, significantly enhancing the virtual reality (VR) experience. This novel approach, combining UAVDP and TLS, marks a remarkable innovation in the realm of digital heritage preservation.
There are two main innovations of our research. The first one is the novel KP-SG deep learning technique. It significantly improved the segmentation performance of point clouds, demonstrating a substantial enhancement in the mean Intersection over Union (mIoU) compared to existing models. This improvement in segmentation accuracy is crucial for processing the complex and detailed data intrinsic to heritage sites like Taoping village, making scan to BIM process more accurate and efficient, and powering future automation development. The other key innovation lies in the development of a comprehensive methodology for integrating various types of data, each serving distinct purposes. We focus on efficient data management and integration and employ Python programming language to deliver high-level intelligent services avoiding use of diverse softwares.
In summary, the innovations presented in this research offer a new paradigm in the field of digital heritage preservation. By combining cutting-edge deep learning techniques with digital modeling and visualization technologies, we pave the way for more effective and engaging methods of conserving and showcasing cultural heritage sites worldwide.
Availability of data and materials
The Taoping dataset in this study are available on request from the corresponding author.
References
Liu X, Yuan L, Tan G. Identification and hierarchy of traditional village characteristics based on concentrated contiguous development-taking 206 traditional villages in Hubei province as an example. Land. 2023;12(2):471. https://doi.org/10.3390/land12020471.
Pei Y, Gong K, Leng J. Study on the inter-village space of a traditional village group in Huizhou region: Hongguan village group as an example. Front Archit Res. 2020;9(3):588–605. https://doi.org/10.1016/j.foar.2020.03.006.
Xiang H, Qin Y, Xie M, Zhou B. Study on the space gene diversity of traditional dong villages in the southwest Hunan province of China. Sustainability. 2022;14(21):14306. https://doi.org/10.3390/su142114306.
Zhu J, Xu W, Xiao Y, Shi J, Hu X, Yan B. Temporal and spatial patterns of traditional village distribution evolution in Xiangxi, China: identifying multidimensional influential factors and conservation significance. Herit Sci. 2023;11(1):261. https://doi.org/10.1186/s40494-023-01110-3.
Chen W, Yang L, Wu J, Wu J, Wang G, Bian J, Zeng J, Liu Z. Spatio-temporal characteristics and influencing factors of traditional villages in the Yangtze river basin: a geodetector model. Herit Sci. 2023;11(1):111. https://doi.org/10.1186/s40494-023-00948-x.
Yang X, Pu F. Clustered and dispersed: exploring the morphological evolution of traditional villages based on cellular automaton. Herit Sci. 2022;10(1):26. https://doi.org/10.1186/s40494-022-00766-7.
Cao H, Tamás AM, Sztranyák G, Zhang E. Regeneration and sustainable development of vernacular architecture. Pollack Periodica. 2022;17(2):151–6. https://doi.org/10.1556/606.2022.00530.
Zhou Z. Towards collaborative approach? Investigating the regeneration of urban village in Guangzhou, China. Habitat Int. 2014;44:297–305. https://doi.org/10.1016/j.habitatint.2014.07.011.
Liu X, Li Y, Wu Y, Li C. The spatial pedigree in traditional villages under the perspective of urban regeneration-taking 728 villages in Jiangnan region, China as cases. Land. 2022;11(9):1561. https://doi.org/10.3390/land11091561.
Ren X. Reimagining local worlds: Wen village conservation and regeneration by amateur architecture studio. Built Herit. 2023;7(1):26. https://doi.org/10.1186/s43238-023-00108-x.
Liu S, Ge J, Bai M, Yao M, He L, Chen M. Toward classification-based sustainable revitalization: assessing the vitality of traditional villages. Land Use Policy. 2022;116(1):106060. https://doi.org/10.1016/j.landusepol.2022.106060
Ding H. Research on architectural function of Taoping Qiang village based on functionalism. Open Access Libr J. 2021;8(6):1–9. https://doi.org/10.4236/oalib.1107601.
Chen B. Research on the construction of the lighting project of Taoping Qiang village under the contemporary digital landscape design. Open J Soc Sci. 2020;8(04):274. https://doi.org/10.4236/jss.2020.84020.
Wu M, Gao X, Cao M, Papa E. Large-scale enterprises, social capital and the post-disaster development of community tourism: the case of Taoping, China. Int J Tour Res. 2021;23(5):757–69. https://doi.org/10.1002/jtr.2439.
Li Y, Du Y, Yang M, Liang J, Bai H, Li R, Law A. A review of the tools and techniques used in the digital preservation of architectural heritage within disaster cycles. Herit Sci. 2023;11:199. https://doi.org/10.1186/s40494-023-01035-x.
Jiang S, Jiang W, Wang L. Unmanned aerial vehicle-based photogrammetric 3D mapping: a survey of techniques, applications, and challenges. IEEE Geosci Remote Sens Mag. 2022;10(2):135–71. https://doi.org/10.1109/MGRS.2021.3122248.
Moyano J, Nieto-Julián JE, Lenin LM, Bruno S. Operability of point cloud data in an architectural heritage information model. Int J Archit Herit. 2022;16(10):1588–607. https://doi.org/10.1080/15583058.2021.1900951.
Alshawabkeh Y, Baik A, Fallatah A. As-textured as-built BIM using sensor fusion, Zee Ain historical village as a case study. Remote Sens. 2021;13(24):5135. https://doi.org/10.3390/rs13245135.
Lin G, Giordano A, Sang K, Stendardo L, Yang X. Application of territorial laser scanning in 3D modeling of traditional village: a case study of Fenghuang village in China. ISPRS Int J Geo-Inf. 2021;10(11):770. https://doi.org/10.3390/ijgi10110770.
Brendan H, Serrano N. Point cloud aesthetics. J Digit Landsc Archit. 2022;7:335–44. https://doi.org/10.14627/537724033.
Scheiblauer C, Zimmermann N, Wimmer M. Interactive domitilla catacomb exploration. VAST: international symposium on virtual reality. Archaeol Intell Cult Herit. 2009;1:65–72. https://doi.org/10.2312/VAST/VAST09/065-072.
Liu J, Azhar S, Willkens D, Li B. Static terrestrial laser scanning (TLS) for heritage building information modeling (HBIM): a systematic review. Virtual Worlds. 2023;2(2):90–114. https://doi.org/10.3390/virtualworlds2020006.
Baik A. From point cloud to Jeddah heritage Bim Nasif historical house—case study. Digit Appl Archaeol Cult Herit. 2017;4:1–18. https://doi.org/10.1016/j.daach.2017.02.001.
Yang X, Lu YC, Murtiyoso A, Koehl M, Grussenmeyer P. HBIM modeling from the surface mesh and its extended capability of knowledge representation. ISPRS Int J Geo-Inf. 2019;8(7):301. https://doi.org/10.3390/ijgi8070301.
Quattrini R, Pierdicca R, Morbidoni C. Knowledge-based data enrichment for HBIM: exploring high-quality models using the semantic-web. J Cult Herit. 2017;28:129–39. https://doi.org/10.1016/j.culher.2017.05.004.
Moyano J, León J, Nieto-Julián JE, Bruno S. Semantic interpretation of architectural and archaeological geometries: point cloud segmentation for HBIM parameterisation. Autom Constr. 2021;130:103856. https://doi.org/10.1016/j.autcon.2021.103856.
Galanakis D, Maravelakis E, Pocobelli DP, Vidakis N, Petousis M, Konstantaras A, Tsakoumaki M. SVD-based point cloud 3D stone by stone segmentation for cultural heritage structural analysis—the case of the Apollo temple at Delphi. J Cult Herit. 2023;61:177–87. https://doi.org/10.1016/j.culher.2023.04.005.
Abbate E, Invernizzi S, Spanò A. HBIM parametric modelling from clouds to perform structural analyses based on finite elements: a case study on a parabolic concrete vault. Appl Geomat. 2022;14(S1):79–96. https://doi.org/10.1007/s12518-020-00341-4.
Grilli E, Özdemir E, Remondino F. Application of machine and deep learning strategies for the classification of heritage point clouds. Int Arch Photogramm Remote Sens Spat Inf Sci. 2019;XLII–4/W18:447–54. https://doi.org/10.5194/isprs-archives-XLII-4-W18-447-2019.
Pierdicca R, Paolanti M, Matrone F, Martini M, Morbidoni C, Malinverni ES, Frontoni E, Lingua AM. Point cloud semantic segmentation using a deep learning framework for cultural heritage. Remote Sens. 2020;12(6):1005. https://doi.org/10.3390/rs12061005.
Haznedar B, Bayraktar R, Ozturk AE, Arayici Y. Implementing pointnet for point cloud segmentation in the heritage context. Herit Sci. 2023;11(1):2. https://doi.org/10.1186/s40494-022-00844-w.
Vandenabeele L, Loverdos D, Pfister M, Sarhosis V. Deep learning for the segmentation of large-scale surveys of historic masonry: a new tool for building archaeology applied at the Basilica of St Anthony in Padua. Int J Archit Herit. 2023;1:1–13. https://doi.org/10.1080/15583058.2023.2260771.
Teruggi S, Grilli E, Russo M, Fassi F, Remondino F. A hierarchical machine learning approach for multi-level and multi-resolution 3D point cloud classification. Remote Sens. 2020;12(16):2598. https://doi.org/10.3390/rs12162598.
Artopoulos G, Maslioukova MI, Zavou C, Loizou M, Deligiorgi M, Averkiou M. An artificial neural network framework for classifying the style of cypriot hybrid examples of built heritage in 3D. J Cult Herit. 2023;63:135–47. https://doi.org/10.1016/j.culher.2023.07.016.
Wang Y, Sun Y, Liu Z, Sarma SE, Bronstein MM, Solomon JM. Dynamic graph CNN for learning on point clouds. ACM Trans Graph. 2019;38(5):1–12. https://doi.org/10.48550/arXiv.1801.07829.
Qi CR, Su H, Mo K, Guibas LJ. Pointnet: deep learning on point sets for 3D classification and segmentation. In: Proceedings of the IEEE conference on computer vision and pattern recognition (CVPR), vol. 1. 2017. p. 652–60. https://doi.org/10.1109/CVPR.2017.16.
Fukushima K. Neocognitron: a self-organizing neural network model for a mechanism of pattern recognition unaffected by shift in position. Biol Cybern. 1980;36:193–202. https://doi.org/10.1007/BF00344251.
Rumelhart DE, Hinton GE, Williams RJ. Learning representations by back-propagating errors. Nature. 1986;323:533–6. https://doi.org/10.1038/323533a0.
Matrone F, Grilli E, Martini M, Paolanti M, Pierdicca R, Remondino F. Comparing machine and deep learning methods for large 3D heritage semantic segmentation. ISPRS Int J Geo-Inf. 2020;9(9):535. https://doi.org/10.3390/ijgi9090535.
Qi CR, Yi L, Su H, Guibas LJ. Pointnet++: deep hierarchical feature learning on point sets in a metric space. Adv Neural Inf Process Syst. 2017;30:1–13. https://doi.org/10.48550/arXiv.1706.02413.
Zhan K, Shi J, Wang H, Xie Y, Li Q. Computational mechanisms of pulse-coupled neural networks: a comprehensive review. Arch Comput Methods Eng. 2017;24:573–88. https://doi.org/10.1007/s11831-016-9182-3.
Hu Q, Yang B, Khalid S, Xiao W, Trigoni N, Markham A. Sensaturban: learning semantics from urban-scale photogrammetric point clouds. Int J Comput Vis. 2022;130:316–43. https://doi.org/10.1007/s11263-021-01554-9.
Li M, Wu Y, Yeh AG, Xue F. HRHD-HK: a benchmark dataset of high-rise and high-density urban scenes for 3D semantic segmentation of photogrammetric point clouds. In: 2023 IEEE international conference on image processing challenges and workshops (ICIPCW), vol. 1. 2023. p. 3714–8. https://doi.org/10.1109/icipc59416.2023.10328383.
Hackel T, Savinov N, Ladicky L, Wegner JD, Schindler K, Pollefeys M. Semantic3d.net: a new large-scale point cloud classification benchmark. ISPRS Ann. 2017;IV:91–8. https://doi.org/10.48550/arXiv.1704.03847.
Hu Q, Yang B, Xie L, Rosa S, Guo Y, Wang Z, Trigoni N, Markham A. Randla-net: efficient semantic segmentation of large-scale point clouds. In: Proceedings of the IEEE/CVF conference on computer vision and pattern recognition, vol. 1. 2020. p. 11108–17. https://doi.org/10.48550/arXiv.1911.11236.
Thomas H, Qi CR, Deschaud JE, Marcotegui B, Goulette F, Guibas LJ. Kpconv: flexible and deformable convolution for point clouds. In: Proceedings of the IEEE/CVF international conference on computer vision (ICCV), vol. 1. 2019. p. 6411–20. https://doi.org/10.48550/arXiv.1904.08889.
Austin M, Delgoshaei P, Coelho M, Heidarinejad M. Architecting smart city digital twins: combined semantic model and machine learning approach. J Manag Eng. 2020;36(4):04020026. https://doi.org/10.1061/(ASCE)ME.1943-5479.0000774.
Jeddoub I, Nys GA, Hajji R, Billen R. Digital twins for cities: analyzing the gap between concepts and current implementations with a specific focus on data integration. Int J Appl Earth Obs Geoinf. 2023;122:103440. https://doi.org/10.1016/j.jag.2023.103440
Guo L, Xu J, Li J, Zhu Z. Digital preservation of Du Fu Thatched Cottage memorial garden. Sustainability. 2023;15(2):1359. https://doi.org/10.3390/su15021359.
Gabellone F. Digital twin: a new perspective for cultural heritage management and fruition. Acta IMEKO. 2022;11(1):1–7. https://doi.org/10.21014/acta_imeko.v11i1.1085.
Poux F, Neuville R, Van Wersch L, Nys GA, Billen R. 3D point clouds in archaeology: advances in acquisition, processing and knowledge integration applied to quasi-planar objects. Geosciences. 2017;7(4):96. https://doi.org/10.3390/geosciences7040096.
Jackson D, Gilbert J. Webgl 2.0 specification 2023. https://registry.khronos.org/webgl/specs/latest/2.0/. Accessed 8 Feb 2024.
Schütz M, Ohrhallinger S, Wimmer M. Fast out-of-core octree generation for massive point clouds. Comput Graph Forum. 2020;39(7):155–67. https://doi.org/10.1111/cgf.14134.
Angjeliu G, Coronelli D, Cardani G. Development of the simulation model for digital twin applications in historical masonry buildings: the integration between numerical and experimental reality. Comput Struct. 2020;238:106282. https://doi.org/10.1016/j.compstruc.2020.106282
Wang Y, Agkathidis A, Crompton A. Parametrising historical Chinese courtyard-dwellings: an algorithmic design framework for the digital representation of Siheyuan iterations based on traditional design principles. Front Archit Res. 2020;9(4):751–73. https://doi.org/10.1016/j.foar.2020.07.003.
Jouan P, Hallot P. Digital twin: research framework to support preventive conservation policies. ISPRS Int J Geo-Inf. 2020;9(4):228. https://doi.org/10.3390/ijgi9040228.
Cesium. The platform for 3D geospatial 2023. https://cesium.com/. Accessed 8 Feb 2024.
Chen Y, Shooraj E, Rajabifard A, Sabri S. From IFC to 3D tiles: an integrated open-source solution for visualising BIMs on cesium. ISPRS Int J Geo-Inf. 2018;7(10):393. https://doi.org/10.3390/ijgi7100393.
Xie S, Liu S, Chen Z, Tu Z. Attentional shapecontextnet for point cloud recognition. In: Proceedings of the IEEE conference on computer vision and pattern recognition, vol. 1. 2018. p. 4606–15. https://doi.org/10.1109/CVPR.2018.00484.
Liu X, Han Z, Liu YS, Zwicker M. Point2sequence: learning the shape representation of 3D point clouds with an attention-based sequence to sequence network. Proc AAAI Conf Artif Intell. 2019;33(1):8778–85. https://doi.org/10.1609/aaai.v33i01.33018778.
Yang J, Zhang Q, Ni B, Li L, Liu J, Zhou M, Tian Q. Modeling point clouds with self-attention and gumbel subset sampling. In: Proceedings of the IEEE/CVF conference on computer vision and pattern recognition, vol. 1. 2019. p. 3323–32. https://doi.org/10.48550/arXiv.1904.03375.
Lee J, Lee Y, Kim J, Kosiorek A, Choi S, Teh YW. Set transformer: a framework for attention-based permutation-invariant neural networks. in: International conference on machine learning, vol. 1. 2019. p. 3744–53 https://doi.org/10.48550/arXiv.1810.00825.
Tang R, Zhu J, Ren Y, Ding Y, Wu J, Guo Y, Xie Y. A knowledge-guided fusion visualisation method of digital twin scenes for mountain highways. ISPRS Int J Geo-Inf. 2023;12(10):424. https://doi.org/10.3390/ijgi12100424.
Acknowledgements
None.
Funding
This work was supported by the Natural Science Foundation of China (No. 51908385).
Author information
Authors and Affiliations
Contributions
XP: supervision, methodology. QL: methodology, validation, original draft preparation, writing. SY: methodology, validation, analysis, validation. LL: methodology, validation, analysis, validation. LG: conceptualization. BH: reviewing, editing.
Corresponding author
Ethics declarations
Ethics approval and consent to participate
This research adheres to ethical guidelines provided by relevant Ethical Committees.
Competing interests
The authors declare no competing interests.
Additional information
Publisher's Note
Springer Nature remains neutral with regard to jurisdictional claims in published maps and institutional affiliations.
Rights and permissions
Open Access This article is licensed under a Creative Commons Attribution 4.0 International License, which permits use, sharing, adaptation, distribution and reproduction in any medium or format, as long as you give appropriate credit to the original author(s) and the source, provide a link to the Creative Commons licence, and indicate if changes were made. The images or other third party material in this article are included in the article’s Creative Commons licence, unless indicated otherwise in a credit line to the material. If material is not included in the article’s Creative Commons licence and your intended use is not permitted by statutory regulation or exceeds the permitted use, you will need to obtain permission directly from the copyright holder. To view a copy of this licence, visit http://creativecommons.org/licenses/by/4.0/. The Creative Commons Public Domain Dedication waiver (http://creativecommons.org/publicdomain/zero/1.0/) applies to the data made available in this article, unless otherwise stated in a credit line to the data.
About this article

Cite this article
Pan, X., Lin, Q., Ye, S. et al. Deep learning based approaches from semantic point clouds to semantic BIM models for heritage digital twin. Herit Sci 12, 65 (2024). https://doi.org/10.1186/s40494-024-01179-4
Received:
Accepted:
Published:
DOI: https://doi.org/10.1186/s40494-024-01179-4