- Original Paper
- Open access
- Published:
Analysis and comparison of traffic flow models: a new hybrid traffic flow model vs benchmark models
European Transport Research Review volume 13, Article number: 58 (2021)
Abstract
Background
This paper compares a hybrid traffic flow model with benchmark macroscopic and microscopic models. The proposed hybrid traffic flow model may be applied considering a mixed traffic flow and is based on the combination of the macroscopic cell transmission model and the microscopic cellular automata.
Modelled variables
The hybrid model is compared against three microscopic models, namely the Krauß model, the intelligent driver model and the cellular automata, and against two macroscopic models, the Cell Transmission Model and the Cell Transmission Model with dispersion, respectively. To this end, three main applications were considered: (i) a link with a signalised junction at the end, (ii) a signalised artery, and (iii) a grid network with signalised junctions.
Results
The numerical simulations show that the model provides acceptable results. Especially in terms of travel times, it has similar behaviour to the microscopic model. By contrast, it produces lower values of queue propagation than microscopic models (intrinsically dominated by stochastic phenomena), which are closer to the values shown by the enhanced macroscopic cell transmission model and the cell transmission model with dispersion. The validation of the model regards the analysis of the wave propagation at the boundary region.
1 Background and motivation
Although three main groups of traffic flow models have been identified in the literature, namely macroscopic, mesoscopic and microscopic models [1], hybrid traffic flow models obtained by combining models from two of the above groups have more recently been explored. This paper aims to compare a proposed hybrid traffic flow model (H-CA&CTM [2], with some benchmark macroscopic and microscopic models.
More in general the macroscopic models are based on aggregate variables representing user behaviour as flows, density, and aggregate variables describing supply, such as speed. They can be classified in accordance with the literature depending on the continuous or discrete representation of space and time. The basic model, formulated in the case of continuous space and time, was the first-order model developed by Lighthill and Whitham [3] and Richards [4] (the Lighthill–Whitham–Richards—LWR—model). Subsequently, Payne [5], Ross [6], and Kerner and Konhäuser [7] proposed second-order models to overcome limitations such as the instantaneous driver’s reaction and the impact of the inertial effect, as well as drivers’ reactions to the conditions of the traffic context. Finally, within the same group of models, the third-order model was proposed by Helbing [8], based on three states: vehicle density, mean speed and mean speed dispersion.
To solve the first-order model, the cell transmission model (CTM; [9], a discrete space and time model was introduced. In the class of space-discrete and time-continuous models is the model introduced by Newell [10], based on a simplified theory of kinematic waves focusing on the representation of inflow/outflow curves, and the state of flow at an extreme. Consistent with simplified first-order kinematic wave theory after Newell, Yperman [11] proposed the link transmission model (LTM) in which link volumes and link travel times are obtained starting from cumulative vehicle numbers.
Concerning the microscopic approach, this class of traffic flow models aim to reproduce single vehicle behaviour by considering the disaggregate representation of the position as well as the disaggregate representation of speeds. This class of models has been widely studied by researchers and four main groups may be identified: stimulus–response models, safety distance models, optimal velocity models and physiology-psychology models.
In the case of stimulus–response models, the leading vehicle and follower are analysed as a pair and it is supposed that each vehicle reacts to the stimulus of the leading vehicle. Preliminary studies may be found in Chandler et al. [12] and Gazis et al. [13]. Although the latter model was better able to model the case of high density by considering the stimulus not only a function of the leader vehicle as in the former model but also as a function of the speed difference between the leader and the follower, this class of model is not reliable in the case of free flow conditions. This shortcoming has given rise to other approaches in the literature [14,15,16].
The second group of models was primarily introduced by Gipps [17] and focused on the safe distance to ensure collision avoidance. Further refinements of the model were subsequently proposed especially by Leutzbach [18] who took account of different steps in driver behaviour (i.e. perception, decision and braking). Other enhancements of the Gipps model are proposed by the Krauß model [19] through the introduction of stochasticity.
The optimal velocity model [20] is based on the discrepancy between desired speed and actual speed. The model has been further developed by several authors [21,22,23,24,25]. In particular, Treiber et al. [26] proposed the intelligent driver model (IDM) which takes into account the desired space headway and desired speed.
Moreover, there are the action point models first introduced by Michaels [27], generally referred to as physiology-psychology models. Further developed by Wiedemann [28], the models are based on different regimes (i.e., free driving, closing in and emergency) depending different thresholds piloting the behaviour of the follower when approaching to the leading vehicle.
Finally, mention must be made of hybrid traffic flow models which are based on a combination of two traffic flow models [29,30,31,32]. Hybrid traffic flow models were introduced to obtain properties of different models at different levels of network layouts.
For instance, macroscopic modelling is more suitable than microscopic modelling for simple node representation whereas the latter may be better applied along links to appropriately reproduce vehicle interactions and drivers’ mutual influences).
In accordance with the literature, the approach was also introduced in order to deal with the lane changing problem in which microscopic modelling is suitable for realistic acceleration reproduction but cannot be applied for lane changes [33] therefore further investigations may found in Daganzo [34] and Laval and Daganzo [35]. They proposed a model based on a Kinematic Wave (KW; [36] model for traffic stream simulation and a micro model for the slower vehicles’ representation. Further studies may be also found in which obtained the same results by replacing the KW model with the CA and considering the same macroscopic parameters [37], in particular, the CA model provides the same trajectories of the KW model with triangular FD, confirming that the theory is insensitive to the level of approximation (i.e., discrete—continuum).
Leclercq [38] presented a hybrid ‘‘Lighthill–Whitham–Richards’’ (LWR) model combining both macroscopic and micro-scopic traffic descriptions. In particular, the main focus of the proposed model was to overcome the limitations of the models previously proposed [30, 39,40,41,42] mainly related to the physical extension of the interfaces between the microscopic and the macroscopic models.
The proposed hybrid model is based on the combination of the macroscopic cell transmission model (CTM; [36] and the microscopic cellular automata model (CA, [43]. The hybrid model (H-CA&CTM, [2]) appropriately reproduces the queue propagation phenomena and drivers’ behaviour in order to be applied in the presence not only of human-driven vehicles but also in the presence of connected and autonomous vehicles supporting the vehicles to infrastructure communication at node networks particularly in the case of traffic control. In particular the model specified, calibrated and validated in [44] has been also applied to the case of a signalized arterial in order to develop an iterative bilevel optimisation framework combining the traffic lights optimisation at the first level with the speed optimisation at the second (lower) level (i.e., the GLOSA; Green Light Optimized Speed Advisory).
It should be pointed out that the CA is a disaggregate model for basic microscopic traffic flow analysis, significantly reducing computational effort. As for the CTM, although the model considered is the basic application, several enhancements may be found in the literature. For instance, the CTM with dispersion (PD&CTM; [45, 46]) could be an affordable extension to be considered.
The rest of the paper is organised as follows: in Sect. 2 the models in question are outlined; in Sect. 3 the numerical results with reference to three applications are discussed, and in Sect. 4 conclusions and future perspectives are summarised.
2 Description of models
In this section the mathematical details of each macroscopic and microscopic model are discussed. In the former class, the cell transmission model [36] and the cell transmission model with dispersion (PD&CTM [45], are discussed, whilst in terms of microscopic models our analysis covers the Krauß model [19], the IDM [47] and the cellular automata [43].
2.1 Macroscopic models
2.1.1 Cell transmission model (CTM)
The cell transmission model was introduced to support the solution of the continuous time—continuous space LWR model and is based on a finite difference method: the time is divided into constant time intervals, while the road segment is divided into cells of constant length, with an index i increasing in the downstream direction. At each time step, every cell has single values of density and speed (as a function of the speed-density relationship) while the flow between neighbouring cells is constant during the time interval. The most common integration method for LWR models is the Godunov scheme [1]. This method is based on an exact solution of the continuity equation for one time step, assuming stepwise initial conditions given by the actual densities of the cells. The road is divided into cells of length Δx equal to the distance that a vehicle would travel in a free flow condition during one time step. Hence it is equal to the free flow speed multiplied by the duration of the time step (also called clock tick), \(V_{f} \Delta t = \Delta x\). The relation between the cell length and the time step complies with the Courant-Friedrichs-Lewy condition (\(V_{f} \Delta t \le \Delta x\)) for the stability of explicit solution methods.
Following the Godunov scheme, the densities are initially averaged for each cell (each cell has a constant density), and from one time step t, to a successive one, t + \(\Delta\) t, the solution evolution is averaged again in order to obtain a piecewise constant solution. The main variables of the method are:
-
\(k_{i} { }\) density in cell i;
-
\(k_{j}\) jam density;
-
\(Q_{i}\) maximum flow rate in cell i;
-
\(V_{f}\) free flow speed;
-
\(\omega\) shock wave speed in congested traffic;
-
\(\Delta x\) cell length;
-
\(\Delta t\) time step;
-
\(Y_{i}\) flow exiting the boundary of cell i.
-
The density is then obtained as a function of flows at the cell boundaries as in the following:
$$k_{i} \left( {t + 1} \right) = k_{i} \left( t \right) + \left[ {Y_{i - 1} \left( t \right) - Y_{i} \left( t \right)} \right] \cdot \frac{\Delta t}{{\Delta x}}$$(1)
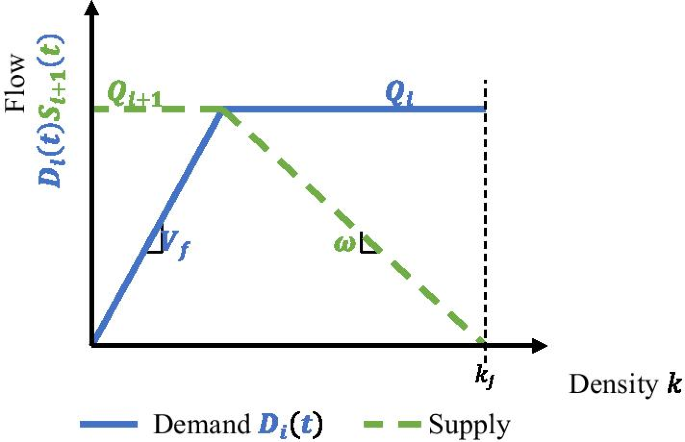
Finally, the key quantities of the method can be introduced based on the (trapezoidal) fundamental diagram (Fig. 1).
The flow of vehicles moving through the boundary between upstream cell i and downstream cell \(i + 1\) (see Fig. 1) is given by the result of a comparison between the maximum flow that can be sent (that is the demand) by cell i (upstream of the boundary):
and the maximum flow that can be received (that is the supply) by the downstream cell \(i + 1\):
Since every cell has a maximum density (\(k_{j}\)), the incoming flow is not only constrained by the maximum value \(Q_{i + 1}\), but also by the difference between the maximum density and the current density \(\left( {k_{j} - k_{i + 1} } \right)\), which captures the spillback phenomena and is able to model the effects of horizontal queuing.
Therefore, in accordance with the Godunov scheme, the flow \(Y_{i} \left( t \right)\) can be rewritten in accordance with the demand (sending)-supply (receiving) rule of the cell transmission model as:
2.1.2 CTM with dispersion (PD&CTM)
In the case of a signalised network, two main issues are to be addressed: (i) the modelling of the dispersion between inter-acting junctions, which is strictly related to the distance travelled on the connecting links and (ii) the spillback (i.e., the link blockage) and the merging and diverging modelling (i.e., the lane blockage). In general, the Platoon Dispersion Model (PDM; Robertson [48, 49]) which is adopted in several applications and benchmark tools TRANSYT [50] and SCOOT [51] is the most straightforward for modelling the dispersion of platoons. Moreover, this model shows a main weakness since it cannot describe the spillback phenomena and it does not model the effects of blocking back (i.e., horizontal queuing). Concerning the CTM, it may be adopted as an alternative to the PDM, for short distances whereas in the case of long distances the PDM is still preferred to the CTM. However, to overcome the limitations of PDM and CTM, the model proposed by Cantarella et al., [45] employing for each cell the well-known Drake speed-density relationship, can be considered.
First of all, some details about the platoon dispersion phenomenon should be supplied then the PD&CTM is specified. Let:
-
T be the mean link travel time;
-
t be equal to 0.8 T;
-
\(q_{d} \left( j \right)\), the flow rate over a time step Δt arriving at the downstream signal at time interval j;
-
\(q_{0} \left( i \right)\), the discharging flow over time step Δt observed at the upstream signal at time interval i;
-
Δt, the time step duration, usually assumed as one second;
-
F, the smoothing factor;
-
and \(\alpha {\text{and}} \beta\),the dimensionless model parameters.
Robertson’s model takes the following mathematical form:
where F, the smoothing factor, is given by:
Two main conditions may arise depending on the F values: (i) if the distance between two successive junctions is high, the travel time is high and F tends to zero; in this case uniform flow profiles are observed and the two successive junctions are not interacting; (ii) otherwise, when the distance between them is low they are interacting; suppose that the travel time tends to zero, the smoothing factor tends to 1 and then \(q_{d} \left( j \right) = q_{d} \left( {j - 1} \right)\).
The cell transmission model with dispersion was modified to include the Drake speed-density relationship, modelling the dispersion of the platoon formed upstream of a traffic light.
Let:
-
\(t\) be the time step
-
\(\Delta t\), the duration of the time step
-
\(\Delta x\), the length of the cells
-
\(Q_{i}\), the maximum flow rate in cell i
-
\(k_{i} \left( t \right)\), the density in cell i at time step t
-
\(k_{j}\), the jam density
-
\(k_{m}\), the traffic density at maximum flow
-
\(V_{f}\), the free flow speed and
-
\(\omega\), the shock wave speed in congested traffic.
For each cell, at each time step, the demand flow is given by:
The supply flow from the immediate downstream cell is given by:
The speed of the outgoing flow at each cell is given by the Drake speed-density relationship as:
The flow from each cell derived from the Drake speed-density relationship is given by:
The flow to the downstream cell is then calculated as:
To update the density at the next time step, for each cell i:
Since the flow to the downstream cell is limited by the supply and demand of each cell from the basic CTM, the resulting outcoming flow can be either equal to or lower than them, depending on the parameters of the Drake speed-density relationship.
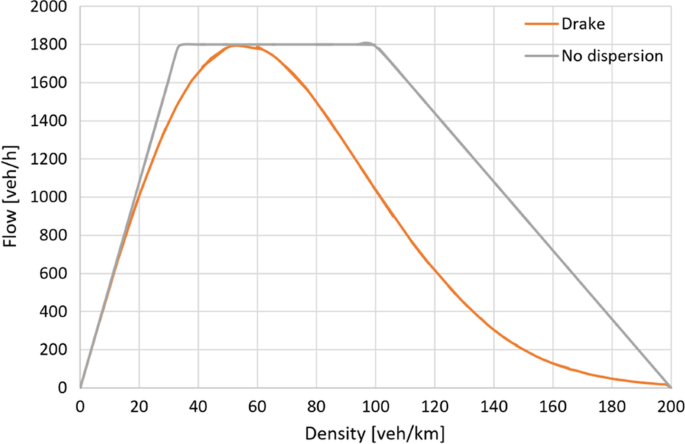
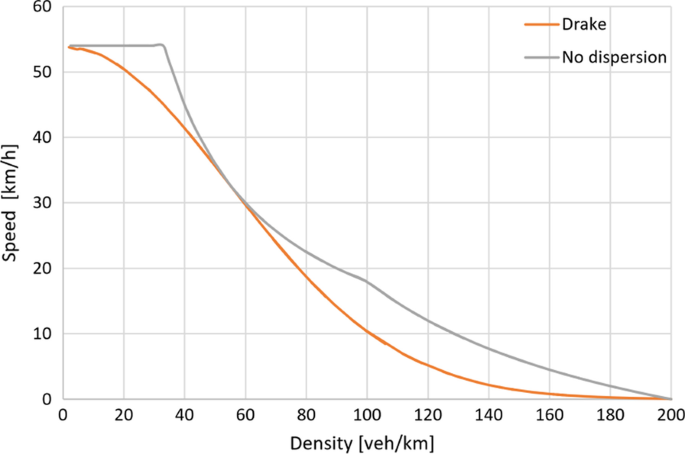
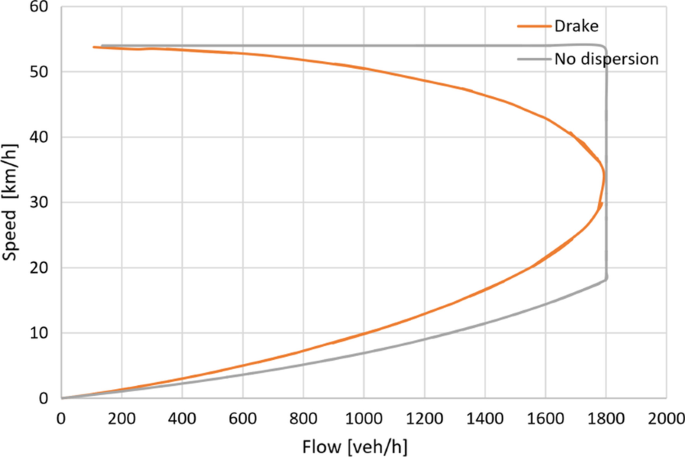
As an example, given the next set of parameters, the following fundamental diagrams (see Figs. 2, 3 and 4) are obtained:
-
\(\Delta x\) = 15 m
-
\(Q_{i}\) = 1800 veh/h
-
\(k_{j}\) = 200 veh/km
-
\(k_{m}\) = 55 veh/km
-
\(V_{f}\) = 15 m/s
-
\(\omega\) = 5 m/s
2.2 Microscopic models
2.2.1 Krauss’s model
Several classes of models may be identified at the microscopic level, amongst which are safety distance models. The definition of this distance is crucial in order to avoid collisions between vehicles, and these models are based on the idea that following vehicles try to respect the safety distance from the leading vehicles. The main contributions in the literature concern works by Kometani and Sasaki [52], Gipps [17] and Krauß [19]. The model proposed by Gipps is a multiregime model able to reproduce the free flow driving condition and the car following regime. The two main limitations of the Gipps model concern its unsuitability in the case of unstable traffic flow conditions and the possibility that the model has no solutions due to its analytical formulation. Therefore, the Krauß model, which can overcome such limitations, may be considered an alternative approach to that of Gipps. In accordance with the Krauß model, the safe speed is given by the following expression:
where, \(v_{l} \left( t \right)\) is the speed of the leading vehicle at time t, \(g\left( t \right)\) is the gap between leader and follower at time t, \(t_{r}\) is the drivers’ reaction time and, b is the max value of deceleration.
Finally, the desired speed is given as the minimum between the maximum speed, the speed that can be achieved by the vehicle according to its acceleration, and the safe speed as defined above. That is:
2.2.2 Intelligent driver model
Next are the continuous time models, based on first-order differential equations. The two main contributions in the literature concern the optimal velocity model (OVM) [20] and the intelligent driver model (IDM) [26].
In the above class of models, it is supposed that each vehicle has a desired speed depending on the distance between vehicles or the difference between the speed of a pair of vehicles, namely the leader and follower. The OVM refers to the former case, whereas the IDM to the latter.
With regard to the OVM, it must be highlighted that the acceleration of the vehicle depends on the desired speed and can be formulated as
where,
-
\(n\) is the following vehicle;
-
\(\Delta x_{n} \left( t \right)\) is the spacing between the leading and the following vehicle;
-
\(v_{n} \left( t \right)\) is the speed of the vehicle;
-
\(\tau\) is driver sensitivity.
However, one of the main limitations of the model concerns the unrealistic (high) values of maximum acceleration when the drivers’ sensitivity is of the same order as the drivers’ reaction time, which depends on the difference between the vehicles’ speeds [26] that is not considered. In general, in the IDM formulation, acceleration is a continuous function of speed, distance and speed difference.
In particular, let:
-
a0 be the maximum acceleration;
-
v0, the drivers’ desired speed;
-
δ, a parameter to be calibrated and
-
Δx0, the desired distance, a function of the follower’s speed and the speed difference.
The final formulation of acceleration is composed by two terms, the free flow term and the interaction term as detailed in the following:
2.2.3 CA—Nagel–Schreckenberg model
The approach adopted was proposed by Nagel and Schreckenberg [43] who developed a model which was discrete in time and space, considering a single lane road and dividing it into cells that can have two states (occupied or empty), and a length equal to the length of a vehicle. Every vehicle occupies a cell, which has an “occupied” state. At the next time step, if a vehicle moves to another downstream cell, its speed has integer value (ranging from zero to a maximum value) which represents the number of cells that the vehicle moves downstream, from position \(x_{i} \left( t \right)\) to \(x_{i} \left( {t + 1} \right)\). Because of this, the behaviour of an upstream vehicle i is influenced by a downstream one \(i + 1\), if the gap \(g_{i}\) between them is smaller than the speed \(v_{i}\) of the upstream vehicle. The speed can be converted to a dimensional value through multiplying it by both the ratio of the cell length and the time step. The acceleration is equal to 1 or 0, thus increasing, or otherwise, the integer value of the speed at each time step.
The model also contains a stochastic component called the dawdling probability in which, with probability p, a vehicle can remain at the same speed (if it was accelerating) or decelerate. This allows us to model stop-and-go waves in congested traffic, varying the flow-density relation as well.
The model is applied by following four rules. At each time step, and for each vehicle i on the road, their speed \(v_{i} \left( t \right)\) and position \(x_{i} \left( t \right)\) are updated as:
-
Slowing down. Obtain the gap at time t. If speed > gap, then slow down.
-
Acceleration. If speed < gap and speed < max speed, then accelerate by one.
$$v_{i}^{*} \left( {t + 1} \right) = \min \left( {v_{i} \left( t \right) + 1,v_{0} ,g_{i} } \right)$$(18) -
Randomization (Dawdling rule). If speed > 0, then with probability p (dawdling probability, that is the random term) reduce it by one.
$$v_{i} \left( {t + 1} \right) = \left\{ {\begin{array}{*{20}c} {\max \left( {v_{i}^{*} \left( {t + 1} \right) - 1} \right)} & {with\;probability\; p} \\ {v_{i}^{*} \left( {t + 1} \right)} & {otherwise} \\ \end{array} } \right.$$(19) -
Car motion. Update the position
$$x_{i} \left( {t + 1} \right) = x_{i} \left( t \right) + v_{i} \left( {t + 1} \right)$$(20)
The Nagel-Schreckenberg Model is not the only type of cellular automata. There are also other types, such as the Barlovic model [53] which adds a “slow to start” rule, the Kerner Klenov and Wolf model [54] which considers the cell length equal to 0.50 m (thus considering an acceleration of 0.5 m/s2) and adds other parameters to model synchronized traffic in accordance with the three-phase traffic theory proposed by Kerner, and the same model but changing the safe speed rule by using a discretized version of the safe speed of the Gipps model (considering a braking deceleration parameter). In this study, the basic model remains that of Nagel-Schreckenberg, but given that each cell has a length of 2.50 m, the randomization rule is applied only if the speed exceeds a minimum value greater than 0.
2.3 Hybrid traffic flow models
2.3.1 CA—CTM hybrid
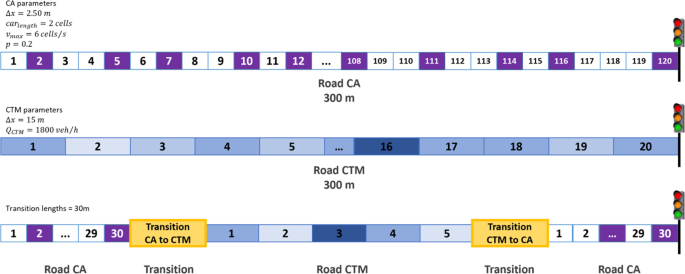
The general architecture of the proposed hybrid model consists of the combination of a macroscopic CTM with a microscopic CA for each link (see Fig. 5). The CA is used to model the traffic flow at disaggregate level at the junction, whereas the CTM models the traffic flow at aggregate level along the link. The transitions from CA to CTM and vice versa are based on the introduction of a transition zone. Both models have the same simulation time step of 1 s to obtain a consistent queuing formation and backend propagation of the congestion.
3 Numerical results
In this section the proposed hybrid traffic flow model and the benchmark macroscopic and microscopic models are compared. To this end, three main layouts were considered with reference to an urban context:
-
a link with a traffic signal (see Sect. 3.1);
-
an arterial consisting of three signalised junctions (see Sect. 3.2);
-
a nine-node grid layout with signalised junctions (see Sect. 3.4).
Before these analyses, the evaluation of the wave propagation is provided.
The details of the considered traffic flow models are displayed in the following Table 1. Furthermore, all results were analysed in terms of travel time spent, max and mean queues. In general, a simulation horizon equal to one hour has been considered and the first 900 s were considered as a “warm—up period” to stabilize the flow and speed of all vehicles. The proposed traffic flow model was implemented in a code provided by the authors and developed in MATLAB (the Release 2020 was adopted) whereas the microscopic and macroscopic traffic flow analyses were run respectively in SUMO [55] and TRANSYT16®TRL; all simulations were run on machine which has an Intel(R) Core(TM) i7-4510U CPU with a base speed of 2.6 GHz, and 8 GB of RAM.
3.1 Wave propagation analysis
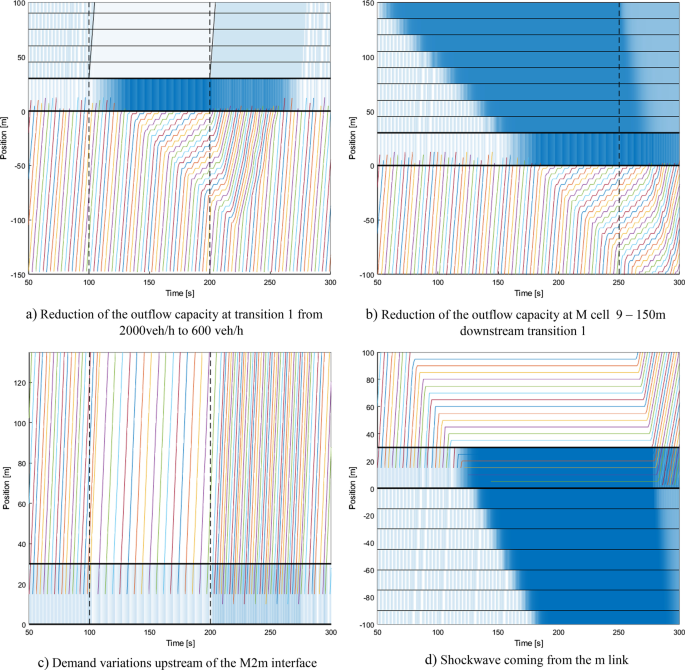
In this section an in-depth validation of how shockwaves propagation along a signalised link is provided and the consistency of the proposed model with the wave theory is carried out. Four applications are considered [38]:
-
a.
at the transition from microscopic [m] to macroscopic model [M]
-
1.
a capacity reduction is applied [from 2000 veh/h to 600 veh/h] at the macroscopic transition cell
-
2.
a shockwave is induced downstream, in the macroscopic model
-
1.
-
b.
at the transition from the macroscopic [M] to the microscopic model [m]
-
3.
a demand variation upstream is applied
-
4.
a shockwave is induced downstream, in the microscopic model
-
3.
Results are shown in Fig. 6. With reference to case a: the exit flow fits the supply variations as well as in the case c where the entry flow fits the demand variations. Furthermore, the shock waves propagations through the interface are uniform and the interface does not affect the wave in terms of interruptions, delay or any other kinds of modifications.
3.2 Link
This numerical application was run considering a link 300 m long with a signalised junction at the end. In terms of demand, to test the impact of the undersaturation and oversaturation conditions, three different entry flows were tested: the first was 400 veh/h, the second, 800 veh/h, and the third, 1200 veh/h. In Fig. 7 the layout in terms of the hybrid model is displayed, and the details of the cellular automata model and cell transmission model are shown.
Comparison among models highlights that in the case of low demand (undersaturation) all models provide very similar results. In particular, the proposed hybrid model CA&CTM is very similar to the other benchmark models with respect to both indicators of travel times and queues. However, in the case of higher demand (oversaturation), microscopic models show lower values travel times whilst the estimated values of the queues are higher than the values achieved with the other models. In particular, the proposed hybrid model behaves very similarly to the CTM and CA models. Further details regarding the numerical results are shown in Table 2 below.
3.3 Artery
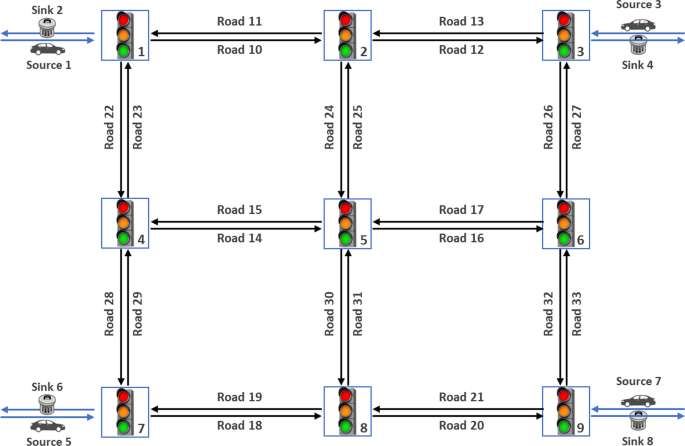
In this section the results concerning the artery with three successive signalised junctions (see Fig. 8) are considered. The entry flows in each node are displayed in the figure below. In particular, the distance between successive junctions is equal to 810 m, while the sources and sink arcs have 90 m. The parameters of the models are: free flow speed = 15 m/s, wave speed = 5 m/s, outflow capacity = 2000 veh/h, jam density = 200 veh/km, CTM cell length = 15 m, CA cell length = 2.50 m, dawdling probability = 0.266, min CA speed to apply dawdling = 2 cells/s = 5 m/s.
The results are summarised in Table 3. It may be observed that, unlike the previous case, the travel times of microscopic models are higher than those of other models, and the hybrid model provides very similar results to those of microscopic models, especially to the CA model in which travel times fall between those of the Krauß (travel time is 213,984.21 veh h) and IDM (travel time is 154,512.18 veh h).
However, as in the previous case, the estimated queues in case of microscopic models are lower with respect to them estimated with the other models, especially by the Krauß model and the IDM, whereas very similar values are shown by the other models (including the microscopic CA model).
3.4 Network
The third application concerns a network layout (see Fig. 9) in which all links have one lane in each direction and the saturation flow of each lane is assumed equal to 2000 PCU/h. Regarding link length, links connecting node 5 with other nodes (2–5, 4–5, 5–6, 5–8) are 405 m long (equal to 27 cells, each 15 m long in the CTM), the other links on the network are 810 m long (equal to 54 cells, each 15 m long in the CTM), and finally the links connecting the entry/exit nodes with the network (the connectors) are 90 m long. A scheme of the network layout is shown in Fig. 8 and the details of the entry-exit matrix are displayed in Table 4.
The network has signalised junctions at each node, while the solution for the optimisation control problem is based on the criterion of minimising total delay, considering green times and offsets as network decision variables. For this application, path choice modelling has an explicit (enumeration) approach (see [56].
Results are displayed in Table 5 below. It may be observed that, as in the previous case of the artery, the travel times are very similar to the case of microscopic models and generally to the CA model.
With regard to the number of vehicles in the queue, this value is still higher in the case of microscopic models with respect to the other models. However, the hybrid model provides very similar results to the case of the CA model (slightly lower due to the smoothing effect of the CTM).
3.5 Refinements’ overview
A final comparison of the models has been carried out in terms of computational effort with respect to the artery and the more complex layout of the network; results (see Table 6) point out that the even though CA&CTM model provides higher similar elapsed times than the CTM and the PD&CTM, the values are very similar to them of the CA.
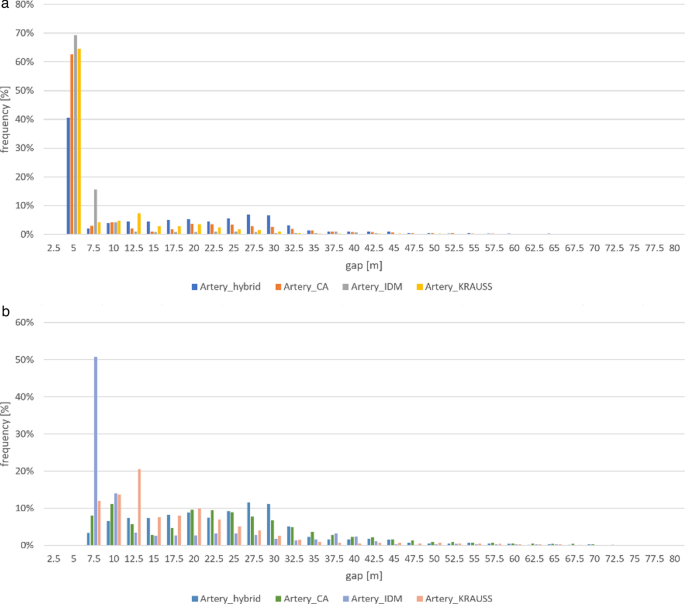
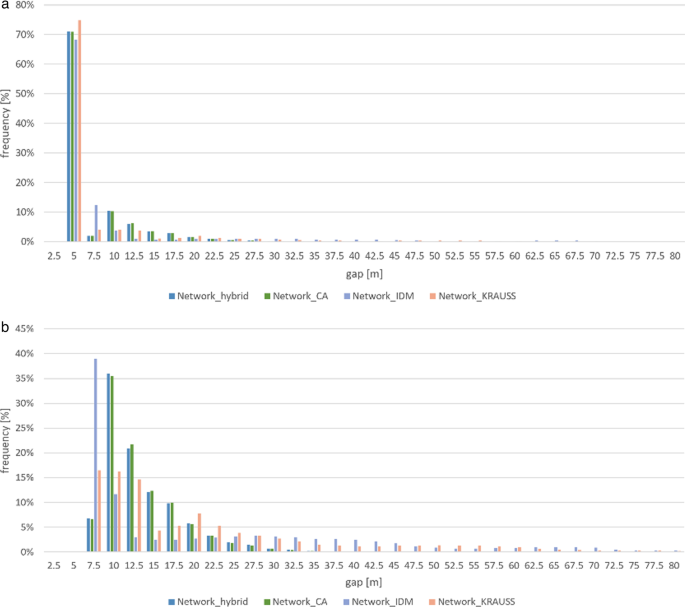
A further microscopic analysis has been carried out with reference to gaps evaluated for the artery and the network.
First of all, it may be observed that in the case of all vehicles analyses (see Fig. 10a and 11a) the frequency distributions of gaps are concentrate on the lower values whereas in the case of moving vehicles (see Fig. 10b and 11b) the frequency distributions of gaps are more dispersed over all higher values.
Furthermore, in the case of the artery the gap is distributed with a mean equal to 17 m and a standard deviation equal to 77.5 m whereas in the case of the network layout the gap mean is around 7.5 m and the standard deviation is around 65 m; this result may be justified considering the impact of the interaction between successive junctions within network. Finally, these analyses highlight a different behaviour of two the considered microscopic model, and in particular the deterministic IDM and the stochastic Krauss; the proposed hybrid model shows an intermediate behaviour.
4 Conclusions and future perspectives
This paper compared a proposed hybrid traffic flow model with the three main approaches generally used to describe traffic flow, namely macroscopic, microscopic and mesoscopic models. Macroscopic models are usually adopted for wide-area analysis whereas microscopic models are adopted for sub-area analysis, especially in the case of critical junctions; mesoscopic models may be indifferently adopted for both wide-area and sub-network analysis.
However, hybrid models based on combining two models at different scales are being increasingly used. For instance, wide areas may be directly analysed by combining macroscopic models with microscopic models or mesoscopic models with microscopic models. Furthermore, hybrid traffic flow modelling may also be suitable when the researcher is interested in representing links and nodes at different scales; in other words, microscopic link representation allows for consideration of driver behaviour, and macroscopic node representation avoids single manoeuvre analysis at junctions. Alternatively, specific analyses may require macroscopic link representation, in the case in which driver behaviour may be neglected, but microscopically represented nodes, when information about vehicles approaching signalised junctions is required. This may well be the case of mixed traffic flow analysis in which flow composition is based on human-driven vehicles and connected and autonomous vehicles, and the latter need to be sketchedFootnote 1 in order to collect all information required for traffic signal decision variables optimisation.
The main focus of the paper was on comparing the proposed hybrid traffic flow model (CA&CTM), based on combining a macroscopic cell transmission model (CTM; [9] for link representation and a microscopic cellular automaton (CA [43], node representation and some benchmark macroscopic and microscopic models. While the reliability of the CTM is amply studied in the literature mainly with reference to queue propagation, CA reliability requires further investigation.
In terms of the macroscopic approach, the model was compared with both the CTM and the CTM with dispersion (PD&CTM; [45]. Indeed, dispersion may not be directly observed in macroscopic modelling and a specific analytical representation must be included in the CTM. However, as dispersion is endogenously present in microscopic models, consistent traffic flow representation is expected with respect to the CA and especially the CA&CTM. With regard to the microscopic approach, the proposed model was compared with both the Krauß model [19] which is considered the stochastic enhancement of the Gipps model [17], the reference model in the context of the collision avoidance class of approaches, and with the intelligent driver model (IDM, Treiber and Helbing [47]) which is based on the idea of combining the ability to reach the desired speed limit in a traffic-free situation with the ability to identify how much braking is necessary to steer clear of any collision situations.
To this end three main applications were considered: (i) a link with a signalised junction required to introduce capacity constraints to traffic signal stages and suitable for the preliminary interpretation of queuing phenomena; (ii) an artery comprising three successive signalised junctions suitable for queuing and dispersion analysis; (iii) a more complex grid network with signalised junctions required to capture the impact of the interacting junctions. All signalised junctions were optimised with a pre-timed approach and according to the total delay minimisation criterion. All results were analysed in terms of travel time, max and mean queue.
In the first application, numerical results were analysed with reference to three different entry flow values to observe the different model behaviour in undersaturation and oversaturation conditions. Comparison shows that in the case of low demand all models provide very similar results. However, in the case of higher demand, microscopic models provide lower values of the travel times whereas the values of the queues are higher with respect to the other models. In general, the hybrid CA&CTM behaves very similarly to the CTM and CA models, with higher values of travel times and lower values of queues.
In the signalised artery, our results show that, unlike the link layout case, the travel times of the CA model lie between the values provided by the Krauß model and the IDM, while the Krauß model clearly show higher values of travel times. Queues of the microsocpic models, as in the previous case, are higher, whereas very similar values are shown by the other models (including the microscopic CA model).
Finally, the results of the network layout were analysed. In terms of travel times, the proposed CA&CTM model provided very similar results to those of microscopic models, especially to the CA which has an intermediate value between the Krauß model and the IDM. By contrast, in terms of queue modelling, it was again observed that the queues in microscopic models are clearly higher, while the proposed model behaved very similarly to the CA model.
More in general, it must be highlighted that it is well known that in the car-following approaches the inter driver heterogeneity may directly affect the models’ reliability in the reproduction of macroscopic characteristics [58].
Three main research fields are considered worthy of further exploration: the first task would be to investigate application of the proposed model to the context of connected and autonomous vehicles, also in the presence of human-driven vehicles; secondly, the proposed model could be profitably applied to a real case study; finally, the model will be further developed also in terms of multi—lanes simulation in order to properly apply some of the traffic management strategies.Footnote 2
Availability of data and materials
No field data has been used in the paper. Findings are grounded on simulation experiments.
Notes
Connected and automated vehicles must be further analysed. Concerning the connectivity two main types of communications have been incorporated into the vehicles technology: the vehicle-to-vehicle (V2V) and vehicle-to-infrastructure (V2I) communications; the first one collect information about single vehicle in terms of position, speed etc. whilst the V2I communication it is able to provide information about the traffic conditions (see [57]. Concerning the automation this may be defined in accordance with the U.S. Department of Transportation Releases and the last level of automation, full self-driving automation, refers to fully autonomous vehicles. A vehicle with this level of automation controls entire driving functions in any weather, road, and traffic condition and the V2V communication may be adopted to improve the autonomous vehicle (AV).
There are some specific fields of application, for instance the case of the combined strategies (traffic signals and speed optimization) in which the multi-lane traffic flow modelling may be particularly relevant.
References
Treiber, M., & Kesting, A. (2013). Traffic flow dynamics. Traffic Flow Dynamics: Data, Models and Simulation, Springer, Berlin. https://doi.org/10.1007/978-3-642-32460-4
Storani, F., Di Pace, R., & de Luca, S (2021) A hybrid traffic flow model for traffic management with human-driven and connected vehicles. Transportmetrica B: Transport Dynamics
Lighthill, M. J., & Whitham, G. B. (1955). On kinematic waves. II. A theory of traffic flow on long crowded roads. Paper presented at the Royal Society London. https://doi.org/10.1098/rspa.1955.0089
Richards, P. I. (1956). Shockwaves on the highway. Operations Research, 4, 42–51. https://doi.org/10.1287/opre.4.1.42
Payne, H.J. (1971) Mathematical models of public systems, edited by G.A. Bekey. Simulation Council, La Jolla, CA, Vol. 1, pp. 51–61.
Ross, P. (1988) Traffic dynamics. Transportation Research-B 22(6), 421–435. https://doi.org/10.1016/0191-2615(88)90023-9
Kerner, B. S., & Konhäuser, P. (1994). Structure and parameters of clusters in traffic flow. Physical Review E, 50(1), 54.
Helbing, D. (1996). Gas-kinetic derivation of Navier–Stokes-like traffic equations. Physical Review E, 53(3), 2366. https://doi.org/10.1103/PhysRevE.53.2366
Daganzo, C. F. (1994). The cell transmission model: A dynamic representation of highway traffic consistent with the hydrodynamic theory. Transportation Research Part B: Methodological, 28(4), 269–287. https://doi.org/10.1016/0191-2615(94)90002-7
Newell, G. F. (1993). A simplified theory of kinematic waves in highway traffic, part I: General theory. Transportation Research Part B: Methodological, 27(4), 281–287. https://doi.org/10.1016/0191-2615(93)90038-C
Yperman, I. (2007). The Link Transmission Model (Doctoral dissertation, PhD Thesis. Department of Transport and Infrastructure, Katholieke Universiteit Leuven). https://www.researchgate.net/publication/28360292_The_Link_Transmission_Model_for_dynamic_network_loading
Chandler, R. E., Herman, R., & Montroll, E. W. (1958). Traffic dynamics: Studies in car following. Operations Research, 6, 165–184. https://doi.org/10.1287/opre.6.2.165
Gazis, D. C., Herman, R., & Rothery, R. W. (1961). Nonlinear follow the leader models of traffic flow. Operations Research, 9, 545–567. https://doi.org/10.1287/opre.9.4.545
Ahmed, K. I. (1999). Modeling drivers’ acceleration and lane changing behavior. Ph.D. thesis. Massachusetts Institute of Technology. http://hdl.handle.net/1721.1/9662
Koutsopoulos, H. N., & Farah, H. (2012). Latent class model for car following behavior. Transportation Research Part B: Methodological, 46, 563–578. https://doi.org/10.1016/j.trb.2012.01.001
Lee, G. (1966). A generalization of linear car-following theory. Operations Research, 14, 595–606. https://doi.org/10.1287/opre.14.4.595
Gipps, P. G. (1981). A behavioural car-following model for computer simulation. Transportation Research-B, 15, 105–111. https://doi.org/10.1016/0191-2615(81)90037-0
Leutzbach, W. (1988). An introduction to the theory of traffic flow. Springer, Berlin. Retrieved from https://link.springer.com/content/pdf/https://doi.org/10.1007/978-3-642-61353-1.pdf
Krauß, S. (1998). Microscopic modeling of traffic flow: Investigation of collision free vehicle dynamics (Doctoral dissertation).
Bando, M., Hasebe, K., Nakayama, A., Shibata, A., & Sugiyama, Y. (1995). Dynamical model of traffic congestion and numerical simulation. Physical Review E, 51, 1035. https://doi.org/10.1103/PhysRevE.51.1035
Davis, L. (2003). Modifications of the optimal velocity traffic model to include delay due to driver reaction time. Physica A: Statistical Mechanics and its Applications, 319, 557–567. https://doi.org/10.1016/S0378-4371(02)01457-7
Gong, H., Liu, H., & Wang, B. H. (2008). An asymmetric full velocity difference car-following model. Physica A: Statistical Mechanics and its Applications, 387, 2595–2602. https://doi.org/10.1016/j.physa.2008.01.038
Helbing, D., & Tilch, B. (1998). Generalized force model of traffic dynamics. Physical Review E, 58, 133. https://doi.org/10.1103/PhysRevE.58.133
Jiang, R., Wu, Q., & Zhu, Z. (2001). Full velocity difference model for a car-following theory. Physical Review E, 64, 017101. https://doi.org/10.1103/PhysRevE.64.017101
Peng, G., & Sun, D. (2010). A dynamical model of car-following with the consideration of the multiple information of preceding cars. Physics Letters A, 374, 1694–1698. https://doi.org/10.1016/j.physleta.2010.02.020
Treiber, M., Hennecke, A., & Helbing, D. (2000). Congested traffic states in empirical observations and microscopic simulations. Physical Review E, 62, 1805. https://doi.org/10.1103/PhysRevE.62.1805
Michaels, R. M. (1963). Perceptual factors in car following In Proceedings of the second international symposium on the theory of road traffic flow. Paris: OECD, pp. 44–59.
Wiedemann, R. (1974) “Simulation des Strassenverkehrsflusses” Schriftenreihe des Institutes für Verkehrswesen der Universität Karlsruhe.
Burghout, W. (2004). Hybrid Microscopic-Mesoscopic Traffic Simulation. PhD diss., Royal Institute of Technology. Retrieved from http://urn.kb.se/resolve?urn=urn:nbn:se:kth:diva-72
Burghout, W., Koutsopoulos, H. N., & Andreasson, I. (2005). Hybrid mesoscopic–microscopic traffic simulation. Transportation Research Record, 1934(1), 218–225. https://doi.org/10.1177/0361198105193400123
Bourrel, E. (2003). Modélisation dynamique de l’écoulement du trafic routier: du macroscopique au microscopique. These de Doctorat, l’Institut National des Sciences Appliquées de Lyon, France. Retrieved from http://theses.insa-lyon.fr/publication/2003ISAL0073/these.pdf
Bourrel, E., & Henn, V. (2002). Mixing micro and macro representations of traffic flow: a first theoretical step. In Proceedings of the 9th meeting of the Euro Working Group on Transportation (pp. 610–616). Retrieved from http://www.iasi.cnr.it/ewgt/13conference/109_bourrel.pdf
Buisson, C., & Wagner, P. (2004). Calibration and validation of simulation models. Washington: 2004 TRB annual meeting Workshop.
Daganzo, C. F. (2006). In traffic flow, cellular automata= kinematic waves. Transportation Research Part B: Methodological, 40(5), 396–403.
Laval, J. A., & Daganzo, C. F. (2003). A hybrid model of traffic flow: Impacts of roadway geometry on capacity. TRB 2003 Annual Meeting CD-ROM. Retrieved from http://trafficlab.ce.gatech.edu/sites/default/files/docs/MLHM%20paper.html
Daganzo, C. F. (1995). A finite difference approximation of the kinematic wave model of traffic flow. Transportation Research Part B: Methodological, 29(4), 261–276. https://doi.org/10.1016/0191-2615(95)00004-W
Daganzo, C. F. (2006). In traffic flow, cellular automata = kinematic waves. Transportation Research Part B: Methodological, 40(5), 396–403. https://doi.org/10.1016/j.trb.2005.05.004
Leclercq, L. (2007). Hybrid approaches to the solutions of the “Lighthill–Whitham–Richards” model. Transportation Research Part B: Methodological, 41(7), 701–709. https://doi.org/10.1016/j.trb.2006.11.004
Bourrel, E., & Lesort, J. B. (2003). Mixing micro and macro representation of traffic flow: A hybrid model based on the lwr theory. Transportation Research Record, 1852, 193–200. https://doi.org/10.3141/1852-24
Hennecke, A., Treiber, M., Helbing, D. (2000). Macroscopic simulation of open systems and micro–macro link. In Helbing, D., Herrman, H. J., Shcrechenberg, M., Wolf, D. E. (Eds.), Proceedings of the traffic and granular flow conference, pp. 383–388.708L. Leclercq / Transportation Research Part B 41 (2007) 701–709. https://doi.org/10.1007/978-3-642-59751-0_38
Magne, L., Rabut, S., Gabard, J. F. (2002). Towards a hybrid macro micro traffic flow simulation model. In INFORMS Spring 2000Meeting
Poshinger, A., Kates, R., Keller, H. (2002). Coupling of concurrent macroscopic and microscopic traffic flow models using hybrid stochastic and deterministic disaggregation. In Taylor, M. A. P. (Ed.), Proceedings of the 15th ISTTT, pp. 583–605. https://doi.org/10.1108/9780585474601-029
Nagel, K., & Schreckenberg, M. (1992). A cellular automaton model for freeway traffic. Journal de Physique I, 2(12), 2221–2229. https://doi.org/10.1051/jp1:1992277
Storani, F, Di Pace, R., & De Schutter, B (2021) A traffic responsive control framework for signalised junctions based on hybrid traffic flow representation. Journal of Intelligent Transportation Systems
Cantarella, G. E., de Luca, S., Di Pace, R., & Memoli, S. (2015). Network signal setting design: Meta-heuristic optimisation methods. Transportation Research Part C, 55, 24–45. https://doi.org/10.1016/j.trc.2015.03.032
Di Pace, R. (2020). A traffic control framework for urban networks based on within-day dynamic traffic flow models. Transportmetrica A: Transport Science, 16(2), 234–269. ISSN: 2324–9943.
Treiber, M., Helbing, D., (2002). Realistische mikrosimulation von straenverkehr mit einem einfachen modell. In Symposium ”Simulationstechnik ASIM. Retrieved from https://mtreiber.de/publications/MOBIL_ASIM.pdf
Robertson, D. (1986a). Research on the transyt and scoot methods of signal coordination. ITE Journal-institute of Transportation Engineers, 56(1), 36–40. Retrieved from http://citeseerx.ist.psu.edu/viewdoc/download?doi=10.1.1.417.7154&rep=rep1&type=pdf
Robertson, D. I. (1969). TRANSYT: a traffic network study tool.
Robertson, D. I. (1969b). TRANSYT: a traffic network study tool. Tech. rep. TRRL-LR-253, Transport and Road Research Laboratory.
Hunt, P. B., Robertson, D. I., Bretherton, R. D., Winton, R. I. (1981). SCOOT-a traffic responsive method of coordinating signals (No. LR 1014 Monograph).
Kometani, E. I. J. I., & Sasaki, T. S. U. N. A. (1958). On the stability of traffic flow (report-I). Journal of the Operations Research Society of Japan, 2(1), 11–26. Retrieved from https://www.orsj.or.jp/~archive/pdf/e_mag/Vol.02_01_011.pdf
Barlovic, R., Santen, L., Schadschneider, A., & Schreckenberg, M. (1998). Metastable states in cellular automata for traffic flow. The European Physical Journal B-Condensed Matter and Complex Systems, 5(3), 793–800. https://doi.org/10.1007/s100510050504
Kerner, B. S., Klenov, S. L., & Wolf, D. E. (2002). Cellular automata approach to three-phase traffic theory. Journal of Physics A: Mathematical and General, 35(47), 9971. https://doi.org/10.1088/0305-4470/35/47/303
Alvarez Lopez, P. Behrisch, M, Bieker-Walz, L, Erdmann, J, Flötteröd,Y-P, Hilbrich, R. Lücken, L. Rummel, J. Wagner, P., Wießner, E. (2018). Microscopic Traffic Simulation using SUMO. In IEEE Intelligent Transportation Systems Conference (ITSC), 2018. https://doi.org/10.1109/ITSC.2018.8569938
Cascetta E. (2009). Transportation systems analysis: Models and applications. Springer, pp. 448–477
Talebpour, A., & Mahmassani, H. S. (2016). Influence of connected and autonomous vehicles on traffic flow stability and throughput. Transportation Research Part C: Emerging Technologies, 71, 143–163. https://doi.org/10.1016/j.trc.2016.07.007
Punzo, V., & Montanino, M. (2020). A two-level probabilistic approach for validation of stochastic traffic simulations: Impact of drivers’ heterogeneity models. Transportation Research Part C: Emerging Technologies, 121, 102843. https://doi.org/10.1016/j.trc.2020.102843
Acknowledgements
The author also wishes to thank anonymous reviewers for their helpful comments.
Funding
This research has been partially supported by the University of Salerno, under PhD program on transportation (Ph.D. School in Environmental Engineering), local grant n. ORSA180377- 2018, local grant n. ORSA191831-2019, CA18232 - Mathematical models for interacting dynamics on networks and under the Italian program POIN AIM and under the Italian program PON AIM – Attraction and International Mobility, Linea 1 (AIM1877579-3-CUP-D44I18000220006).
Author information
Authors and Affiliations
Contributions
Facundo Storani: model formulation, model implementation and writing the paper. Roberta Di Pace: model formulation, model implementation and writing the paper. Francesca Bruno: model formulation and writing the paper. Chiara Fiori: model formulation and writing the paper. All authors read and approved the final manuscript.
Corresponding author
Ethics declarations
Ethics approval and consent to participate
Not required; considered data are related not to a collected survey but to simulated data.
Consent for publication
Not required; considered data are related not to a collected survey but to simulated data.
Competing interests
The authors declare that they have no competing interests.
Additional information
Publisher's Note
Springer Nature remains neutral with regard to jurisdictional claims in published maps and institutional affiliations.
Rights and permissions
Open Access This article is licensed under a Creative Commons Attribution 4.0 International License, which permits use, sharing, adaptation, distribution and reproduction in any medium or format, as long as you give appropriate credit to the original author(s) and the source, provide a link to the Creative Commons licence, and indicate if changes were made. The images or other third party material in this article are included in the article's Creative Commons licence, unless indicated otherwise in a credit line to the material. If material is not included in the article's Creative Commons licence and your intended use is not permitted by statutory regulation or exceeds the permitted use, you will need to obtain permission directly from the copyright holder. To view a copy of this licence, visit http://creativecommons.org/licenses/by/4.0/.
About this article
Cite this article
Storani, F., Di Pace, R., Bruno, F. et al. Analysis and comparison of traffic flow models: a new hybrid traffic flow model vs benchmark models. Eur. Transp. Res. Rev. 13, 58 (2021). https://doi.org/10.1186/s12544-021-00515-0
Received:
Accepted:
Published:
DOI: https://doi.org/10.1186/s12544-021-00515-0
