- Research
- Open access
- Published:
Enhancing response time thresholds with response behaviors for detecting disengaged examinees
Large-scale Assessments in Education volume 8, Article number: 5 (2020)
Abstract
The item responses of examinees who rapid-guess, who do not spend enough time reading and engaging with an item, will not reflect their true ability on that item. Rapid-disengagement refers to rapidly selecting a response to multiple-choice items (i.e., rapid-guess), omitting items, or providing short-unrelated answers to open-ended items in an unreasonably short time. Such rapid responses need to be identified to enhance the validity of the arguments from the test data. Detection of rapid-guessing behaviors is typically based on identifying a threshold to represent the minimum response time required for the student to have thoughtfully considered a given item. This study investigates whether using response behaviors can improve the detection of rapid-disengagement by investigating two approaches: (a) using response behaviors to decide on the size of the threshold, and (b) using response behaviors as a condition for detecting disengaged examinees in addition to response times, referred as enhanced methods. Process data and item responses from the PISA 2012 computer-based mathematics assessment were used to examine both approaches under threshold values varying from very small (5 s) to very large (60 s). Results suggested that response behaviors can provide meaningful input on establishing the size of the threshold and that while enhanced methods performed better than using only response times in recognizing rapid-disengagement in some cases, no clear pattern was observed as to when such improvement occurs. This study makes a unique contribution by inspecting the response behaviors of disengaged examinees and providing guidelines on using response behaviors to decide on the size of the threshold. This study suggests response behavior categories that can be applicable to many item and response types, which make them suitable for use in digitally-based large-scale assessments.
When disengaged examinees spend too little time reading and considering the content of an item but still respond to the item, rapid-guessing, their responses may not be representative of their ability. Rapid-guessing has been found to distort item parameters and the estimation of examinees’ performance on cognitive tests (Schnipke and Scrams 1997; Wise 2015; Wise and DeMars 2006; Wise and Kingsbury 2016) and can distort the validity of the inferences made based on scores. Therefore, detecting rapid-guessing is valuable for ensuring the quality of the test scores and improving the validity of the inferences based on those test scores.
Existing methods for identifying rapid-guessing are typically based on response time and require identifying a threshold to represent the minimum response time required for an examinee to provide a considered response to an item. Wise (2017) indicated two concerns in identifying rapid-guessing: (a) fast, effortful responses might be misclassified as non-effortful rapid guesses thus penalizing fast-thinking test-takers, and (b) some slower non-effortful responses may go undetected. In this paper, we suggest that these two potential misclassifications are related to the threshold selected: the threshold can either be too large or too small. If the threshold is too large, the potential error is identifying examinees as displaying rapid-guessing behaviors who actually were engaged but had short response times because they were fast test-takers. On the other hand, a threshold that is too small can result in not detecting examinees who were rapid-guessing, because their response times were just above the threshold.
Response behaviors, such as clicking a response option, manipulating with an interactive item stimulus, can provide valuable input about how examinees spend their time on the item. Response behaviors can potentially differentiate engaged and disengaged examinees, and thereby improve the detection of rapid-guessing. Moreover, response behaviors can help differentiate different kinds of disengaged behaviors, such as not interacting with the items at all and thus omitting the items rapidly and providing quick unrelated keypresses, two behaviors termed rapid omit and rapid perfunctory answer, respectively (Wise and Gao 2017). One benefit of differentiating rapid guessing from rapid omitting and rapid perfunctory answer is apparent when different item types were examined. While examinees can rapidly guess multiple choice items, or other types of closed-ended items (e.g., selecting from a drop-down menu), such ‘guessing’ is not possible in open-ended items.
In this study, the term “rapid-disengaged” is used to include rapid-guessing, rapid omitting, and rapid perfunctory answers to the items. A rapid-disengaged examinee spends less time than reasonably required to fully consider an item and either (a) omits the response, (b) provides unrelated keypresses as the response, or (c) chooses a response in an unreasonably short time. The literature lacks any study inspecting response behaviors of disengaged examinees. In this study, in addition to inspecting examinees’ response behaviors, we suggest methods that use response behaviors to differentiate between disengaged behaviors as well as detecting all of them with the same procedure: rapid-disengaged categorization.
Purpose
The overall purpose of this study is to detect rapid-disengaged (i.e., rapid-guessing, rapid-omitting, and providing rapid unrelated keypresses) examinees more accurately with the help of response behaviors with the intention of mistakenly detecting fewer examinees who can be fast, effortful test-takers and detecting more examinees who can be relatively slow but providing non-effortful responses. In this study, we took two approaches to demonstrate the utility of response behaviors for this purpose: (a) using response behaviors to decide on the size of the threshold, and (b) using response behaviors as a condition for detecting rapid-disengaged examinees in addition to response times, referred to as enhanced methods. More specifically, for the first approach we considered response behaviors of examinees who would be classified as rapid-disengaged under various response time thresholds. We also suggested guidelines for how response behaviors can help determine threshold size based on our analyses. For the second approach, we compared the enhanced methods (i.e., using both response time thresholds and response behaviors) and existing methods, which detect rapid-disengaged examinees based only on thresholds, referred to as response time-only (RT-only) methods.
The response times and response behaviors are extracted from process data (or log data), which consist of examinees’ clicks and keystrokes collected in the background as examinees interact with the digitally based assessment screen. Response time is operationalized as the total time spent on an item and calculated by taking the difference between the time examinees start seeing an item and end seeing that item. Response behaviors are defined as all the actions an examinee performed within the response time. Response behaviors provide more detailed information about examinees’ test-taking experiences than just their responses (e.g., such as selecting response option “A”) and response times (e.g., spending 15 s on an item) times. However, researchers typically analyze the response time and give little attention to examinees’ response behaviors when examining rapid-disengagement.
Literature
The existing methods reported in the literature studied rapid-disengagement only in the context of rapid-guessing (i.e., examinees who respond rapidly). Therefore, the term rapid-guessing is used in the literature review.
Setting a threshold for detecting rapid-guessing
The first step for identifying examinees displaying rapid-guessing is defining a threshold value representing the minimum time for effortful response behavior. If the response time is at or below the threshold, the examinee is considered to display rapid-guessing behavior; if above, solution behavior. Kong et al. (2007) compared the effectiveness of thresholds established in different ways: (a) visually inspecting the response time distribution (the visual method), (b) establishing a common threshold for all items (the common method), (c) calculating reading time (the reading time method), and (d) statistically estimating a two-state mixture model (the two-state mixture method). Two other methods have also been suggested: (e) calculating the percentage of the average item response time (the normative method); and (f) inspecting both response time and response accuracy distributions (response time and response accuracy method).
- a.
The visual method. The visual method suggests setting the threshold at the end of an early spike in the response time distribution. An example using visual inspection is shown in Fig. 1.
Fig. 1 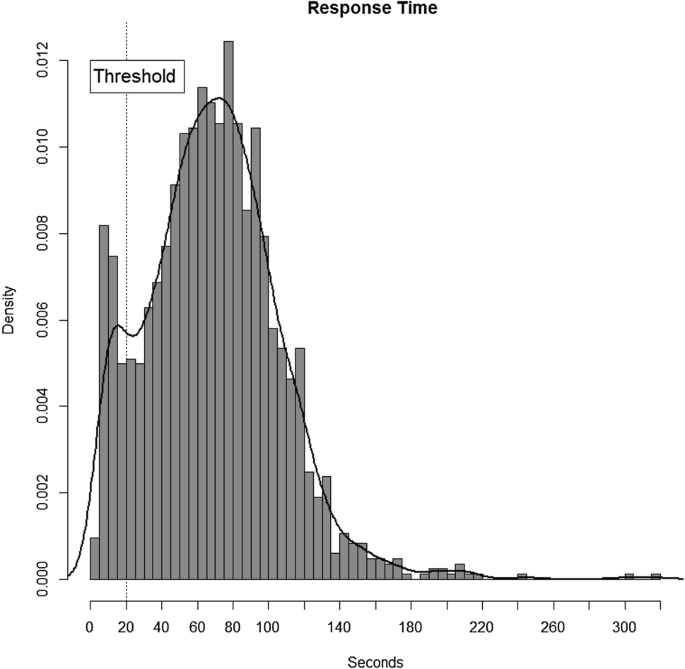
Analyzing examinee effort from examinee response times. Figure is based on the concept from Kong et al. (2007)
- b.
The common method. Unlike other methods, this method requires defining a fixed value for the threshold for all the items under investigation. Kong et al. (2007) used three seconds as the common threshold value to represent a reasonably short time given the content area measured and the amount of reading/scanning that the items required.
- c.
The reading time method. This method is based on identifying the necessary time for reading the items and taking that as the threshold value. Kong et al. (2007) used item surface features, such as number of characters and whether ancillary reading was provided for the first time, to estimate reading time.
- d.
Two state mixture model. Bayesian methods are used to generate a threshold for each item. Assuming that the response time distributions are bimodal, the mixture model discovers two clusters of response times—one representing response time under rapid-guessing and another representing solution behavior (Schnipke and Scrams 1997).
- e.
Normative method. A percentage of the average response times of all examinees is used. Wise and Ma (2012) found that taking 10% of the average response times, with a maximum of 10 s, gave the most accurate estimations of rapid-guessing.
- f.
Response time and accuracy method. This method requires calculating the proportion of correct responses, for each item, accumulated to time t (Guo et al. 2016, see also Lee and Jia 2012). The cumulative proportion of correct responses to an item until time t is assumed to converge to the random chance level of 0.25. Then, the threshold is set at the right end of the time t.

A possible concern with any of these methods to establish thresholds is that they were developed before innovative items were commonly used, such as items with interactive, dynamic visuals or response types. Innovative items may have different time requirements and scoring rules than traditional items. As such, threshold sizes for traditional items may differ than those for innovative items. For example, Goldhammer et al. (2016, 2017) reported finding thresholds that ranged between 3 and 76 s for the Programme for the International Assessment of Adult Competencies (PIAAC) problem solving items. Therefore, researchers may face difficulties in applying these methods to innovative item types or items that have innovative features.
Evaluating thresholds
Evaluating the size of the thresholds is done by determining whether the examinees who were identified as displaying rapid-guessing performed as expected. Based on anticipated outcomes of rapid-guessing, Wise and Kong (2005) developed five criteria for evaluation of the various possible methods: (a) an effort index, known as response time effort (RTE), should be consistent across items in a test, (b) RTE should be correlated with other measures of test-taking effort, (c) RTE should not be correlated with academic ability, (d) the percentage of correct scores under rapid-guessing should be consistent with chance, and (e) applying a procedure known as motivation filtering—which is removing examinees who were classified as rapid-guessers—and comparing mean score of items before and after motivation filtering (Sundre and Wise 2003) should increase test scores.
Among these five criteria, two are commonly used in practice, examining the percentage of correct scores under rapid-guessing and motivation filtering. One reason for their popularity is that other criteria based on correlations between RTE and test scores have varied from study to study. While Lee and Jia (2014) reported a non-significant correlation (.24) between 8th grade students’ effortful behavior in a mathematics test and their scores, Kong et al. (2007) reported relatively high correlations (.74 and .77) between effortful behavior and test scores of university students on an information literacy test. Such discrepancies may be attributable to: (a) the low proportion of examinees identified with rapid-guessing behaviors, (b) item difficulty, and (c) variability in the effectiveness of the methods for detecting rapid-guessing across the content areas being tested, tests, and populations.
As for evaluating the thresholds using percentage of correct scores, examinees were expected to provide fewer accurate responses under rapid-guessing than under effortful problem solving. In fact, earlier studies consistently found the proportion of correct scores under solution behavior to be substantially higher than the proportion under rapid-guessing (Lee and Jia 2014; Silm et al. 2013; Wise and Kong 2005). Wise and Kong (2005) and Wise (2006) found that examinees who responded in an unreasonably short amount of time provided correct responses at a frequency similar to the frequency of yielding a correct response by random chance, where random chance was operationalized as the reciprocal of the number of response options (e.g., one out of four, or .25 for a multiple-choice item with four response options).
However, using random chance as a point of reference for determining the correct response rate under rapid-guessing has been challenged. Wise and Ma (2012) found that rapid guesses were correct at a rate above that expected purely by chance. In a recent article, Wise (2017) argues that the accuracy of responses associated with rapid-guessing deviates considerably from the value associated with random chance. Even more rigorous calculations, such as estimating the pseudo-guessing parameter (c parameter) with a 3PL IRT model, are known to have technical challenges for it to yield stable estimations of the probability of a correct response by chance (Han 2012). Therefore, setting a minimum chance level for accurate responses under rapid-guessing is likely not the correct approach.
Despite its popularity, the effectiveness of using motivation filtering has been questioned in recent research. Motivation filtering relies heavily on the foundational assumption that examinees’ engagement (or disengagement) and their ability are not related. However, Rios et al. (2017) found that the average scores were highly related to the percentage of rapid-guessing examinees and the difficulty of the items that they responded disengaged. No practical difference in aggregate scores was observed when only 10% of the examinees were disengaged. However, the differences were inflated when this percentage rose to 20%.
Response behaviors
The exploration of response behaviors is an emerging area that has untapped potential in the identification of rapid-disengagement in testing. Previously, Harmes and Wise (2016) examined the expected response behaviors to describe the behaviors of the engaged examinees. However, not much has been done to explore individual response behaviors of disengaged examinees. Inspecting the response behaviors of the examinees identified with rapid-disengagement should provide insight into the suitability of a given threshold. In this paper, we suggest calculating the following two indicators from process data regarding response behaviors: the number of response behaviors and the overall type of response behaviors (e.g., keypresses, clicks, clicking interactive stimulus, running a simulation). These two indicators can be used to describe what the examinees perform during the time they spent on an item.
As examinees interact with an item, the number of behaviors they perform increases. The number of response behaviors can inform how active examinees were during the time they spent on an item. Therefore, we suggest that the number of response actions can be a useful variable for investigating examinee disengagement as it has the potential to distinguish engaged and disengaged examinees. The number of response behaviors of those examinees identified as displaying rapid-disengagement is informative, yet generic, information that can be used for evaluating thresholds set for items with various response types or difficulty. Similar arguments can be made for the type of response behaviors. Because different item types or even different items themselves may require examinees to perform different response behaviors, finding a practical indicator of the types of response behaviors that can be used across various items can be challenging. This study suggests generic response types to inform suitability of a threshold for rapid-guessing that are applicable to most, if not all, item types. For each item, examinees behaviors were categorized as clicks, keystrokes, and—if available—and interacting with an interactive feature is counted. Examinees who move to another item without providing a response or interacting with the item are considered as having omitted that item.
It should be noted that the number and type of response behaviors examinees perform depend on the response time. A typical engaged examinee is assumed to spend the time working towards a response by interacting with various item features or providing the response, and therefore produce a higher number of response behaviors and more diverse types of response behaviors than a disengaged examinee. A disengaged examinee, on the other hand, would be likely to complete an item in a short amount of time and may not produce any response behaviors or, at best, provide a minimal number and less diverse types of response behaviors—all in a very short period of time. Such examinees should not be confused with the efficient examinees who may produce a sufficient number and type of response behaviors for solving an item, also in a short amount of time. While the number and type of response behaviors can differentiate engaged from disengaged examinees, they can also help in setting a threshold. For example, when a very small threshold is selected, it is possible that even the engaged examinees would not have had enough opportunity to provide a full response or interact with the features of an item. By contrast, if a large threshold is selected, supposedly disengaged examinees could have the opportunity to interact with various item features and produce a sufficient or more than a sufficient number of response behaviors.
Enhanced method of detecting rapid-disengagement
Disengaged examinees typically perform either no action (i.e., omit) or only the minimal actions that are necessary to answer an item (e.g., quickly clicking a response option.) The purpose of this study is to examine the utility of response behaviors by comparing the identification of rapid-disengagement using only response times, response time-only (RT-only) methods, with enhanced methods, in which response behaviors are considered in addition to response times under varying thresholds. Therefore, enhanced methods flag examinees as displaying rapid-disengagement based on their short response time, as well as on the number of behaviors provided under the threshold time.
Research questions
Consistent with the purpose of detecting examinees providing non-effortful responses more accurately using response behaviors, two approaches were taken: (a) demonstrating the benefit of response behaviors in deciding the size of the threshold and (b) using response behaviors as a condition in addition to response times for detecting rapid-disengaged examinees. Three research questions were examined to investigate how much these two approaches served to the study goal:
- 1.
What is the number of response behaviors rapid-disengaged examinees perform under varying thresholds when identified by the RT-only methods?
- 2.
What are the types of response behaviors rapid-disengaged examinees perform under varying thresholds when identified by the RT-only methods?
- 3.
How do enhanced methods compare with RT-only methods on percentage of correct scores under various thresholds?
Results from research questions 1 and 2 can inform the first approach in demonstrating the utility of response behaviors: deciding the size of the threshold by observing the patterns in the number and type of response behaviors performed by examinees identified as displaying rapid-disengaged as the size of the threshold increases. Results from research question 3 can inform about the second approach: demonstrating the utility of response behaviors by using response behaviors as a condition for detecting examinees as displaying rapid-disengagement. This can be accomplished by observing the differences on percentage of correct scores between enhanced and RT-only methods as the size of the threshold increases. For evaluation of the results from research question 3, it was anticipated that smaller values in the percentage of correct scores for examinees identified as displaying rapid-disengagement indicated better identification rapid-disengagement.
The specific thresholds used in this study are: 5 s (as suggested by research using the common method), 10 s (as the maximum suggested by the normative method), and from 20 to 60 s in 10 s increments (to represent larger thresholds for innovative items).
Method
Data
Responses from Australian students taking the 2012 mathematics cycle of the Programme for International Student Assessment (PISA) were used in this study.Footnote 1 The decision to use data from Australia was based on the desire to use data from one country and to use items that were given in English, which helped avoiding cross-country issues—such as differences in reading times—and removing language as a variable. In addition, Australia participated in both the optional computer-based assessment of mathematics and the survey about information and communication technologies (ICT). Given all these considerations, Australia had the largest number of qualifying participants (N = 14 441). Because the process data were released for only some of the computer-based mathematics items, the sample consists of only the 1951 students who were administered these released items. After excluding the students who had an invalid score (e.g., not reached)Footnote 2 or process data entry (e.g., events that were recorded as invalid in the process data file) for any of the released mathematics items, 1518 students remained for the analyses. The remaining 1518 students were comparableFootnote 3 to the qualifying Australian students.
Sample
The released questions used in this study were administered along with an interactive visual display belonging to one of two scenarios: CD production, and star points. CD production questions were algebra-based questions about change and relationships, star points were geometry-based (see Appendix A, for example items for each scenario). Of the seven items used in the study three were selected-choice and four were constructed-response.
Number and type of response behaviors
Each action an examinee produces is recorded in the process data. The number of behaviors and type of behaviors were calculated for each examinee on each item. The number of behaviors was calculated as the total number of behaviors an examinee performed for a given item. If an examinee did not interact with the item, the number of action for such an examinee for that item would be zero. If the examinee interacted with the interactive features and/or provided a response to the item, then each keypress or click would be counted, which would result in a number of response behaviors greater than zero. This number depended on how many interactions the examinee performed.
The type of response behaviors was calculated by categorizing the response behaviors into different categories. Each response action was classified into one of three categories: (a) clicks: clicking a response option, or other static parts of the assessment such as the image, or a text (b) keypresses, which represent the keypresses examinees made to enter responses to open-ended questions where more keypresses are recorded for longer responses, (c) interactive: actions that represent interacting with the dynamic part of the items to perform things such as manipulating variables, trying out potential solutions before entering a response, or drawing a shape.
Analysis
The analyses consist of setting thresholds and detecting examinees displaying rapid-disengagement versus displaying solution behavior (or engaged examinees) using both response time-only (RT-only) and the enhanced methods. Furthermore, the response behaviors of examinees detected as rapid-disengagedFootnote 4 were described using the number and type of response behaviors; and comparisons were made between RT-only and enhanced methods based on percentage of correct scores.
Setting thresholds
The thresholds used in this study ranged from 5 to 60 s. The lowest threshold, 5 s, were set by using the common threshold method. Because the stimulus of every item has a visual display with details and an interactive item component, 5 s was considered more suitable than the 3 s Kong et al. used to represent a minimum time to glimpse the items. The second lowest threshold, 10 s, was given based on the normative method suggested by Wise and Ma (2012). Accordingly, 10% of the average response time for each item was calculated, and if this value exceeded 10 s, then 10 s was used as the threshold. Because for most of the items, this value exceeded 10 s, 10 s were used as one of the thresholds in this study. The other thresholds: 20, 30, 40, 50, and 60 were set as hypothetical thresholds for observing the changes as the thresholds increased. The largest threshold, 60 s, was chosen to mimic the time to read and understand an item with innovative features introducing a scenario for a slow reader. As all of the items in this study included a visual and a scenario and some items included an innovative response type such as drawing a tool, 60 s was considered as the minimum time for a slow reader to read and understand the scenario of an item as well as how to respond to it.
Detecting rapid-disengagement
Based on RT-only methods, examinees were classified as displaying rapid-disengagement if their response time was less than or equal to the thresholds set for each of the methods described above. For implementing the enhanced methods, response behaviors were incorporated into the RT-only methods by imposing a maximum number of response behaviors that represent no or minimum engagement in addition to responding in less time or equal to the threshold time. The maximum number of behaviors was set to one. Accordingly, for the enhanced method examinees whose response time was less than or equal to the threshold time and who performed at most one action were flagged as rapid-disengaged. For example, an examinee who was not interacting with, and quickly omitting, an item would have zero as their number of actions performed on that item and counted as rapid-disengaged using the enhanced method. Rapid-disengagement can also be observed when an examinee quickly provides a response to an item by either quickly selecting a response option for a multiple-choice item or entering a single character response for an open-ended item. Such responses were recorded with only one action representing a single click or keystroke.
Describing the response behaviors of rapid-disengaged examinees
Two indicators calculated from process data were used to describe the response behaviors of examinees who were detected as displaying rapid-disengagement: number and type of response behaviors. These two indicators were reported for examinees detected as rapid-disengaged using RT-only methods under various thresholds. These behaviors were not described for the examinees detected using enhanced methods as they would have either no action or a single action.
Comparing RT-only and enhanced methods
We used a commonly used method for comparing RT-only and enhanced methods: percentage of correct scores of examinees identified as rapid-disengaged. We computed percentage of correct scores for examinees identified as displaying rapid-disengagement. Accordingly, we looked at the differences in percentage of correct scores between disengaged examinees identified by RT-only and enhanced methods. The smaller value indicated a better identification of rapid-disengagement. As for comparing RT-only and enhanced methods based on motivation filtering under different threshold sizes, we anticipated two situations: (a) the percentage of examinees detected as rapid-disengaged would increase as the size of the threshold increased and (b) the enhanced methods would detect a smaller number of examinees than RT-only methods for a given threshold. Given the effects of motivation filtering were found to be dependent on the percentage of examinees detected as disengaged (Rios et al. 2017), such a comparison would not yield systematic results even though we test both methods systematically under various thresholds.Footnote 5
Results
Thresholds and detecting rapid-disengagement
As noted above, the following values were used as the threshold: 5, 10, 20, 30, 40, 50, and 60 s. The numbers and percentages of examinees identified with rapid-guessing by the RT-only and enhanced methods for each threshold-setting method are shown in Table 1.
The examinees identified by the RT-only method but not by the enhanced method are examinees who performed more clicks than the minimum possible actions within the threshold time. Because the threshold represents the minimum time an examinee can solve an item with adequate effort, a large difference between the RT-only method and the enhanced method in the number of examinees identified may indicate that the threshold is large enough to allow examinees more time to perform more actions. The differences in the number of examinees identified are observed to increase as the threshold values increased (see the Differences (RT–E) pane in Table 1).
Describing the response behaviors of rapid-disengaged examinees
To answer research question 1, the number of response behaviors for the examinees identified as displaying rapid-disengagement by the RT-only methods were examined (see Fig. 2). To provide more context about the effectiveness of these action, the proportion of correct responses were also provided at different threshold times.

a For CD items, average number of behaviors for examinees identified displaying rapid-disengagement and engagement behavior by RT-only methods. The labels provide the proportion of examinees receiving full credit on the items. b For Star items, average number of behaviors for examinees identified displaying rapid-disengagement and engagement behavior by RT-only methods. The labels provide the proportion of examinees receiving full credit on the items
The average number of behaviors performed by examinees identified as displaying rapid-disengagement (i.e., the disengaged group in Fig. 2) typically increased as the size of the threshold increased from 5 to 60 s. Even when the largest threshold (60 s) was used, the average number of response behaviors for the rapid-disengaged did not exceed 6. The average number of response actions for the rapid-disengaged did not change across thresholds for Star item 2 and Star item 4. The average number of response behaviors was also low for the examinees identified as displaying solution-behavior (i.e., the engaged group in Fig. 2) for these two items.
Also seen in Fig. 2, engaged examinees typically performed more response behaviors than rapid-disengaged examinees. The difference between engaged and rapid-disengaged examinees was the largest when the average number of response behaviors was greater for the engaged, which was observed for CD item 2, CD item 3, and Star item 1. Even when the average number of behaviors for the engaged examinees was the smallest, as in Star item 4, there was still a difference between engaged and rapid-disengaged examinees. For most items, engaged and disengaged examinees could be differentiated by their number of response behaviors.
To answer research question 2 (What are the types of response behaviors rapid-disengaged examinees perform under varying thresholds when identified by the RT-only methods?), the type of response behaviors of examinees who were identified as displaying rapid-disengagement by the RT-only methods were examined (see Fig. 3).

a Proportion of students identified as displaying rapid-disengagement by RT-only methods performing each type of action, CD items. b Proportion of students identified as displaying rapid-disengagement by RT-only methods performing each type of action for Star items
Based on Fig. 3, it can be seen that while both rapid-disengaged and engaged examinees used the same type of behaviors, the groups differed when they started performing these behaviors and how frequently an action was observed. For example, in CD 1, the proportion of students performing keypresses among rapid-disengaged was zero when the threshold was set to less than 30 s. However, this proportion was above 0.30 for engaged examinees even when the thresholds were small. Another pattern distinguishing rapid-disengaged and engaged examinees was the proportion of students who did not perform any action, which is represented under the “No Action” category. In all items, the proportion of students in the No Action category was higher among the rapid-disengaged than the proportion observed among engaged examinees regardless of the size of the threshold.
To answer research question 2, the differences in the types of response behaviors performed by rapid-disengaged examinees across thresholds were examined. For all items except CD item 1, the largest proportion of students was observed for the “No action” category, which represented students who did not perform any action, when smaller thresholds were used. This proportion decreased as the size of the threshold increased. For example, for Star item 1, all the students who were identified as displaying rapid-disengagement using 5 and 10 s as thresholds left the item without performing any action. As the size of the threshold increased, the proportion of students associated with the no action category decreased and proportion of students displaying other type of behaviors, such as click, increased.
Comparison of enhanced methods with RT-only methods
Percentage of correct scores
To answer research question 3 (How do enhanced methods compare with RT-only methods on the percentage of correct scores under various thresholds?), the proportion of examinees receiving full credit among the rapid-disengaged examinees was compared for the examinees detected by using RT-only methods and those detected using enhanced methods. These proportions are displayed in Fig. 4 along with the maximum score point available for each item and the average score point for all examinees. It should be noted that in constructed response items in particular, rapid-disengagement was expected to result in an incorrect response, as omitting and providing an unrelated response would be scored as incorrect, and therefore earned no credit.

a Comparison of RT-only and enhanced methods of identifying rapid-disengagement based on proportion of correct scores. The asterisks indicate significant 95 confidence intervals built around the differences in proportions for CD item 1–3, and Star item 1. b Comparison of RT-only and enhanced methods of identifying rapid-disengagement based on proportion of correct scores. The asterisks indicate significant 95 confidence intervals built around the differences in proportions. Star item 2–4
Overall, the largest value for the proportion of correct scores was observed for CD item 1 when the threshold was set to 5 s and detection was done using RT-only method. The smallest value, a value of zero, was observed for CD item 2, CD item 3, Star item 1, and Star item 3, all of which are constructed-response items. Only slight differences were observed between the RT-only and the enhanced methods. Based on the 95% confidence intervals around the differences in the proportions, the differences between enhanced methods and RT-only methods were significant only for CD item 1 and Star item 3, which are indicated by an asterisk. The differences were negligible for most of the items. In the case of CD item 1, the differences between RT-only methods and enhanced methods were remarkably different only when the thresholds were quite to very large, specifically 40, 50 and 60 s. And in these cases, the percent correct was larger for the RT-only method. In the case of Star item 3, significant differences were observed only when the thresholds ranged from quite to very large—40, 50, and 60 s. Again, in these cases, the percent correct was larger for the RT-only method. No notable differences were observed for the other five items examined under any of the various thresholds. Among these five items, four of them were constructed response items where the percentage correct under rapid-disengaged response was zero regardless of the detection method employed.
Discussion
The results provided insight on how using response behaviors served to improve accuracy in detecting disengaged examinees. Two innovative approaches were taken in demonstrating the utility of response behaviors: (a) using response behaviors for detecting size of the threshold, and (b) using as a criterion for detecting rapid-disengagement. As might be expected, the number of examinees identified with displaying rapid-disengagement typically increased with the size of the threshold selected (see Table 1). For a given item and a given threshold, examinees identified by the enhanced methods were typically fewer in number than those identified with RT-only method.
Another contribution of this paper is providing a refined way to classify rapid-omit by employing both the number of response behaviors and response time to determine whether a rapid-disengaged examinee omitted an item. Accordingly, only examinees who did not provide any response action within the threshold time were considered as rapidly omitting an item, which were categorized as displaying rapid-disengagement in this study. Wise and Gao (2017) classified rapid responses that were associated with a missing score and classified such behavior as a “rapid-omit.” The rapid-omit classification in Wise and Gao’s study is based on response time and absence of a submitted score (assuming that the response is considered scorable); the number of behaviors was not studied. For example, an examinee may have entered a response and deleted that response in the threshold time and would be considered to have provided a rapid-omit response. Such an examinee would be detected as rapid-omit using the method Wise and Gao employed; however, he or she would not be detected as rapid-disengaged using the enhanced method suggested in this study.
Number of response behaviors for examinees identified as rapid-disengaged
In the items examined to answer research question 1, engaged examinees performed more behaviors than those identified with rapid-disengagement regardless of the threshold size (see Fig. 2). The difference seemed to be dependent on not only the size of the threshold but also the average number of behaviors observed for all examinees. This finding supported the use of response behaviors to differentiate between disengaged and engaged examinees. When a large threshold was used, examinees flagged as displaying rapid-disengagement using RT-only methods included not only the disengaged examinees but also the examinees who had opportunities to interact with the items and perhaps an interest in interacting with them, providing and changing answers as indicated by their large number of response behaviors.
As a side note, the enhanced methods offered in this study flag only the examinees who performed at most one response action. Therefore, the number of behaviors performed by the examinees detected as rapid-disengaged increased as the threshold got larger when RT-only methods were used and remained between zero and one when enhanced methods were used, which were not included in the figures.
Type of response behaviors for examinees identified as rapid-disengaged
The type of response behaviors examined to answer research question 2 indicated that examinees identified as displaying rapid-disengagement performed more diverse actions and fewer examinees exited the item without performing any action. Examinees who displayed solution behavior typically performed the same type of behaviors under various thresholds. This finding also supports the utility of response behaviors for differentiating disengaged from engaged examinees, given that engaged examinees spend time for performing more diverse types response behaviors than disengaged examinees.
Approach 1: Guidelines for deciding on the threshold size based on response behaviors
Overall, based on results from research questions 1 and 2, response behaviors were found to be helpful for assessing the suitability of a threshold. Because response behaviors of disengaged examinees were not inspected in previous studies, there is lack of guidelines on how to benefit from response behaviors for detecting disengaged examinees. From the results of this study, we offer a set of guidelines for detecting the size of the threshold based on the number and type of response behaviors for examinees detected as rapid-disengaged by the RT-only methods under various thresholds. Investigating the type of response behaviors can inform a suitable threshold size by observing one or more of the following instances:
When the proportion of examinees leaving the item without performing any action sharply declines,
when the proportion of behaviors to provide responses, such as click and keypress, starts to increase,
when the proportion of behaviors to provide responses among the disengaged become similar to that of the proportion among solvers, and
when more examinees perform various type of available behaviors.
For each item, thresholds can be suggested based on the guidelines. Accordingly, some potential threshold values can be suggested as follows: 40 s for CD item 1, 10 s for CD item 2, 20 s for CD item 3, Star item 1, Star item 2, Star item 3, and Star item 4. The suggested thresholds along with the reasons for suggesting each threshold value based on the guidelines are displayed in Table 2.
Approach 2: Using enhanced methods
Based on results examining research question 3, enhanced methods can reduce potential over-flagging (i.e., detecting the engaged and fast test-taker as displaying rapid-disengagement) for some items, due to setting a large threshold by putting additional restrictions on the number of behaviors. However, if the threshold value is set too small, there is the potential for under-flagging (i.e., not detecting the slow, disengaged test-taker). Comparisons between RT-only and enhanced methods indicated that the enhanced methods were better in recognizing and correcting a likely over-flagging than the RT-only methods for some items where significant differences were found between RT-only and enhanced methods under large thresholds. However, no general pattern could be observed. It should be noted that both errors cannot be minimized simultaneously—there is a trade-off between the two types of errors (i.e., under-flagging and over-flagging). Wise (2017) noted that avoiding over-flagging is more preferable than avoiding under-flagging because the purpose of examining rapid-guessing is identifying disengaged responses that are distortive and psychometrically uninformative. Therefore, enhanced methods can be said to contribute to correct the error that is less desirable.
Limitations of existing methods for setting thresholds
The different thresholds used in the study allow readers to compare the utility of response behaviors in deciding on the size of the threshold and in comparing RT-only and enhanced methods under various conditions. Only the common and normative methods had a corresponding threshold value analyzed in this study. The visual and two state mixture model methods were not considered in the study to associate with a threshold, because a bimodal distribution was observed in only one of the seven items (Star item 2). It is possible that an overlap between response time distributions for engaged and disengaged examinees could lead to misclassifications. Readers who are interested in applying mixture modeling are encouraged to look at recent developments in using mixture modeling for detecting rapid-guessing (see Pokropek 2016; Ulitzsch et al. 2019). The response accuracy and response time-based methods suggested by Guo et al. (2016) were not studied. As Wise (2017) noted, findings from recent research conflict with the assumptions regarding the probability of getting a correct response under rapid-guessing. Moreover, four items used in this study were constructed response items where the probability of receiving a correct score under random chance is 0, which is not ideal for using this method.
Most of the methods for setting a threshold in the literature were developed for traditional item types such as Likert-scale survey questions or multiple-choice single selection cognitive items. With more digitally based testing, tests include more innovative items types such as matching, drag-and-drop, hot-spot (answer by clicking part of a visual), items embedded in a scenario-based-task, and may even have some audio or video. Such innovative item types and item presentations make identifying a threshold a challenging task. Some thresholds that can be considered “too” large for traditional items may not be sufficient for getting familiarized with the innovative item types or items with innovative features. For example, Wise and Ma (2012) suggested 10 s as the maximum threshold calculated by the normative method. Of the seven PISA items analyzed in this study, 10% of the average response time exceeded 10 s for three items. Therefore, trying thresholds larger than 10 s—with the caution of a potential over-flagging error—can be suggested for many digitally based items. In setting a threshold, Goldhammer et al. (2017) suggested taking into account whether items were positioned towards the end of the test, as issues of test-fatigue could lead to observing larger threshold values.
Limitations of existing methods for evaluating rapid-disengagement
The major limitation of the existing methods for evaluating rapid-guessing was the difficulty in applying these metrics in various situations. As for the criteria for evaluating rapid-guessing, as might be expected, the percentage of correct scores was highly dependent on item difficulty and item type. For example, the proportion of students receiving correct score among the rapid-disengaged examinees did not change much from zero for constructed response items as the likelihood of correct score under rapid-disengagement was 0, not the random chance level of 0.25 associated with multiple-choice items with four response options (see Fig. 4, CD item 2, CD item 3, Star item 1). Moreover, with a multiple-choice item with four response options (e.g., CD item 1), about 50% of the examinees identified displaying rapid-disengagement by RT-only methods answered the item correctly (see Fig. 4, thresholds 5 and 10 s), which is considerably higher than the probability of yielding a correct score by random chance (0.25). As Wise (2017) noted, findings from recent research conflicts with the assumptions regarding the probability of receiving a correct response under rapid-guessing. Findings from the current study echoes Wise’s concerns about associating fixed accuracy rates with rapid-disengagement. Therefore, this criterion was not informative in evaluating rapid-disengagement.
Generalizability across tests and items is an advantage of using the number of response behaviors and type of response behaviors for evaluating the size of the threshold. For example, examinees who rapidly omitted and rapidly responded to items are differentiated using different numbers of behaviors, a single click or keystroke for rapid responses; and no action for rapid-omits. Wise and Gao (2017) differentiated rapidly omitted and rapidly responded items by using responses examinees provided and scores they were awarded. In Wise and Gao’s study, an incorrect score was awarded for an intentionally omitted response. However, scoring rules for missing responses can differ across assessments. For example, in the PISA 2012 assessment and the National Assessment of Educational Progress (NAEP), examinees who did not provide any response to consecutive items at the end of the test are given the benefit of the doubt in case they did not have enough time to complete the items at the end. Instead of awarding an incorrect score to these items, students are treated as if they were not presented these items (NCES 2008, https://nces.ed.gov/nationsreportcard/tdw/analysis/2000_2001/scaling_missing.aspx; OECD 2009). Unlike the scoring rules—which may change based on the assessment and item type—the standard examinee behaviors (e.g., click and keystroke) are typically logged the same way across assessments. This makes response behaviors more suitable for use as standard metrics across assessments than the scores themselves.
While the specific response behaviors collected for each item may change depending on the actions needed to solve the item, in this study we suggested a categorization of response behaviors that is quite generalizable across items. Researchers who are interested in evaluating construct-relevant and construct-irrelevant response behaviors among rapid-guessers would need to categorize the response behaviors at the item level as construct-relevant and construct-irrelevant based on the construct the item purports to measure. Such item-level judgment can be suitable for smaller tests; however, it would not be practical for many large-scale assessments where hundreds of items are administered in a single testing cycle. Moreover, categorizing some response behaviors as related to solving the item is not straightforward. For example, highlighting the question stem may not seem to be directly related to providing a response; however, it can help examinees focus on that part of the question and help with their attention and engagement.
Conclusion
Examinees who display rapid-disengagement provide responses that may not be representative of their abilities, which as a consequence leads to variation in scores that are irrelevant to the construct. Identifying the examinees who are in fact rapid-disengaged and removing those examinees from the data will help reduce construct-irrelevant variance, thereby increasing data quality and strengthening the validity of inferences based on examinee scores. Results from this study suggest that examining the number and type of response behaviors from rapid-disengaged examinees is useful for improving the detection of rapid-disengaged examinees by being instrumental in deciding on the size of the threshold. While enhanced methods could help identify a group of examinees who are more likely rapid-disengaged than those identified by RT-only methods, when a large threshold was set, no pattern was found to indicate as to when or for what kind of items such improvements should be observed. The criterion used to evaluate these differences in this study, namely, the percentage correct, was sensitive to item difficulty and number of students identified as rapid-disengaged. It is suggested that this comparison should be made by using more robust criteria. Overall, response behaviors were helpful in identifying a suitable threshold and thereby improving detection accuracy. Improving the identification of rapid-disengagement, would help reducing construct-irrelevant variance, especially in cases where a large threshold has been chosen.
Future studies
The advantage of using response behaviors is that they provide detection and evaluation criteria that are generalizable across items, tests, and populations. Future studies can fine-tune the enhanced methods described here at the item level. A potential modification is to set the maximum number of response behaviors to the number of clicks required to solve an item in order to receive a correct score. Alternatively, for open-ended, extended response items, the distribution of the number of keystrokes can be used and the standard deviations can be taken into account to identify a minimum number of keystrokes expected from an engaged examinee. While the enhanced methods described here specify the number of response behaviors expected from rapid-disengaged examinees, no specification is done for the type(s) of response behaviors expected to solve items. Yet another way to improve the enhanced methods would be modifying the type of response behaviors expected from rapid-disengaged examinees. Future studies could potentially improve the enhanced methods by specifying the type of response behaviors expected of rapid-disengaged examinees and impose it as a restriction in addition to responding within the threshold time and performing a given number of behaviors. Such a modification can be derived from assumptions about the types of behaviors examinees make. For example, only the actions that are considered construct-relevant may be counted towards the total number actions, eliminating examinees who only made a few construct-irrelevant actions from being considered engaged. Future studies can also benefit from the guidelines for using response behaviors for deciding on the size of the threshold suggested in the paper. As discussed before, producing item-level descriptions of the anticipated responses is a detailed process and costly especially for large number of items. Therefore, whether to provide a generic or a more specific solution probably depends on available resources.
Availability of data
The data and material were retrieved from PISA website in 2016 from http://www.oecd.org/pisa/data/pisa2012database-downloadabledata.htm.
Notes
The use of this data source was approved by Institutional Review Board of the second authors’ institution on October 25, 2016.
In the PISA dataset, the examinees were awarded an "incorrect" score for their omitted responses. A “non reached” code is assigned for all consecutive missing values clustered at the end of test session except for the first value of the missing series.
Both population and sample consisted of 49 male and 51 female students.
Some rapid-disengaged examinees would not perform any actions or respond to the items (i.e., rapid-omit). Response behaviors of these examinees are indicated as “No action” and counted as zero actions.
As for comparing the enhanced and RT-only methods based on motivation filtering, we in fact compared RT-only and enhanced methods using motivation filtering where we computed the average scores score of items before and after removing rapid-disengaged examinees. Scores after motivation filtering were typically found to be higher for enhanced methods than RT-only method for most of the items, especially when larger thresholds were used. While this criterion was typically in favor of the enhanced methods, the results were not conclusive because 95% confidence intervals suggested a significant difference only in some of the cases. Moreover, we also found that motivation filtering is sensitive to the number of examinees identified as rapid-disengaged, which is also related to the size of the threshold, concluding that this is not a good criterion for evaluating detecting rapid-disengaged behavior. Therefore, we did not include our results regarding motivation filtering in this study.
Abbreviations
- ICT:
-
Information and communication technologies
- NAEP:
-
National Assessment of Educational Progress
- PIAAC:
-
Programme for the International Assessment of Adult Competencies
- PISA:
-
Program for International Student Assessment
- RT-only:
-
Response time-only
- RTE:
-
Response time effort
References
Goldhammer, F., Martens, T., Christoph, G., & Lüdtke, O. (2016). Test-Taking Engagement in PIAAC. OECD Education Working Papers, No. 133. OECD Publishing.
Goldhammer, F., Martens, T., & Lüdtke, O. (2017). Conditioning factors of test-taking engagement in PIAAC: An exploratory IRT modelling approach considering person and item characteristics. Large-Scale Assessments in Education,5(1), 18.
Guo, H., Rios, J. A., Haberman, S., Liu, O. L., Wang, J., & Paek, I. (2016). A new procedure for detection of students’ rapid guessing responses using response time. Applied Measurement in Education,29(3), 173–183.
Han, K. T. (2012). Fixing the c parameter in the three-parameter logistic model. Practical Assessment, Research & Evaluation,17(1), 1.
Harmes, J. C., & Wise, S. L. (2016). Assessing engagement during the online assessment of real-world skills. In Y. Rosen, S. Ferrara, & M. Mosharraf (Eds.), Handbook of research on technology tools for real-world skill development (pp. 804–823). Hershey: IGI Global.
Kong, X. J., Wise, S. L., & Bhola, D. S. (2007). Setting the response time threshold parameter to differentiate solution behavior from rapid-guessing behavior. Educational and Psychological Measurement,67, 606–619.
Lee, Y.-H., & Jia, Y. (2012, April). An investigation of response time in a NAEP computer-based assessment. Paper presented at the annual conference of the American Educational Research Association, Vancouver, Canada.
Lee, Y.-H., & Jia, Y. (2014). Using response time to investigate students’ test-taking behaviors in a NAEP computer-based study. Large-Scale Assessments in Education,2(1), 8–41. https://doi.org/10.1186/s40536-014-0008-1.
National Center for Educational Statistics (2008). NAEP technical documentation—Treatment of missing responses in NAEP. https://nces.ed.gov/nationsreportcard/tdw/analysis/2000_2001/scaling_missing.aspx
OECD. (2009). PISA data analysis manual (2nd ed) SPSS.
Pokropek, A. (2016). Grade of membership response time model for detecting guessing behaviors. Journal of Educational and Behavioral Statistics,41(3), 300–325.
Rios, J. A., Guo, H., Mao, L., & Liu, O. L. (2017). Evaluating the impact of careless responding on aggregated-scores: To filter unmotivated examinees or not? International Journal of Testing,17(1), 74–104.
Schnipke, D. L., & Scrams, D. J. (1997). Modeling item response times with a two-state mixture model: A new method of measuring speededness. Journal of Educational Measurement,34(3), 213–232.
Silm, G., Must, O., & Täht, K. (2013). Test-taking effort as a predictor of performance in low-stakes tests. Trames,4, 433–448.
Sundre, D. L., & Wise, S. L. (2003, April). “Motivation filtering”: An exploration of the impact of low examinee motivation on the psychometric quality of tests. Paper presented at the annual meeting of the National Council on Measurement in Education, Chicago, IL.
Ulitzsch, E., von Davier, M., & Pohl, S. (2019). A hierarchical latent response model for inferences about examinee engagement in terms of guessing and item-level non-response. British Journal of Mathematical and Statistical Psychology. https://doi.org/10.1111/bmsp.12188.
Wise, S. L. (2006). An investigation of the differential effort received by items on a low-stakes computer-based test. Applied Measurement in Education,19, 95–114.
Wise, S. L. (2015). Effort analysis: Individual score validation of achievement test data. Applied Measurement in Education,28(3), 237–252.
Wise, S. L. (2017). Rapid-guessing behavior: Its identification, interpretation, and implications. Educational Measurement: Issues and Practice,36(4), 52–61.
Wise, S. L., & DeMars, C. E. (2006). An application of item response time: The effort-moderated IRT model. Journal of Educational Measurement,43(1), 19–38.
Wise, S. L., & Gao, L. (2017). A general approach to measuring test-taking effort on computer-based tests. Applied Measurement in Education,30(4), 343–354.
Wise, S. L., & Kingsbury, G. G. (2016). Modeling student test-taking motivation in the context of an adaptive achievement test. Journal of Educational Measurement,53(1), 86–105.
Wise, S. L., & Kong, X. J. (2005). Response time effort: A new measure of examinee motivation in computer-based tests. Applied Measurement in Education,18(2), 163–183. https://doi.org/10.1207/s15324818ame1802_2.
Wise, S. L., & Ma, L. (2012, April). Setting response time thresholds for a CAT item pool: The normative threshold method. In Annual meeting of the National Council on Measurement in Education, Vancouver, Canada.
Acknowledgements
Authors would like to thank to GB for his comments on the earlier drafts of this article.
Funding
Not applicable.
Author information
Authors and Affiliations
Contributions
FS conceived of the study idea, conducted the analyses, and wrote the first draft. KC supervised the analyses and was a major contributor in rewriting the manuscript. Both authors contributed to final manuscript. Both authors read and approved the final manuscript.
Corresponding author
Ethics declarations
Competing interests
None of the authors have any competing interests in the manuscript.
Additional information
Publisher's Note
Springer Nature remains neutral with regard to jurisdictional claims in published maps and institutional affiliations.


Rights and permissions
Open Access This article is licensed under a Creative Commons Attribution 4.0 International License, which permits use, sharing, adaptation, distribution and reproduction in any medium or format, as long as you give appropriate credit to the original author(s) and the source, provide a link to the Creative Commons licence, and indicate if changes were made. The images or other third party material in this article are included in the article's Creative Commons licence, unless indicated otherwise in a credit line to the material. If material is not included in the article's Creative Commons licence and your intended use is not permitted by statutory regulation or exceeds the permitted use, you will need to obtain permission directly from the copyright holder. To view a copy of this licence, visit http://creativecommons.org/licenses/by/4.0/.
About this article

Cite this article
Sahin, F., Colvin, K.F. Enhancing response time thresholds with response behaviors for detecting disengaged examinees. Large-scale Assess Educ 8, 5 (2020). https://doi.org/10.1186/s40536-020-00082-1
Received:
Accepted:
Published:
DOI: https://doi.org/10.1186/s40536-020-00082-1