- Review
- Open access
- Published:
Review of the accomplishments of mid-latitude Super Dual Auroral Radar Network (SuperDARN) HF radars
Progress in Earth and Planetary Science volume 6, Article number: 27 (2019)
Abstract
The Super Dual Auroral Radar Network (SuperDARN) is a network of high-frequency (HF) radars located in the high- and mid-latitude regions of both hemispheres that is operated under international cooperation. The network was originally designed for monitoring the dynamics of the ionosphere and upper atmosphere in the high-latitude regions. However, over the last approximately 15 years, SuperDARN has expanded into the mid-latitude regions. With radar coverage that now extends continuously from auroral to sub-auroral and mid-latitudes, a wide variety of new scientific findings have been obtained. In this paper, the background of mid-latitude SuperDARN is presented at first. Then, the accomplishments made with mid-latitude SuperDARN radars are reviewed in five specified scientific and technical areas: convection, ionospheric irregularities, HF propagation analysis, ion-neutral interactions, and magnetohydrodynamic (MHD) waves. Finally, the present status of mid-latitude SuperDARN is updated and directions for future research are discussed.
Introduction
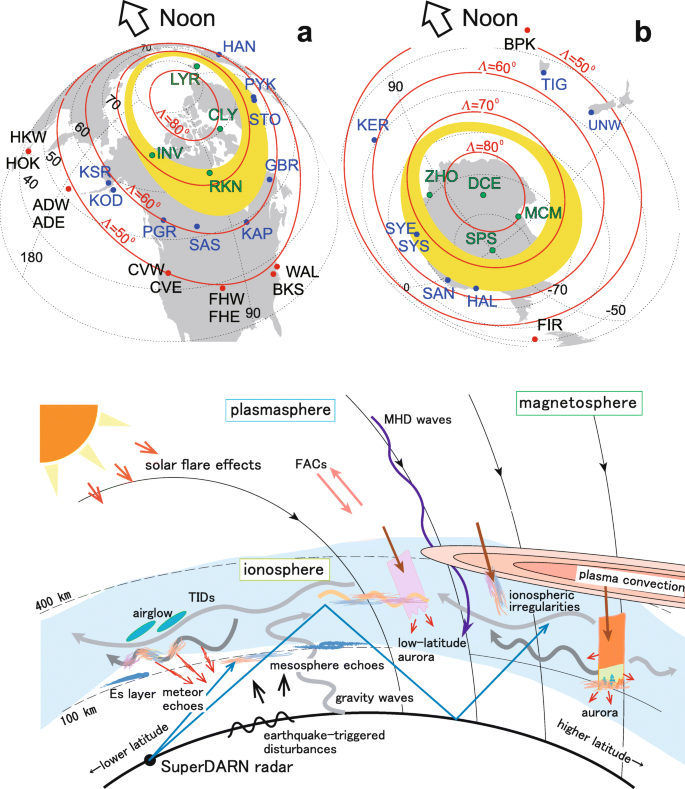
The Super Dual Auroral Radar Network (SuperDARN) is a network of high-frequency (HF) radars located in the high- and mid-latitude regions of both hemispheres that is used to study the dynamics of the ionosphere and upper atmosphere on global scales. As of 01 Jan 2018, there were a total of 36 SuperDARN radars, 23 in the Northern Hemisphere and 13 in the Southern Hemisphere as shown in Fig. 1. The fields of view (FOVs) of the mid-latitude radars are shown in red. Table 1 shows a list of all the SuperDARN radars (details of geomagnetic coordinates will be described in the “Meaning of geomagnetic coordinates” subsection). Figure 2 shows a photo of the Fort Hays East (FHE) and West (FHW) antenna arrays and the shelter that houses the electronic equipment for both radars. The main and interferometer antenna arrays of each radar are used for measuring the elevation angle, which is estimated from the phase difference between the signals received on these two arrays.

Fields of view of the SuperDARN radars in the a Northern and b Southern Hemispheres

Photo of the Fort Hays East and West radar antennas and radar equipment shelter
SuperDARN achieved official status in 1995 when the Principal Investigators’ Agreement was signed. Until about 2004, the SuperDARN radars were only able to monitor the regions of the ionosphere and upper atmosphere poleward of about 60° geomagnetic latitude (MLAT). Ionospheric and upper atmospheric phenomena in the sub-auroral or mid-latitude regions were largely inaccessible to the radars.
The first purpose-built “mid-latitude” SuperDARN radar, with a site located equatorward of 50° MLAT, began operating at the National Aeronautics and Space Administration (NASA) Wallops Flight Facility on Wallops Island, Virginia (USA) (WAL) in 2005, shortly followed by the second mid-latitude radar in Hokkaido (Japan), Hokkaido East radar (HOK) in 2006 (detailed discussion of the definition of the mid-latitude SuperDARN will be made in the “Definition of a mid-latitude radar” subsection). The success of these radars led to the construction of a second US radar near Blackstone, Virginia (BKS) and finally to the deployment of a chain of radars that extends across North America and the northern Pacific Ocean into eastern Asia. As a result, there are now more than 10 mid-latitude SuperDARN radars with additional radars under construction or planned, see the “Brief history of mid-latitude SuperDARN” subsection and also the Additional file 1 titled “Historical Overview of Mid-latitude SuperDARN” for the details of the mid-latitude SuperDARN history.
Over the past 15 years of operation of mid-latitude SuperDARN radars, a number of scientific discoveries have been made that encompass processes in the magnetosphere, ionosphere, thermosphere, and upper mesosphere, some with wide latitudinal and longitudinal extents. It seems an appropriate time to review the new scientific results and critically assess these achievements.
There have been several previous papers that review the entire SuperDARN network (e.g., Greenwald et al. 1995; Chisham et al. 2007) but none have focused exclusively on mid-latitude studies. The purpose of this paper is to review the accomplishments made with the mid-latitude SuperDARN radars. It is hoped this will enhance coordination between the SuperDARN groups in different countries and will help make their accomplishments known to scientists in other research fields. In addition, by looking back on the scientific achievements, one can also look forward to the future. This review concludes with a discussion of several aspects of the future directions of the mid-latitude SuperDARN network.
Basics of SuperDARN
SuperDARN radars observe scatter from a variety of sources, including ionospheric irregularities, the ground/sea surface, meteor ionization trails, and possibly ice crystals in the mesosphere, sometimes referred to as polar mesosphere summer echoes (PMSE). Thus, these radars are very versatile in terms of the science which they can address. Here, a very brief discussion of the basics of the types of scatter, modes of HF propagation, and operating modes is provided, recognizing that the first two of these will be covered in more detail in terms of the mid-latitude radar observations in later sections.
SuperDARN radars are coherent scatter radars (Greenwald et al. 1995) where the signal received from the ionosphere is similar to Bragg scatter of X-rays in crystals. Here, the signal is returned essentially along the same path as the transmitted signal such that the radars receive direct backscatter, although it is possible for the transmitted signal to be scattered in other directions. Due to the nature of Bragg scatter, the scale size of the irregularities from which the signal is scattered is directly related to the half-wavelength of the transmitted signal. The irregularities in the ionosphere causing the backscatter can occur at a range of different altitudes, including the D, E, and F regions of the ionosphere (e.g., Milan et al. 1997a; Milan and Lester 1998; Milan et al. 2001). A more detailed discussion of ionospheric irregularities is given in the “Ionospheric irregularities” section. There are two other potential sources of returned signal from the ionosphere/upper atmosphere. The ionization that is created in the atmosphere by meteors can also lead to backscattered signal in SuperDARN data, but this typically occurs in the near ranges as the meteor trail altitude range is typically between 85 and 120 km (e.g., Thomas et al. 1986; Hall et al. 1997; Chisham and Freeman 2013). Finally, and perhaps more controversially, there is the possibility that SuperDARN radars receive scatter in near ranges which is similar to PMSE (e.g., Ogawa et al. 2002a; Ogawa et al. 2003; Hosokawa et al. 2005). There remains some level of controversy over the validity of this interpretation which requires further investigation (Ponomarenko et al. 2016).
SuperDARN radars are capable of operating in the HF band of the radio spectrum between 8 and 20 MHz although most radars actually operate over a narrower range of frequencies, typically between 10 and 14 MHz. At these frequencies, radar signals can be refracted by the ionosphere such that over the horizon (OTH) propagation is possible. Although a detailed discussion of HF propagation is given in the “HF propagation analysis” section, a brief overview of propagation is provided here and this is illustrated by Fig. 3 which shows an example ray-tracing simulation for 11 MHz transmissions on beam 12 of BKS at 1400 Universal Time (UT) on 18 November 2010 (de Larquier et al. 2013). The ray paths (colored in gray) span 5–55° in take-off elevation angle and propagate through an International Reference Ionosphere (IRI)-2011 ionosphere color coded by electron density according to the scale on the right. Several important HF propagation modes can be identified:
-
1.
The first is “penetrating rays” which have high enough elevation angles to pass through the F2 peak density region without ionospheric refraction bringing them to horizontal propagation. These rays exit the topside ionosphere unless they encounter ionospheric plasma irregularities aligned with the geomagnetic field direction (pink lines) that can produce ionospheric backscatter in a so-called “½-hop” mode. Ray segments with favorable aspect conditions for experiencing this form of backscatter (i.e., ≤ 1° from orthogonality with the geomagnetic field) are shaded black. This ½-hop ionospheric backscatter can occur in both the E or F regions with the E region ionospheric scatter dominating at nearer slant ranges.
-
2.
Propagation of rays downward to the ground (including the sea surface) due to refraction by the ionosphere is also illustrated here. These rays result in “ground scatter” once roughness on the terrestrial surface is encountered and some power is backscattered to the radar. The ground range to the nearest edge of the ground scatter is a little over 1000 km while the outer edge extends to over 2000 km. The ground scatter is important for a variety of studies, including investigations of atmospheric gravity waves (see the “Ion-Neutral Interactions” section) and magnetohydrodynamic (MHD) waves (see the “MHD Waves” section).
-
3.
The signal can take multiple hops to even farther distances, such that the radar can receive scatter from the ionosphere not just directly but from beyond the first location of ground scatter. Moreover, subsequent refraction to downwards propagation can generate bands of ground scatter from more distant ranges.

Ray-tracing results for 11 MHz transmissions on beam 12 of the Blackstone radar propagating through the predicted IRI-2011 ionosphere on 18 November 2010 at 14:00 UT (see text for details). Reproduced from Fig. 3 of de Larquier et al. (2013)
The different types of ionospheric scatter are illustrated by the data plotted in Fig. 4 (Clausen et al. 2012) where single scans from the Christmas Valley East and West radars (CVE and CVW, respectively) are plotted. Four different types of scatter are identified in this figure. Scatter type I is low-velocity scatter at very near ranges that has been identified as signal returned from meteor ionization trails (e.g., Hall et al. 1997). Scatter type II is in the western part of the CVW FOV and has velocities of the order of 100 m s−1; this is ionospheric scatter from the F region and is typical of the low-velocity backscatter routinely obtained at mid-latitudes on the nightside (e.g., Greenwald et al. 2006). At a somewhat higher latitude, closer to 60° N MLAT, and labeled III, there is a narrow-in-latitude but extended-in-local time (LT) region of high-velocity scatter that is typical of a sub-auroral polarization stream (SAPS) event (see the “Convection” section for more detailed discussion of this feature). Finally, the high-velocity scatter type IV is more typical of the type of scatter observed in the auroral zone by the high-latitude radars. Thus, Fig. 4 illustrates that even mid-latitude radars can observe auroral scatter.

A plot of Doppler velocity against radar beam and range from CVE and CVW radars. This figure shows Doppler velocity observations (positive toward the radar) for one scan of data from CVW and CVE and indicates four separate regions of ionospheric scatter indicated by the number I—meteor scatter, II—low-velocity ionospheric scatter from the sub auroral region, III—scatter from a SAPS, and IV—low-velocity ionospheric scatter from the auroral regions. Reproduced from Fig. 2 of Clausen et al. (2012)
It is important to note that the latitude of a radar does not specifically determine that it will always measure scatter from a specific region for two reasons. One is simply that the equatorward edge of the auroral oval is not located at the same latitude for all LTs, being at higher latitudes at noon than at midnight (Fig. 5). Furthermore, the level of magnetic activity determines the relative location of a radar with respect to auroral boundaries, and hence, the type of scatter that is received. As magnetic activity increases and the polar cap area increases, the auroral oval expands equatorward while under extremely quiet conditions the oval moves to higher latitudes as the polar cap contracts (e.g., Milan et al. 2003).

Schematic plots showing the a Northern and b Southern Hemisphere SuperDARN radar locations with respect to the auroral oval. The auroral oval (yellow) for moderately disturbed conditions, as quantified by Holzworth and Meng (1975), is plotted as a function of AACGM coordinates with the SuperDARN radar locations identified in green type and green closed circles (polar cap latitudes), blue type and blue closed circles (auroral latitudes), and black type and red closed circles (mid-latitude radars)
SuperDARN radars have at least 16 different look directions along which they can sample over 70 or more range gates. The normal, or common, operational mode of the radar provides a full azimuth scan every 1 or 2 min with integration times that vary between 3 and 7 s per beam. In this mode, the scan is always synchronized to start on the 1-min boundary. Special modes can also be run on all the radars or a subset of radars. Here, the mode of operation is the same among the radars participating in the special mode and could involve a scanning pattern very different from the standard common mode. Finally, there are discretionary modes where individual radars run in a very specific way for specific scientific purposes. These modes are more likely to be run on only one or two radars, often in support of regional campaigns such as rocket launches or during heating campaigns. Special and discretionary modes can run beam scans in any sequence, with any time resolution and also with no synchronization. The allocation of time is made by a working group of the community which allocates no less than 50% of time each month to common modes, up to 20% of each month to special modes and up to 30% of time to discretionary mode. The minimum time length of any specific run is currently 6 h; although in the past, it has been as long as 1 day. If there are no requests for either discretionary or special time, or radars are not running in these modes, then the operational mode defaults to common mode.
The radars produce a variety of data products, the most widely used being the backscatter power (signal-to-noise ratio), the line-of-sight (LOS) Doppler velocity, the spectral width, and the elevation angle of arrival. The radars transmit a sequence of 7 or 8 unevenly separated pulses with an individual pulse length of 300 microseconds, which provides a range resolution of 45 km. A reduced pulse length of 100 microseconds (15 km range resolution) has also been used on occasion (e.g., Lester et al. 2004); at least some of the mid-latitude radars have the capability of operating at this higher spatial resolution. From combining pairs of different pulses in the sequence, different lags of an autocorrelation function (ACF) are generated. Typically, 25–30 multi-pulse sequences are averaged in order to obtain a statistically meaningful ACF against noise, which corresponds to ~ 3-s integration time for a single beam. From the ACFs, the Doppler velocity is estimated by fitting a linear function to the measured ACF phase, while backscattered power and spectral width are estimated from fitting a linear or a quadratic function to the logarithm of the measured ACF power. Some radars operate in slightly different modes from this but still create the basic data products described above.
Definition of a mid-latitude radar
It is not so straightforward to characterize radars as belonging to the mid-latitude region. The auroral oval does provide a scheme for identifying three zones as shown schematically in Fig. 5. The continuous band mapped out by auroral luminosity constitutes the auroral oval while the enclosed region is the polar cap. Extending equatorward of the auroral oval is the sub-auroral region. This figure suggests a natural assignment of radar identity based on which region dominates in a radar FOV. However, the positions of the oval boundaries vary with time of day and also with geomagnetic activity level. The diurnal variation is fairly predictable but the expansion and contraction with activity level is not. The oval depicted in Fig. 5 is roughly appropriate to a Kp value of 2 which is fairly typical and corresponds to a slight geomagnetic disturbance. The positions of the radars in the Northern Hemisphere are indicated with dots and labeled with their three-letter identifiers. The FOVs of the radars in the ionosphere generally begin several hundred kilometers to the north of the radar position. It can be seen that the original high-latitude radars follow the 60° N MLAT contour; this geometry places them in excellent position to observe across the oval on the nightside for typical conditions. The radars at lower latitudes will then observe across a large (~ 10°) interval of sub-auroral latitudes, even deep on the nightside. This is used as our discriminator: radars sited equatorward of 55° MLAT are considered to be mid-latitude radars while appreciating that during expansion of the oval these mid-latitude radars will make extensive auroral observations. Similarly, during periods of contracted oval, the high-latitude radars will observe across a substantial portion of the sub-auroral region. Even during relatively quiet periods the high-latitude radars are capable of making sub-auroral observations over their nearer range intervals and along more zonally oriented beam directions. This review incorporates findings on sub-auroral research topics from both the mid-latitude and high-latitude radars and will make some distinction as to whether radars were purpose-built to be mid-latitude radars capable of making observations of the expanded auroral oval.
Meaning of geomagnetic coordinates
The Earth’s magnetic field plays a dominant role in defining the geometry of the auroral oval, and it is natural to map auroral phenomena in a geomagnetic coordinate system. The Altitude-Adjusted Corrected Geomagnetic (AACGM) coordinate system was derived by Baker and Wing (1989) in order to compare data from SuperDARN radars in opposite hemispheres and is based on tracing geomagnetic field lines using the International Geomagnetic Reference Field (IGRF) which is a mathematical description of the Earth’s magnetic field updated at 5-year intervals (e.g., Barraclough 1987; Thébault et al. 2015). In AACGM coordinates, points along a given magnetic field line are given the same coordinates and are thus a better reflection of magnetic conjugacy. The concept of AACGM was re-analyzed by Shepherd (2014) which resulted in a procedure that more accurately represents the underlying coordinate system. The new description, known as AACGM-v2, is the accepted basis for mapping SuperDARN data. Here, one encounters an interesting complication: the magnetic field is changing surprisingly rapidly (secular variation) with the result that the geomagnetic coordinates of the radar sites and their FOVs are changing. For example, the MLAT of WAL has changed from 48.37° N to 46.96° N, a decrease of 1.4°, over the 15 years since its construction in 2005. Table 1 lists the AACGM-v2 coordinates of the radar sites to one decimal point accuracy for 1 January 2018. The secular variation should be borne in mind when comparing observations from different eras.
Brief history of mid-latitude SuperDARN
Figure 6 presents a timeline of radar operations with ordering by MLAT. The AACGM-v2 coordinates were used. The first purpose-built mid-latitude SuperDARN radar (WAL) began operation at Wallops in the spring of 2005. This was followed by HOK, a radar in Hokkaido, northern Japan, which started operation in 2006. Next, a radar was installed near Blackstone in 2008 (BKS). One year later, as a part of the National Science Foundation (NSF) mid-sized infrastructure (MSI) program for “StormDARN,” the first radar pair was built near Hays, Kansas (Fort Hays) (FHE and FHW) in 2009, the second near Christmas Valley, Oregon (CVE and CVW) in 2011, and the third on Adak Island (ADE and ADW) in the Aleutians in 2012. A second SuperDARN radar in Hokkaido, the Hokkaido West radar (HKW), was deployed in 2014. In the Southern Hemisphere, a radar was briefly deployed on the Falkland Islands (FIR) from 2010 to 2011. This radar resumed operations in November 2017. A new radar was deployed at Buckland Park, Australia (BKP) in 2014. For details of the history of the Mid-latitude SuperDARN, please refer to the Additional file 1 titled “Historical Overview of Mid-latitude SuperDARN.”

Timeline of the SuperDARN radars in the a Northern and b Southern Hemispheres. The geomagnetic latitudes are in AACGM-v2 coordinates, changing as a function of time
Structure of this paper
Figure 7 shows a schematic illustration of natural phenomena which can be studied by SuperDARN radars. It can be seen that SuperDARN observes a wide variety of phenomena, ranging from polar to mid-latitudes, and from the magnetosphere/ionosphere to the thermosphere/upper mesosphere. Some topics have found new prominence in recent years as a direct result of the development of the mid-latitude SuperDARN radars. Specific examples include sub-auroral and mid-latitude plasma flows, solar flare effects on the ionosphere, and earthquake-triggered ionospheric disturbances.

Schematic illustration of natural phenomena which can be studied by SuperDARN radars
This paper consists of five sections, each of which examines a specific scientific area, followed by a section on conclusions and future directions. A major benefit of mid-latitude SuperDARN is its ability to monitor the expansion of convection to lower latitudes during geomagnetically active periods, which was not possible with the high-latitude SuperDARN radars because of their limited spatial coverage and radio wave absorption due to enhanced precipitation (“Convection” section). The network is also useful for monitoring the occurrence of ionospheric plasma irregularities across the transition from the auroral to the sub-auroral and mid-latitude zone. (“Ionospheric irregularities” section). An important element of SuperDARN data capture is the role of HF propagation analysis which provides clues to the disturbance processes in the ionosphere due to a variety of factors (“HF propagation analysis” section). In addition, SuperDARN radars can also monitor ionospheric phenomena affected by the exchange of energy and momentum between the charged and neutral components of the Earth’s upper atmosphere (“Ion-neutral interactions” section). Finally, the radars are a powerful tool for monitoring MHD waves over a wide latitudinal range and studying their source mechanisms (“MHD waves” section). After reviewing these scientific topics, future directions of the network will be discussed from several points of view (“Conclusions and future directions” section).
Convection
Motivation for the first SuperDARN radar located equatorward of 50° MLAT, and the subsequent expansion at mid-latitudes, was largely due to the inability of the existing high-latitude network to measure the full latitudinal extent of ionospheric convection during geomagnetically active periods. During times when the auroral region expands equatorward of the lower latitude limit of the existing network (~ 60° MLAT), radars are no longer able to measure the complete extent of convection. In addition, absorption due to enhanced precipitation can significantly attenuate radar signals at auroral latitudes, further reducing measurements of the ionospheric convection electric field.
Evidence of the need for measurements at lower latitudes was provided by Ruohoniemi et al. (2001) who showed a prompt and widespread ionospheric response to a coronal mass ejection (CME)-driven shock. The high-latitude SuperDARN radars used in this study showed a rapid increase in the convection velocity at all magnetic local times (MLTs), from dawn to dusk, an increase in the amount of backscatter observed and an equatorward expansion of the high-latitude convection region. The study focused on the now-casting capability of SuperDARN during the shock arrival, but it also acknowledged that the auroral region continues to expand equatorward of the existing SuperDARN FOVs and a reduction in the amount of backscatter occurs later in the event. Kane and Makarevich (2010) showed this behavior explicitly in several examples of the ionospheric convection response to storm sudden commencement (SSC) with a significant reduction in the amount of backscatter and magnitude of the velocities observed ~ 30 min after the SSC.
The success of expanding SuperDARN to the mid-latitude region and capturing the dynamics of storm-time convection is discussed in more detail in the “Storm-time convection” subsection. Following the completion of the first mid-latitude radar (WAL), subsequent radars were constructed in rapid succession, extending the coverage of mid-latitude phenomena by SuperDARN both in UT, thereby increasing opportunities for observing transient features (discussed in the “Transients” subsection), and MLT, allowing for the characteristics and dynamics of longitudinally extended features, such as SAPS and sub-auroral ion drifts (SAIDs) to be determined (discussed in 10 subsections from “SAPS: Introduction” to “Implications for SAPS formation scenarios”).
Storm-time convection
During periods of enhanced geomagnetic activity triggered by a sustained southward interplanetary magnetic field (IMF), the auroral electric fields associated with magnetospheric convection are known to expand equatorward into the mid-latitude ionosphere (MLAT < 60°) (e.g., Carbary 2005). Baker et al. (2007) demonstrated for a moderate geomagnetic storm how the high-latitude Goose Bay radar (GBR) can monitor the equatorward progression of the auroral convection over a 6-h interval from only 75–65° MLAT before observations are disrupted by enhanced precipitation and E region backscatter at nearer ranges. However, for the same period, the mid-latitude radar (WAL) is able to track the convection expansion from 70 to 55° MLAT, offering an additional 10° in latitudinal coverage and corresponding improvement in mapping the instantaneous global convection pattern. Later studies of storm-time plasma circulation by Hosokawa et al. (2010) and Thomas et al. (2013) used additional mid-latitude radars to address the role of the convection electric field in the transport of dayside storm-enhanced density (SED) plasma through the cusp and into the polar cap to form the polar tongue of ionization (TOI). Figure 8 shows the evolution of a TOI in global positioning system (GPS), now a part of Global Navigation Satellite System (GNSS), total electron content (TEC), and the LOS velocity from SuperDARN radars, including mid-latitude radars located on the dayside measuring the convection throat (Thomas et al. 2013). Previous efforts to determine the connection between mid-latitude SED and polar TOI were hampered by the inability of the high-latitude SuperDARN radars to observe the lower latitude sunward convecting regions believed to be crucial in this global plasma circulation (Foster et al. 2005).

Baker et al. (2007) also showed the importance of mid-latitude measurements for describing the morphology and strength of the large-scale convection electric field pattern, particularly on the nightside during increased geomagnetic activity where convection extends to lower latitudes. Figure 9 shows statistical convection patterns from Baker et al. (2007) both with and without the mid-latitude WAL data during moderate to disturbed geomagnetic conditions (Kp ≥ 3), illustrating stronger overall convection (larger cross-polar cap potential) and more detail of the flows on the nightside associated with the Harang discontinuity.

Average patterns of Northern Hemisphere ionospheric convection calculated from SuperDARN data collected during periods of increased geomagnetic activity (Kp ≥ 3) between June 2005 and April 2006. Contours of the global solution of electrostatic potential are shown as black lines spaced every 4 kV. Adapted from Fig. 12 of Baker et al. (2007)
A more recent study by Thomas and Shepherd (2018) used data from all available SuperDARN radars (including 10 mid-latitude radars) during the 7-year period spanning 2010–2016 to produce patterns of the high-latitude convection electric field using a technique similar to that used by Ruohoniemi and Greenwald (1996); Ruohoniemi and Greenwald (2005); and Cousins and Shepherd (2010). The statistical patterns produced by Thomas and Shepherd (2018) demonstrate that inclusion of mid-latitude data can increase the cross-polar cap potential by as much as 40% and provides a significantly improved specification of the plasma flows on the nightside during a wide range of geomagnetic activity.
Fiori et al. (2010), using the Spherical Cap Harmonic Analysis (SCHA) technique, showed that convection can be increased by moving the lower latitude limit, but caution should be taken with the amount of data going into each pattern. Cousins and Shepherd (2010) demonstrated that the solutions to the statistical patterns were relatively insensitive to the lower latitude boundary.
Under steady-state conditions a shielding electric field formed at the inner edge of the plasma sheet and associated with the region 2 field-aligned currents (FACs) counteracts the effects of the solar wind-driven magnetospheric convection at sub-auroral latitudes (Nishida 1968). This shielding electric field is directed in the opposite sense to the dawn-dusk convection electric field and varies on time scales ≤ 1 h (Kelley et al. 1979). There are two cases where significant electric fields may develop in the inner magnetosphere following IMF transitions which occur on timescales faster than the shielding layer can respond. The first is the “under-shielding” scenario where a sudden intensification in convection causes the dawn-dusk electric field to penetrate to the inner magnetosphere and all the way to the equatorial ionosphere. The second case occurs when the IMF Bz component turns northward after prolonged southward IMF conditions and the shielding electric field becomes dominant over the convection electric field, known as “over-shielding.”
Ebihara et al. (2008) presented the first mid-latitude SuperDARN observations of the over-shielding electric field using HOK. They examined two reverse flow periods during a moderate geomagnetic storm, the first of which was attributed to over-shielding associated with a northward IMF turning while the second occurred during southward IMF conditions and could not be replicated in the ring current simulation. The second one is probably associated with a substorm. When a substorm occurs, over-shielding is shown to appear at low- and mid-latitudes without northward turning of IMF by global MHD simulation (Ebihara et al. 2014). A later study by Kikuchi et al. (2010) also examined over-shielding signatures during the same geomagnetic storm, although in the context of equatorial DP2 fluctuations were attributed to alternating eastward and westward electrojets in the equatorial ionosphere. Using mid-latitude SuperDARN contributions to the instantaneous global convection patterns, they suggested the dayside reverse flow vortices observed equatorward of the larger two-cell convection correspond to the region 2 FACs responsible for over-shielding at the equator. The study of over-/under-shielding phenomena with mid-latitude SuperDARN radars remains an under-utilized capability and an area for future studies.
To summarize, storm-time convection electric fields corresponding to a variety of geophysical drivers are observed by the mid-latitude SuperDARN radars. Lyons et al. (2016) presented a synthesis of ground- and space-based observations characterizing these fields during the 17 March 2013 geomagnetic storm. They identified an inter-relationship between the expansion of the auroral oval, penetration electric fields, auroral stream activity, and SAPS, which is discussed in the next section.
SAPS: Introduction
The sub-auroral region of geospace is where dramatic plasma convection enhancements occur during geomagnetic storms and substorms. Initially identified with low-orbit satellites as latitudinally-narrow regions of very strong westward plasma flows up to 4 km s−1, they have been termed polarization jet or PJ (Galperin et al. 1973), SAID (Spiro et al. 1979), and sub-auroral electric field or SAEF (Karlsson et al. 1998). These narrow flow channels were proposed to be driven by the poleward polarization electric field located equatorward of the electron precipitation region due to the radial separation between the inner plasma sheet electrons and ions (Southwood and Wolf 1978). A similar explanation has been proposed for broader regions of enhanced plasma convection that were regularly observed during geomagnetic storms by the Millstone Hill incoherent scatter radar (Yeh et al. 1991; Foster and Vo 2002). As a result, an encompassing term of SAPS has been proposed to include both narrow PJ/SAID forms and broader regions (Foster and Burke 2002).
Sub-auroral convection enhancements during substorms were also reported based on observations by very high-frequency (VHF) coherent scatter radars (Unwin and Cummack 1980; Freeman et al. 1992) and early SuperDARN observations conducted with the most equatorward radars in the high-latitude network (Parkinson et al. 2003a; Koustov et al. 2006). These early radar studies stopped short of directly associating the observed signatures with SAPS. To describe their radar substorm signatures, Unwin and Cummack (1980) used the term drift spikes, while Freeman et al. (1992) called their events substorm-associated radar auroral surges or SARAS. Similarly, Parkinson et al. (2003a) introduced the term Auroral Westward Flow Channel (AWFC) to describe their Tasman International Geospace Environment Radar (TIGER) Bruny Island (TIG) observations, while Koustov et al. (2006) used the term “SAPS-like flows” in reference to strong convection regions seen by King Salmon radar (KSR). The current definition of SAPS does not involve any particular threshold in plasma convection velocity (although there were attempts to estimate the slowest threshold of SAPS velocity, e.g., Nagano et al. 2015), and it only requires that locally enhanced plasma flows should be linked to the extended dusk convection cell that extends equatorward of the electron precipitation boundary (Huang et al. 2006). For this reason, most of these early radar observations should also be classified as SAPS.
The question of the nomenclature is ultimately related to the question of physical origins and driving mechanisms. The radial charge separation and the associated polarization electric field in the magnetosphere are widely accepted to be one of the two main drivers, with the other one being positive feedback between the magnetospheric electric field and ionospheric conductance (e.g., Wolf et al. 2007). In this feedback model, the magnetosphere-ionosphere (MI) system is assumed to act as a current generator, with the total current being conserved. In this case, the initial polarization electric field drives ion convection in the ionospheric F region, which increases heating and recombination rates, depleting ionospheric densities, and further strengthening SAPS electric fields (Anderson et al. 1993). Despite a general consensus on the importance of these two processes for SAPS formation and evolution, there appears to be a growing realization that these do not explain some characteristics of narrow SAID (Mishin and Puhl-Quinn 2007; Puhl-Quinn et al. 2007). Similarly, the discovery of highly dynamic and localized plasma flows within SAID/SAPS that are often referred to as the SAPS wave structure or SAPSWS (Mishin et al. 2003; Mishin and Burke 2005) has challenged the view of SAPS as a generally uniform flow region with possibly one or more narrow SAID-like flow channels (Erickson et al. 2002; Mishin et al. 2003; Foster et al. 2004; Mishin and Burke 2005).
SuperDARN observes SAPS as a multi-scale phenomenon from large regions of sub-auroral westward convection seen simultaneously by multiple radars to small-scale flow enhancements within only a few range gates. Figures 4 and 10 present two examples of such observations. Figure 4 shows a snapshot of LOS velocities observed by the CVW/CVE pair on 09 April 2011 at 0840 UT. The SAPS scatter is observed near MLAT of 60°. The SAPS region extends across both FOVs and the flow velocities are well in excess of 500 m s−1. Figure 10 from Makarevich and Bristow (2014) presents the CVW velocity on 17 March 2013, 0930–1430 UT versus time and MLAT. During the period marked by the two vertical white lines, the westward flow is strong and the MLAT range is narrow, which makes it consistent with SAID. Small-scale structure is also clearly present near 1215 UT; it takes the form of small enhancements that are only 1–2 range gates in extent and that propagate toward higher MLATs. Figures 4 and 10 thus illustrate the three major advantages of SuperDARN in relation to SAPS research: (1) global-scale spatial coverage that enables SAPS observations over an extended MLT sector, (2) nearly continuous temporal coverage during extended periods, and (3) relatively high spatial and temporal resolutions that enable investigations of small-scale structure of SAPS.

CVW velocity in beam 4 on 17 March 2013, 0930–1430 UT. The green cells refer to the SAPS region. The two vertical white lines mark the period of narrow and intense SAID feature. The period of strong SAPS Wavy Structure (SAPSWS) activity is near 1215 UT. Reproduced from Fig. 2a of Makarevich and Bristow (2014)
In the last decade, SuperDARN has provided numerous contributions to SAPS research that can be divided into the following two groups, roughly corresponding to spatial and temporal features of SAPS. The first exploits the advantage of global coverage of the sub-auroral and auroral ionosphere allowing SuperDARN investigations to improve knowledge of global characteristics and external control of SAPS and, through that, achieve a better understanding of the relative importance of global/external factors versus other drivers. The second exploits the advantage of continuous coverage allowing SuperDARN investigations to improve knowledge of temporal dynamics of SAPS including the importance of the MI feedback mechanism. Studies that address these two categories of issues are respectively reviewed in the following subsections.
Global characteristics and control of SAPS
Study of the large-scale structure of SAPS has been greatly advanced by the significantly expanded coverage of mid-latitude SuperDARN. In coordination with the original high-latitude radars, the network of mid-latitude SuperDARN radars is unrivaled in its ability to address the spatial characteristics of SAPS on global scales.
Longitudinal extent and variation of SAPS
The longitudinal structure of SAPS in the sub-auroral and mid-latitude region has been investigated (Oksavik et al. 2006; Koustov et al. 2006; Kataoka et al. 2007; Clausen et al. 2012). In their study, Oksavik et al. (2006) examined a SAPS flow channel equatorward of 60° MLAT that was observed for several hours by WAL. It was revealed that a fast westward flow appeared in the pre-midnight sector, while an eastward flow was co-located on the higher latitude side of the fast westward flow in the post-midnight sector, forming a flow reversal as seen in Fig. 11 (Oksavik et al. 2006). Kataoka et al. (2007) examined a similar flow reversal with HOK and confirmed that the flow reversal is also present in the post-midnight sector and is enhanced during a magnetic storm.

LOS Doppler velocity for a 1-min scan of WAL showing a strong sub-auroral westward flow channel. Overlaid is a swath of the 135.6 nm aurora from TIMED GUVI, cross-track drift velocity from the DMSP F15 spacecraft, and the track of the NOAA-18 spacecraft, which are used to determine the equatorward edge of electron precipitation (shown as a thick dotted line). Adapted from Fig. 1 of Oksavik et al. (2006)
In addition to these studies conducted with single radar, the unique capability of SuperDARN for investigating SAPS—the extensive longitudinal coverage provided by combining several neighboring radars—is evident in more recent studies. A remarkable example demonstrating this capability is given by Clausen et al. (2012), who studied the spatiotemporal evolution of a SAPS flow channel, seen in the bottom/left panel of Fig. 12 as a narrow (few degrees wide) channel of westward flow extending over 6 h of MLT and through the FOVs of six mid-latitude SuperDARN radars. Comparison with the GPS TEC map in the top/left panel of Fig. 12, reveals that the SAPS channel is associated in latitude with the position of the ionospheric trough over this wide range of MLT. In addition, Clausen et al. (2012) determined from the distributed and near instantaneous measurements of the structure that the maximum flow speed within the SAPS increases exponentially with decreasing MLT. However, a more recent statistical study suggests the MLT dependence is more commonly quasi-linear (Kunduri et al. 2017).

Top/left: spatial distribution of GPS TEC with precipitating electron flux along a pass of NOAA/POES satellite. Bottom/left: 2-D map of LOS velocities observed by mid-latitude SuperDARN radars over North America at 0840 UT on 9 April 2011. Right: Vector representation of the average large-scale SAPS flow direction and the inferred SAPS speed identified by the three radar pairs. Time runs along the y axis, increasing toward the bottom. Adapted from Figs. 5 and 7 of Clausen et al. (2012)
Dependence of SAPS on solar wind and geomagnetic drivers
Since the deployment of TIG in 1999 and WAL in 2005 in the Southern and Northern Hemispheres, respectively, continuous observations at sub-auroral latitudes have been carried out, enabling the correlation of SAPS characteristics with solar wind and geomagnetic conditions to be examined. Several studies using SuperDARN data have identified SAPS characteristics which are basically consistent with those obtained with the Millstone Hill incoherent scatter radar (ISR) (Foster and Vo 2002; Erickson et al. 2011), namely, that SAPS tend to form more often, with faster flow speeds, and at lower latitudes with increasing geomagnetic activity level (Parkinson et al. 2005, 2006; Kataoka et al. 2009; Grocott et al. 2011; Kunduri et al. 2012; Nagano et al. 2015; Kunduri et al. 2017). These correlation characteristics strongly suggest that SAPS are closely controlled by solar wind conditions as well as by the ring current. A further examination by Grocott et al. (2011) showed that the latitudinal location of SAID varies on similar time scales to those of the interplanetary magnetic field and auroral activity, while variations in its flow speed are more closely related to ring current dynamics. These results are consistent with the idea that the poleward electric field of SAPS/SAID is caused by the shielding effect of the ring current coupled with the ionosphere through the Region 2 FAC system (Southwood and Wolf 1978).
Interhemispheric comparisons of SAPS
Several mid-latitude SuperDARN radars share conjugate FOVs between the Northern and Southern Hemispheres and, therefore, provide opportunities to examine interhemispheric conjugacy of the spatial and temporal characteristics of ionospheric convection. Conjugate characteristics of SAPS were studied by Parkinson et al. (2005) with KSR and TIG, whose FOVs were roughly conjugate to each other. Besides some small asymmetry between the hemispheres, the major variations of SAPS flow are shown to be quite similar, suggesting that the equipotential of geomagnetic field lines holds to the zeroth order. The same conclusions were drawn by similar studies but with a more closely conjugate set of radars (e.g., Kunduri et al. 2012). Grocott et al. (2011) also show excellent agreement in the latitude of a narrow SAPS channel observed by BKS and FIR, as seen in Fig. 13; however, differences in the width of the channel were also noted. Interestingly, a detailed inspection of SAPS characteristics by Kunduri et al. (2012) indicate that there is clear asymmetry in the ionospheric Pedersen current and electric field between the conjugate SAPS flows, while the estimated cross-SAPS electric potential drop showed consistent variations. These results suggest that SAPS are quite dynamic but controlled in such a way that the cross-SAPS potential difference stays constant between the two hemispheres despite the occasional significant differences in the details of the electrodynamics between the conjugate hemispheres.

Conjugate radar observations of a SAPS flow channel for two different periods showing excellent agreement in the latitude of the channel between BKS and FIR. Reproduced from Fig. 6 of Grocott et al. (2011)
Temporal dynamics of SAPS: Introduction
SuperDARN observations are characterized by high temporal resolution, the continuous nature of measurements, and large spatial coverage, which make them a formidable asset to study the longevity and the temporal evolution of SAPS-related phenomena at both large (up to 1000s of kilometer) and small (of the order of typical range-gate of the SuperDARN radar, i.e., 50 km). In the beginning, a recent statistical study by Kunduri et al. (2017) of the occurrence of SAPS is introduced. Analyzing 4 years of data from the US mid-latitude radars, they found that SAPS are observed at all levels of geomagnetic disturbance but with a dependence on disturbance level (characterized by Dst) such that quiet times have low occurrence rates (~ 10%) while storm times have very high rates (approaching 100%). The SAPS feature is often clearly defined against a background of lower latitude, low-velocity sub-auroral scatter.
Lifetime/longevity and seasonal dependence of SAPS
From SuperDARN observations at mid- and sub-auroral latitudes, a wide range of SAPS durations have been recorded, from a relatively short 30 min up to more than 6 h (Parkinson et al. 2003a, 2006; Koustov et al. 2006; Oksavik et al. 2006; Grocott et al. 2011), in agreement with studies based on other experimental facilities (e.g., Anderson et al. 1991, 2001; Foster and Vo 2002). A large fraction of these studies referred to substorm-time SAPS in its narrow and short form of PJ/SAID, while longer SAPS events were observed mostly by mid-latitude radars which are better suited for storm-time observations (Oksavik et al. 2006; Grocott et al. 2011).
In order to investigate possible seasonal trends in the occurrence and properties of SAPS, a statistical study was performed using observations of SAPS-like flows from the KSR radar (Koustov et al. 2006). This study shows that higher velocities occur over a larger MLT extent during winter months. The extent and magnitude of flows decrease through equinoctial and summer months. These results agree with the interhemispheric studies of SAPS by Kunduri et al. (2012) who show lower velocities are observed in the summer Northern Hemisphere (BKS and WAL observations) than in the winter Southern Hemisphere (FIR observations), but are in slight disagreement with another interhemispheric study by Parkinson et al. (2005), who show that summer Southern Hemisphere velocities (TIG) are slightly higher than in the winter Northern Hemisphere (KSR). To resolve the issue about seasonal dependence of SAPS strength and its controlling factors, a complementary statistical study with one or several mid-latitude radars would clearly be useful.
Evolution and variability of SAPS
Many SAPS events have been unambiguously related to substorm activity (e.g., Anderson et al. 1993). At large scales, a great deal of variability is observed during the course of SAPS lifetime, with latitudinal position, width, and flow velocity exhibiting significant variations with time (see Parkinson et al. 2006; Koustov et al. 2006; Oksavik et al. 2006; Makarevich and Dyson 2007; Kataoka et al. 2007; Ebihara et al. 2009; Makarevich et al. 2011; Clausen et al. 2012). Such variations are also clearly observed in the SAID structure whether embedded in SAPS or not (Oksavik et al. 2006; Grocott et al. 2011; Kunduri et al. 2012), with the observed thinning of the SAID being possibly related to a transition between successive events (Grocott et al. 2011). Moreover, Makarevich and Dyson (2007) and Clausen et al. (2012), thanks to extensive spatial coverage provided by several radars, also show that velocity intensifications inside SAPS are tremendously different with respect to longitude, as illustrated in the right panel of Fig. 12. In addition, Clausen et al. (2012) show that large-scale variations of SAPS speed are not accompanied by variations of SAPS flow direction which remain extremely stable throughout the course of the event at given longitudes.
SuperDARN observations of SAPS in conjunction with global auroral observations have demonstrated the important role played by auroral dynamics on the spatiotemporal evolution of SAPS. Makarevich et al. (2009) studied the temporal evolution of SAPS in the context of simultaneous auroral dynamics provided by the International Monitor for Auroral Geomagnetic Effects (IMAGE) spacecraft and clearly show that auroral dynamics affect the latitudinal position of the SAPS poleward boundary as well as the SAPS intensity, but not the SAID position. It is demonstrated that equatorward motion of the aurora can effectively compress the SAPS flow channel into its narrow SAID form while simultaneously strengthening it. Another effect of the auroral expansion and associated compression of the convection streamlines is an eastward “mirror” flow channel on the poleward side of the SAID. Furthermore, reconfiguration of the convection pattern during substorms results in the concurrent development of the Harang discontinuity and an intensification of SAPS, with strong coupling between them observed in most cases (Zou et al. 2009).
A significant fraction of SAPS events observed by SuperDARN have been associated with geomagnetic storms. Kataoka et al. (2007) and Ebihara et al. (2009) explain the dynamical character of the rapid westward flow observed in SAPS as a direct manifestation of spatiotemporal variations of plasma pressure in the inner magnetosphere and ring current during storms. Their results are based on the comparison with the numerical modeling of the inner magnetosphere. Figure 14 shows a comparison between the SuperDARN HOK observations of SAPS structure indicating temporal changes (top panel) with simulation results from the comprehensive ring current model (CRCM) under various boundary conditions (Ebihara et al. 2009). The middle panel shows the simulation result with the outer boundary condition determined by the energetic particle data of the Los Alamos National Laboratory (LANL) geosynchronous spacecraft while the bottom panel shows the simulation result with a fixed boundary condition (uniform and constant plasma density). These results clearly indicate the importance of ring current dynamics in controlling the SAPS spatial structure.

Range-Time-Parameter plots of the Doppler velocities observed by beam 7 of the Hokkaido East radar (a) and calculated using the CRCM numerical simulation with the plasma sheet boundary conditions determined by the LANL particle data (b) and with fixed boundary condition (c). Reproduced from Fig. 5 of Ebihara et al. (2009)
High temporal resolution (1-min) of SuperDARN measurements also enables observations of small-scale variability inside SAPS. Several studies have demonstrated the existence of strong flow pulsations during SAID periods (Parkinson et al. 2003a, 2005; Koustov et al. 2006; Oksavik et al. 2006; Koustov et al. 2008; Makarevich and Bristow 2014). These pulsations exist in the form of flow channels of extremely high westward velocity (between 1 and 2 km s−1) that are localized in latitude (~ 50–100 km) and have periods between 10 and 15 min (Parkinson et al. 2003a, 2005; Koustov et al. 2006; Oksavik et al. 2006; Koustov et al. 2008). Lower periods, down to 1–2 min, and hence higher frequencies (Makarevich and Bristow 2014) and higher velocities up to 4 km s−1 (Parkinson et al. 2003a) have also been observed. These structures appear close to the equatorial edge of SAPS and the ionospheric trough and generally propagate toward higher MLAT (Koustov et al. 2006; Makarevich and Bristow 2014). The cause of these pulsations has been attributed to ultra-low frequency (ULF) wave activity, as shown by a correlation with spectral width (Parkinson et al. 2005) or to SAPSWS activity (Mishin et al. 2003; Makarevich and Bristow 2014).
Occurrence frequency of SAPS and their dependence on substorm phase
As previously stated, SAPS are often closely related to substorm processes. Parkinson et al. (2006) have estimated the percentage occurrence rate of strong westward flows associated with SAPS-like feature of AWFC over 12 months of measurements from TIG and found a rate of about 40%. Yet, with only one radar covering SAPS longitudes for only 25% of the time due to the Earth’s rotation, they argued that the occurrence rate could be up to four times larger. The implication is that SAPS could be occurring almost every night, making it a recurrent sub-auroral process persisting for several substorm cycles (Makarevich and Dyson 2007; Koustov et al. 2008; Zou et al. 2009; Makarevich et al. 2009), but not necessarily observed due to a non-favorable radar location or propagation conditions. A comprehensive statistical study using the larger longitudinal coverage of the existing mid-latitude SuperDARN radars will reduce the speculation in these results.
Great attention has been given to relating SAPS onset and intensification to the different phases of the substorm process. Koustov et al. (2006) and Makarevich and Dyson (2007) have shown that SAPS generally appear or undergo a marked increase, if already present, between − 5 and + 60 min after a substorm onset, with the negative delay being due to a pre-existing substorm/SAPS event. Makarevich and Dyson (2007) examined several SAPS events seen simultaneously by TIG and TIGER Unwin radar (UNW) in conjunction with a substorm onset as seen by IMAGE, and conclude that the time delay between substorm onset and SAPS flow enhancement is likely due to the finite propagation time from the substorm injection location at substorm onset to the position of the radars. SAPS generally show a two-stage evolution, with initially relatively weak velocities followed by strong intensifications between 90 and 120 min after onset (Makarevich and Dyson 2007). This intensification phase starts, in general, at the end of the substorm expansion phase or during the recovery phase and ceases at the end of the recovery phase (Parkinson et al. 2003a, 2006; Koustov et al. 2006; Makarevich et al. 2009). The narrow SAID feature is more likely to occur during this later stage of SAPS evolution (Oksavik et al. 2006; Parkinson et al. 2006; Makarevich and Dyson 2007). SAPS are also observed during the main phase of storms when several successive substorms and associated auroral intensifications are observed (Grocott et al. 2011; Makarevich and Bristow 2014).
Implications for SAPS formation scenarios
Observations from SuperDARN radars, particularly at mid-latitudes, have been extremely beneficial in advancing our understanding of the underlying cause of SAPS. As explained in the previous subsections, the MI feedback process that is believed to play an important role in SAPS evolution implies that the sub-auroral electric field intensification should be accompanied by a decrease in the ionospheric electron density (e.g., Wolf et al. 2007). Makarevich et al. (2011) and Makarevich and Bristow (2014) exploited the continuous nature of SuperDARN observations by also examining simultaneous and continuous measurements of GPS TEC during a SAPS event. A general decrease of electron content inside SAPS during the first stage of weak SAPS evolution was seen, suggesting that the long-term variation of SAPS electron content is largely caused by a continuous depletion of ionospheric density and supporting the idea of the current generator scenario at large scales. On the other hand, an opposite trend was observed inside SAPS with an overall TEC increase during the second stage of SAPS evolution that is associated with SAID intensification and the appearance of SAPSWS (Fig. 15a from Makarevich and Bristow 2014). This important result was interpreted by Makarevich and Bristow (2014) in terms of cross-scale coupling occurring within SAPS, where net changes in ionospheric conductance and TEC are positive when SAPSWS activity exists and negative in the contrary. Finally, Kunduri et al. (2012) also showed that variations in SAPS peak velocity exhibited a moderate correlation with the ASY-H index indicating that local ionospheric conditions, such as the height-integrated Pedersen conductivity and thus electron density, may have an important influence on SAPS flow channel dynamics.

a CVW velocity versus universal time (UT) and magnetic latitude (MLAT) on 17 March 2013 between 1150 and 1340 UT and slant ranges 1035–1665 km. The propagation of SAPS Wavy Structure (SAPSWS) 1–4 is shown by yellow lines. The range coincident with Ionospheric Pierce Point (IPP) at 450 km between PRN 21 and Beaver Cove (BCOV) is shown by the pink line. b CVW velocity at IPP. The four periods with velocities < − 500 m s−1 are highlighted. c GPS TEC measurements at IPP. d Wavelet spectrum of CVW velocity at IPP. e Wavelet spectrum of GPS TEC. The colored dots show the three highest peaks for each spectrum. Reproduced from Fig. 3 of Makarevich and Bristow (2014)
Figure 15 illustrates some of the important features of the plasma velocity—electron density relationship within SAPS at short time scales (below 20 min) as presented by Makarevich and Bristow (2014) utilizing close conjunctions between the CVW and a GPS receiver at Beaver Cove (BCOV). Figure 15a illustrates a merging of flow channels with the SAID feature located westward and poleward (Makarevich and Bristow 2014). They show that each flow channel enhancement related to SAPSWS is associated with a simultaneous decrease in TEC, followed by a TEC increase outside of each flow channel (see panels b and c of Fig. 15). Wavelet spectra of CVW velocities and GPS TEC also exhibited strikingly similar variations (see panels d and e of Fig. 15), providing additional evidence for the ionospheric feedback instability scenario even at small scales.
In summary, continuous observations of SAPS by SuperDARN show that the evolution of SAPS is strongly controlled by the substorm onset location, prior time history including previous substorm cycles, concurrent auroral dynamics, MI, and cross-scale coupling processes. In the future, coordinated and distributed measurements will be central to further understanding the underlying causes of SAPS and SAID. By its continued expansion, the mid-latitude SuperDARN network will be ideally situated to contribute to this effort.
Transients
The distributed and continuous nature of SuperDARN observations are well suited for studying transient features observed in ionospheric convection. Even operating in the standard mode (stepping sequentially through each beam to cover the whole FOVs in 1 min) SuperDARN radars are able to resolve many of the spatiotemporal ambiguities that are often encountered in observations of transient events. Special experimental modes have also been developed to increase the temporal or spatial resolution of observations in order to study particular aspects of transient phenomena.
In addition to storm-time phenomena, such as the prompt penetration electric field (PPEF) associated with over/under-shielding, several other types of transient electric fields are observed by SuperDARN. These observations primarily occur in the high-latitude and polar cap regions owing to their origins in the solar wind and the favorable coupling on open magnetic field lines at higher latitudes. Studies of these transients include the response of large- and meso-scale convection to abrupt transitions in the IMF Bz (Ruohoniemi and Greenwald 1998; Shepherd et al. 1999; Milan et al. 2000; Nishitani et al. 2002; Fiori et al. 2012) and IMF By (Chisham et al. 2000; Senior et al. 2002) magnetic field components, the solar wind dynamic pressure (Boudouridis et al. 2007; Coco et al. 2008; Boudouridis et al. 2011; Gillies et al. 2012), and interplanetary shocks (e.g., Kane and Makarevich 2010). These studies show general agreement with a two-stage response consisting of a prompt initial perturbation in the convection velocity seen nearly simultaneously at all MLTs, followed by a slower reconfiguration of the large-scale convection pattern that progresses from the dayside to the nightside.
A particular transient in the solar wind dynamic pressure, known as a sudden impulse (SI), occurs under various IMF conditions and has been studied extensively with ground-based magnetometer networks. Observations show a large-scale twin-vortex and/or meso-scale pairs of traveling convection vortices (TCVs) associated with FACs resulting from a deformation of the magnetopause due to the abrupt change in the solar wind dynamic pressure (Araki 1977; Friis-Christensen et al. 1988; Glassmeier et al. 1989). High-latitude SuperDARN radars have observed TCVs (e.g., Thorolfsson et al. 2001) due to the contracted polar cap under northward IMF. In one event, Hori et al. (2012) showed the convection electric field associated with a TCV negative SI (and possible aftershocks) at high-latitude extending into the sub-auroral region. Effects of the passage of TCVs are also seen at mid-latitudes in ground scatter returns, as shown by Kim et al. (2012). Meanwhile, Hori et al. (2015) demonstrated using the high- and mid-latitude SuperDARN data that there is a dawn-dusk asymmetry of flow vortices as shown in statistical convection velocity perturbations, caused by IMF By polarity, which appears associated with negative SI events (dynamic pressure decrease) that is not seen for positive SI events. However, most of the observations were poleward of 60° MLAT, and all measurements were considered not just those associated with TCVs.
Other studies of transient convection phenomena include observations of bursty flows associated with dayside reconnection, such as flux-transfer events (FTEs) (Pinnock et al. 1993; Provan et al. 1998; Wild et al. 2001, 2003)—results mainly based on high-latitude SuperDARN observations—and on the nightside associated with substorm phenomena such as auroral beading, auroral streamers, and poleward boundary intensifications (PBIs) (Lyons et al. 2011; Gallardo-Lacourt et al. 2014a, 2014b; Lyons et al. 2015, 2016), with the latter studies demonstrating a connection between enhanced nightside polar cap flows and the triggering of PBIs, auroral streamers, and substorm onset, with associated SAPS and SAID flows.
Convection: Future directions
There are currently ten SuperDARN radars located equatorward of 50° MLAT in the Northern Hemisphere. The expansion of SuperDARN to mid-latitudes has been a demonstrated success with previously unattainable measurements of the convection electric field equatorward of ~ 60° MLAT and associated contributions to a variety of phenomena occurring at mid-latitudes. Plans are in place to build several more mid-latitude radars in the European and Asian sectors. These radars will provide critical measurements in these regions, enabling near-continuous monitoring of convection in the mid-latitude region and allowing several unanswered questions to be addressed, such as the statistical nature of SAPS occurrence and the origins of SAPS and SAID. The latter will benefit from more continuous observations at mid-latitudes but will also require complementary measurements of the electrodynamic parameters such as the electrical current and conductivity.
Another convection topic that mid-latitude SuperDARN will have a sizeable impact on is the specification of statistical convection patterns or convection maps. Several studies of the climatology of large-scale convection have been performed using SuperDARN observations. These studies bin the LOS radar data according to various combinations of the IMF magnitude, IMF clock angle, solar wind speed, and dipole tilt angle in order to obtain a global solution of the electrostatic potential that “best fits” the radar observations in each bin. As more radars became operational the statistics for any given bin increased, thereby improving the quality of the solutions and allowing for additional binning parameters or/and finer bin resolution. Ruohoniemi and Greenwald (1996) used data from only the GBR radar to construct the first set of statistical convection maps. Ruohoniemi and Greenwald (2005) then performed a similar analysis using the nine high-latitude SuperDARN radars available at that time. Pettigrew et al. (2010) re-analyzed the Northern Hemisphere, adding dipole tilt angle bins and separate model patterns produced using the Southern Hemisphere radars, in order to study the conjugacy between hemispheres. Finally, Cousins and Shepherd (2010) added solar wind velocity bins and the ability to interpolate between discrete patterns in order to achieve a more dynamical model of the large-scale convection in both hemispheres.
In all of these studies, data from only the high-latitude SuperDARN radars were used, resulting in limited data coverage in the polar cap and the mid-latitude region, particularly during geomagnetically active periods. A new statistical model has recently been developed that uses measurements from the polar cap and mid-latitude radars to complement the high-latitude radars (Thomas and Shepherd 2018). The resulting patterns reinforce what Baker et al. (2007) show in Fig. 9, namely that the addition of data from the mid-latitude radars has a dramatic effect on the overall convection strength, increasing the cross-polar cap potential by as much as 25% (40% in Thomas and Shepherd 2018), and markedly changing the potential contours on the nightside, where a region of westward flow extending from dusk (18 MLT) to past midnight (24 MLT) is observed equatorward of ~ 60° MLAT by the mid-latitude radars.
Ionospheric irregularities
The ionosphere is a weakly ionized plasma that is subject to structuring and plasma instability. The SuperDARN HF radar technique relies on the emergence of decameter-scale irregularities in the plasma density for generating coherent backscatter from the ionosphere. In this section, the findings to date on the occurrence, properties, and causes of the irregularities that are commonly observed at mid-latitudes by the SuperDARN radars are reviewed. As noted previously, the expansion of the auroral oval during disturbances can cause the mid-latitudes to be “auroral” in nature; hence, auroral-type irregularities fall within the scope of this review. Descending in latitude, irregularities are observed to map out features near the edge of the auroral oval, e.g., SAPS, while at lower latitudes one encounters categories of irregularities which are distinctly sub-auroral.
Introduction of ionospheric irregularities
At auroral latitudes, the ionosphere is impacted by electric fields and particle precipitation of magnetospheric origin. The resulting perturbations from the equilibrium state of the plasma, observable as bulk particle motions, density gradients, temperature gradients, etc., represent sources of free energy for triggering instability in the plasma (e.g., Fejer and Kelley 1980). Thermal fluctuations in electron density can be greatly amplified to produce the ionization irregularities that represent viable targets for backscattering with low-power HF coherent scatter radars. Given the nearly continuous excitation that is due to auroral processes, it is no surprise that ionization irregularities are a nearly ubiquitous feature of the auroral ionosphere. The early SuperDARN radars were sited approximately along an arc of 60° MLAT in order to look into the auroral region and sense these irregularities.
When the first radar specifically intended for making observations in the mid-latitude ionosphere was proposed for the WAL site, the primary scientific motivation was to enable observations of the expansion of auroral effects during geomagnetic storms, leading to the term “StormDARN.” It was not apparent that the sub-auroral ionosphere, defined as that region lying equatorward of the electron precipitation boundary, would provide extensive irregularity targets. In fact, a category of irregularities responsible for low-velocity backscatter was found to populate the nighttime sub-auroral ionosphere (Greenwald et al. 2006). Evidently, there are sources of plasma instability for generating irregularities with ample backscattering cross sections in an ionosphere that is markedly less structured and dynamic than in the auroral regions. The term “StormDARN” has now been rendered obsolete by the attention given to the non-storm categories of mid-latitude backscatter. Indeed, HOK, which is sited at the lowest MLAT of any SuperDARN radar, observes irregularities that are so far removed from contact with auroral processes (equatorward of the electron precipitation boundary (EPB) by more than 10°) that it seemed appropriate to categorize them separately as temperate mid-latitude irregularities.
Table 2 summarizes the categories of mid-latitude irregularities for the purposes of this review. It should be noted that the position of the electron precipitation boundary (i.e., the auroral boundary) is key to these definitions as a fixed MLAT may at different times correspond to the auroral zone, the equatorward boundary zone (with SAPS), or to the sub-auroral region, with pronounced differences for the physics of the ionosphere and the occurrence of irregularities.
Auroral irregularities
During quiet geomagnetic conditions, the equatorward edge of the auroral oval reaches as low as 60° MLAT on the nightside. The ground range to the edge of the quiet-time oval on the nightside is around 1200 km for the US mid-latitude radars and around 2500 km for the Hokkaido Pair of Radars (HOP). It is routine for the radars to generate ionospheric scatter at the shorter ground range and relatively frequent at the longer ground range. Consequently, the mid-latitude SuperDARN radars do observe backscatter from auroral irregularities even under non-storm conditions but any activity observed within the oval is then likely due to propagation modes that are less favorable for analysis than the half-hop mode. When there is significant geomagnetic disturbance and the oval expands equatorward, the mid-latitude radars encounter the oval at nearer ranges and, under the most disturbed conditions (Kp > 7 for the U.S. radars), the equatorward edge of the oval reaches to the near-range boundary of the radar FOVs. The radar observations are then dominated by backscatter from auroral irregularities. To date, there has not been an expansion event so extreme that the oval boundary has reached to the near-range boundary of the HOP radars, which are located at the lowest MLAT among the SuperDARN radars. It is noteworthy that the expansion that occurred for the historically extreme event of March 1989 would have reached well beyond the near-range boundary of the HOP radars (Rich and Denig 1992).
The earliest work on the occurrence of irregularities at mid-latitudes was reported with radars in the Southern Hemisphere. With MLATs near 55° S TIG and UNW reach into the auroral zone on the nightside at moderate ground ranges (~ 600 km), consequently, their observations routinely encompass both the sub-auroral and auroral regions. Parkinson et al. (2003b) produced maps of the occurrence of backscatter from TIG observed over 1-year near solar cycle maximum and ordered by Kp. Comparing with model auroral boundaries, they determined that the bulk of the backscatter originated from within the oval although categories of both polar cap and sub-auroral backscatter were also identified, as shown in Fig. 16 (Parkinson et al. 2003b). In particular, they noticed a high-velocity feature at the equatorward edge of the oval in pre-midnight hours that would be later attributed to backscatter from SAPS. F region echoes were found to be most frequent in autumn while E region echo occurrence peaks in winter and summer.

The occurrence rate (%) of ionospheric echoes from beam 4 of TIG detected during all seasons, and sorted according to geomagnetic activity Kp > 1 to 2; Kp > 3 to 4 and Kp > 5 to 6. Model auroral oval boundaries are superimposed for AL = − 64 nT (Kp = 2−), AL = − 240 nT (Kp = 4−), and AL = − 458 nT (Kp = 6−). Adapted from Fig. 5 of Parkinson et al. (2003b)
Subsequent work in the Southern Hemisphere using TIG and UNW focused on E region backscatter usually defined as having been collected from ranges less than about 600 km. Using 3 years of data, Carter and Makarevich (2009) found a primary occurrence peak for backscatter in the mid-morning sector (7–8 MLT) and a secondary peak in the pre-midnight sector (20–23 MLT) for higher Kp values. There was evidence that the occurrence of the evening echoes was more conditioned by the magnetic aspect geometry owing to limited refraction due to low E region densities during disturbances. They reported two categories of echoes, one with low velocities and no connection between velocity magnitude and spectral width and a second, more apparent during storms, with higher velocities and a clear dependence of spectral width on velocity magnitude. The difference in backscatter properties is almost certainly due to the appearance of auroral irregularities within the designated range interval as the oval expands.
Carter and Makarevich (2010) extended the study of E region backscatter to cover a total of 15 radars over the same 3-year period. As the bulk of the radars operate at high latitudes, the contrasts with TIG were illuminating. TIG had peak occurrence at 7–8 MLT under quiet conditions while the high-latitude radars had a broad occurrence peak extending across the nightside with a preference for conditions of moderate disturbance. The occurrence rate fell off steeply for TIG for Kp > 5. The E region echoes observed by TIG at sub-auroral latitudes showed a fundamental difference from the higher latitude radars in terms of their diurnal variation and its dependence on disturbance level. The implication is that storm-time irregularities at nominally sub-auroral latitudes differ significantly from high-latitude auroral irregularities.
Ponomarenko et al. (2016) reported on very near-range echoes (< 300 km) seen with mid-latitude radars. They identified meteor scatter, which peaks in the early morning hours, and a new category of summer daytime echoes hypothesized to be due to neutral turbulence in the lower E region. In addition, they identified an evening E region echo associated with the auroral region which they attributed to precipitating energetic particles and strong electric fields. One notes that this activity must be associated with very high levels of disturbance in order to have auroral effects projected to such low latitudes. It was also speculated that the high-aspect angle region (HAIR) echoes (Milan et al. 2004), previously reported at sub-auroral latitudes (Carter and Makarevich 2009) and polar cap latitudes, might contribute to a surprisingly wide variety of near-range echo types.
In summary, because of the long-range nature of HF propagation, SuperDARN radars at mid-latitudes can observe backscatter from auroral irregularities even under quiet geomagnetic conditions, albeit at ranges that are less favorable for study than is the case for high-latitude radars. The more interesting applications of the mid-latitude radars are (i) to observe and characterize the storm-time auroral irregularities at mid-latitudes and their impacts on regions that are usually sub-auroral and (ii) to compare the infrequent mid-latitude auroral irregularities with the commonly occurring high-latitude auroral irregularities to see if differences in geomagnetic inclination, density distribution, preconditioning of the ionosphere-thermosphere system, etc. affect the conditions for ionospheric plasma instability and irregularity formation. The work to date has demonstrated that the nature of the backscattering changes when the oval expands and auroral irregularities begin to appear in the nearer ranges of the radars. Some results on E region auroral irregularities have been obtained from the observations in the Southern Hemisphere. There is still clearly much to do, especially for F region irregularities. An example of a promising direction is to relate the occurrence of storm-time irregularities to scintillations on GNSS signal. Another is to conduct joint observations with mid-latitude incoherent scatter radar to obtain the necessary plasma diagnostics to determine whether the irregularity types and instability mechanisms that have been studied at high latitudes can account for the mid-latitude irregularities.
SAPS irregularities
Descending in latitude from the auroral zone, the electron precipitation boundary is encountered and sets the location of the equatorward auroral boundary. Within the vicinity of this boundary, a distinctive convection feature is often observed, the SAPS. SAPS is characterized by high westward velocity (hundreds to thousands of meter per second), a narrow extent in latitude (a few degrees), and extension in the east-west direction of thousands of kilometers. It is believed to be associated with an equatorward displacement of the ion precipitation boundary from the electron precipitation boundary, whence it earns its designation as sub-auroral. However, it is quite clearly associated with the auroral boundary and its physical nature is so distinct from both higher auroral latitudes and lower sub-auroral latitudes as to be considered a distinct category for the purpose of discussing irregularities and their properties. A detailed treatment of SAPS as observed by the mid-latitude SuperDARN radars is given in the “Convection” section; here, the implications for understanding this category of mid-latitude irregularities are briefly reconsidered.
It appears that SAPS produce small-scale irregularities and that propagation conditions under normal conditions do not seriously limit their detection, at least for the US mid-latitude radars. The SAPS flow channel is associated with the mid-latitude trough, as was seen clearly in the example presented by Clausen et al. (2012) using TEC data. Thus, both large electric fields and steep density gradients are available during SAPS events to destabilize the plasma and generate irregularities. An obvious candidate mechanism is the gradient drift instability (GDI). At F region altitudes, this instability has a positive growth rate if the plasma drift has a component in the direction of the density gradient. The nominal combination of westward SAPS flow and poleward orientation of the poleward wall of the trough would not seem favorable. However, a careful examination of actual events might reveal a small but sufficient degree of alignment.
In summary, the SAPS phenomenon is critical for our understanding of magnetosphere-ionosphere-thermosphere coupling. It is a well-defined, repeatable, and somewhat predictable feature of the ionosphere particularly under disturbed conditions. The high visibility of SAPS to HF coherent scatter radar must be due to the self-generation of small-scale irregularities. Determining the instability mechanism responsible would represent a significant advance for our understanding of plasma instability and attract the attention of a wider plasma physics community. More joint studies with systems that can provide diagnostic measurements (Low Earth Orbit (LEO) satellites, Incoherent Scatter Radars (ISRs)) should be sought, and a challenge could be issued to ionospheric modelers to reproduce the full spectrum of SAPS-related effects, including the occurrence of small-scale irregularities in the mid-latitude SuperDARN radar observations.
Sub-auroral irregularities
The region of the ionosphere that extends equatorward of the electron precipitation boundary is conjugate to the inner magnetosphere and lacks obvious strong sources of electric field. Studies with ISRs have revealed the existence of 1–2 mV m−1 electric fields corresponding to drifts measured in tens of meters per second. No significant particle precipitation occurs at these latitudes, and so the ionospheric density distribution is far less subject to structuring and the formation of density gradients. These conditions would seem unpromising for the onset of plasma instability leading to irregularities especially at the decameter-scale lengths necessary for generating HF coherent backscatter. Nonetheless, from the earliest observations with the first purpose-built mid-latitude radar (WAL), it was clear that the nightside sub-auroral ionosphere often generates backscatter (Greenwald et al. 2006). The activity persists for hours at a time and is associated with low Doppler velocities. The Greenwald et al. (2006) study utilized complementary observations with the Millstone Hill ISR to argue that the irregularities could be due to, or enhanced by, the temperature gradient instability (TGI) which requires oppositely directed electron density and electron temperature gradients. Figure 17 (Greenwald et al. 2006) shows the intensification of backscatter on a beam of WAL that was directed toward Millstone Hill that followed a reversal in the electron temperature gradient in the F region ionosphere at the time indicated. This event was re-examined by de Larquier et al. (2014). By taking account of the substantial tilt of the mid-latitude geomagnetic field lines, they determined that the TGI growth conditions were in fact satisfied in the F region for the duration of the experiment. They attributed the weakness of the earlier activity to the shorting effect of daytime E region conductivity. A companion paper by Eltrass et al. (2014) examined the source of the irregularities during this event in terms of first-principles plasma physics. They developed the kinetic dispersion relations for the TGI and the GDI in the frequency regime of the SuperDARN radars and solved for the growth rates in both the meridional and perpendicular directions. They determined that the growth rate for the TGI was much higher than that of the GDI throughout the event. It was suggested that instability in the topside F region leads to growth of kilometer-scale irregularities that mapped via their electric fields to lower altitudes and populated the F region with smaller-scale irregularities through a process of cascading. This series of papers culminated in a study by Eltrass et al. (2016) that carried the earlier analysis into the nonlinear (saturation) regime by applying a gyrokinetic simulation model involving particle-in-cell (PIC) calculations with Monte Carlo collisions. They found that conditions were favorable for linear growth in the kilometer-scale regime and turbulent cascade to decameter-scale irregularities in the saturation stage. Analysis of GPS scintillation data revealed a spectral index n, where the density perturbations δN can be represented by a power law of wavenumber k−n, of about 2 for the mid-latitude irregularities with scale sizes less than a few kilometers.

The association of quiet-time sub-auroral irregularities with gradients in ionospheric electron density and temperature. The top panel shows time series of the electron density and electron temperature gradients measured by the Millstone Hill incoherent scatter radar. The pink triangle marks the time that the gradient in electron temperature reversed from poleward to equatorward, establishing favorable conditions for the TGI. The bottom panel shows a time series of backscatter power from one beam of the Wallops radar and the increase in backscatter power that followed the reversal. Adapted from Fig. 1 of Greenwald et al. (2006)
Sub-auroral ionospheric backscatter was initially confused with ground scatter because of its low velocities and narrow spectral widths. The algorithm that had been developed at high latitudes for distinguishing between the two types of backscatter in routine work was found to be inadequate. Ribeiro et al. (2011) developed a new technique based on a “depth first search” method of identifying discrete events and their start and stop times and the locations of their boundaries in range (see the “Propagation analysis: backscatter classification and geolocation” subsection for details). These authors also coined the expression sub-auroral ionospheric scatter (SAIS) to identify this type of activity. Ribeiro et al. (2012) applied the technique to several years of observations with BKS and found that SAIS is confined to local nighttime and occurs on about 70% of nights. The absence of SAIS during sunlight was attributed to the shorting effect of a conducting E layer.
de Larquier et al. (2013) performed a study of the altitude of the irregularities causing SAIS using well-calibrated elevation angle data from BKS. They found that the primary source region extends between 200 and 300 km in altitude, i.e., occupies the bottomside F region. Figure 18 shows an example of the variation of the altitude of SAIS irregularities with range from a radar (de Larquier et al. 2013). It was determined that the spatial distribution of SAIS backscatter within radar scans is primarily a function of propagation conditions and magnetic aspect geometry implying that the irregularities are widely distributed in the horizontal dimension.

Observations of the altitude of the irregularities associated with SAIS from beam 12 of the Blackstone radar near local midnight on 18 November 2010. The two solid curves mark the region where the magnetic aspect angle is within 1° of perpendicularity. Reproduced from Fig. 7 of de Larquier et al. (2013)
In the Southern Hemisphere, the statistical study of the occurrence of backscatter with TIG reported by Kane et al. (2012) is relevant to this discussion of sub-auroral irregularities. They found a decrease in quiet-time F region backscatter when the Pedersen conductance modeled on the basis of IRI is high, as shown in Fig. 19. This finding is a convincing demonstration of the shorting effect of a conducting E layer on the occurrence of small-scale mid-latitude F region irregularities.

Daytime TIG echo occurrence versus Pedersen conductance from the IRI model. Each point is color coded according to the corresponding value of the F region peak density NmF2, with the scale shown on the right. Reproduced from Fig. 5 of Kane et al. (2012)
Ruohoniemi et al. (1988) described GBR radar observations of a sub-auroral backscatter feature that regularly occurs near dusk. Subsequently, the topic was treated comprehensively over many radars and the backscatter named by Hosokawa et al. (2001) as dusk scatter event (DUSE). Hosokawa and Nishitani (2010) applied HOK and KSR data to determine that the center of DUSE corresponds to the minimum of a modeled trough, indicating an association with the poleward wall of the trough. Once again, the strong density gradient in the poleward wall of the trough is thought to play a role in generating irregularities.
In summary, the occurrence of coherent backscatter using the mid-latitude radars from latitudes equatorward of the equatorward edge of the auroral oval is now well-established. One category, namely SAIS, is a prominent feature of the nightside observations. It is characterized by low Doppler velocities and small spectral widths such that care must be exercised to discriminate it from ground scatter. A number of observational results indicate that the conducting E layer during the day suppresses the occurrence of F region irregularities. Theoretical work has demonstrated that the TGI and GDI combined with turbulent cascade can account for SAIS. More varieties of sub-auroral backscatter have been reported. It is noted that the sub-auroral ionosphere has advantages over the high-latitude ionosphere for resolving the background plasma parameters with sufficient confidence and precision to test ideas of plasma instability. One research direction would be to model on first principles the shorting effect of E region conductivity. Another would be to adapt the modeling work performed on SAIS events to routinely account for the occurrence or non-occurrence of SAIS.
Temperate mid-latitude irregularities
The SuperDARN radars on Hokkaido are located at ~ 37° N MLAT which is more than 10° lower than the latitudes of the US mid-latitude radars. This difference is comparable to that between the auroral and US radars. Consequently, it seems appropriate to allow for the possibility of significant variations between the “higher” sub-auroral latitudes and the “lower” sub-auroral latitudes observed by the HOP radars. The irregularities encountered routinely in HOK/HKW observations are designated as temperate mid-latitude in type.
Ogawa et al. (2009) described backscatter from the E and F regions on the nightside that is associated with the passage of medium-scale traveling ionospheric disturbances (MSTIDs) through the radar FOV. Figure 20 shows an example. The MSTIDs were found to be propagating in southeast/southwest directions with phase speeds of 120–170 m s−1 and horizontal wavelengths of 300–600 km. Some activity showed a clear linkage between F region Doppler velocity variations and alternations in power visible as striations in time-range plots. The F region observations were interpreted in terms of E × B instability at the bottom of the F region where the background electric field is modulated by the polarization field generated through interaction of the MSTID-induced neutral wind with the ionospheric plasma as explained in detail in Suzuki et al. (2009). It was conjectured that the E region echoes could be attributed to electrical coupling of the E and F regions. Suzuki et al. (2009) examined a similar event with a southwest propagating MSTID with a phase speed of 100 m s−1 and a horizontal wavelength of 300 km. The alternations in Doppler velocity reached magnitudes of 50–60 m s−1. Airglow data were consistent with the radar observations of striations, propagation, and speed. The observations were interpreted in terms of the GDI acting at the base of the F layer with an eastward component of the electric field. A schematic for the instability is shown in Fig. 21 (Suzuki et al. 2009). The total electric field consists of the F region dynamo field, E0, and the u × B component generated by the background thermospheric winds. Modulation of u by the neutral gas motions generated by MSTIDs generates polarization electric fields parallel or antiparallel to the propagation directions. The alternating polarization fields, through E × B drifts, cause variations in the Doppler shifts with opposite signs for the enhanced/depleted echo power, which also vary due to modulation of the GDI.

Keograms from the Hokkaido radar of a radar echo power on beam 15 and airglow intensity deviation and b Doppler velocity and c airglow intensity deviation on beam 15 and 10 on 11 June 2007. Trace velocities indicated by red lines with numbers 1–4 and number 5 are 120 and 90 m s−1, respectively, and those indicated by black lines with numbers 1–4 and number 5 are 240 and 180 m s−1, respectively. Reproduced from Fig. 12 of Ogawa et al. (2009)

Schematic interpretation of the optical and radar events observed on 8 December 2007 by the Hokkaido radar. The dark gray and light gray shaded regions represent the depletions and enhancements, respectively in the 630-nm airglow intensity. Reproduced from Fig. 4 of Suzuki et al. (2009)
Koustov et al. (2014) made a statistical study of the HF radar signatures of nighttime MSTIDs at near ranges corresponding to E region backscatter. They found a reversal in the sense of propagation through midnight from southward-southwestward (toward the radar) to northward-northeastward (away from the radar). The average speeds for the two categories are 85 m s−1 and 56 m s−1, respectively. The progression in phase fronts is apparent in both the velocity and backscattered power data and amplitude and velocity are linearly related. The MSTID motion is attributed to gravity waves propagating through the radar FOV. It is speculated that neutral turbulence plays a role in generating the E region backscatter during the events.
Yakymenko et al. (2015) studied the statistical characteristics of short-range echoes observed by HOK generally. Echo occurrence increases at night, and there is a category of backscatter that occurs in summer in the morning-prenoon sector that can be associated with sporadic E layers. The irregularities are attributed to the GDI. Echo occurrence does not depend on Kp or Dst but is anti-correlated with the Ap index indicating that local factors and not high-latitude drivers are responsible for the onset of irregularities. The authors suggest that a significant number of these echoes are generated at rather high magnetic aspect angles of several degrees. They argue that non-GDI mechanisms such as neutral turbulence must account for the appearance of irregularities that are not strongly magnetic field aligned. The passage of MSTIDs and the onset of meridional winds are also proposed as generators of ionospheric irregularities.
In summary, the most-studied type of temperate mid-latitude irregularity is that associated with the passage of nighttime MSTIDs. Both Doppler velocity and backscattered power are well ordered by wave characteristics. There has been some success in attributing the formation and properties of the F region irregularities to the GDI with modification of the ionosphere by polarization fields that are due to MSTID-induced neutral winds. A variety of echo types is seen at near ranges and neutral winds, either through turbulence or passage of MSTIDs, are thought to play a significant role in the generation of E region irregularities. Two directions for future research are (i) comparison with observations of MSTIDs and their relation to irregularity formation at higher latitudes and, (ii) modeling of the ionospheric physics to account for the generation of irregularities and the properties of the backscatter during these events.
HF propagation analysis
One avenue of research that has matured significantly since the advent of mid-latitude SuperDARN is the use of HF propagation analysis for value-added research. These studies have built upon previous efforts at high latitudes which used propagation analysis to investigate ionospheric irregularities (e.g., Milan and Lester 2001), meteor echoes (e.g., Hall et al. 1997), and traveling ionospheric disturbances (TIDs) (e.g., Bristow et al. 1996). Propagation analysis has several distinct advantages at mid-latitudes, which are summarized in this section, along with some of the key research results.
Introduction of HF propagation analysis
HF propagation analysis can be broadly defined as any attempt to precisely determine the refractive pathways (or “modes”) connecting an HF radar to its backscatter targets. At relatively close-ranges, the propagation path tends to be quasi-linear and thus specified completely by the slant range and angle of arrival measurements. However, as the range to the target increases, accurate specification of the propagation mode becomes increasingly more ambiguous because the amount of ionospheric refraction depends on the electron density which is a highly variable function of altitude, latitude, LT, and geomagnetic conditions. For this reason, propagation analysis at ranges beyond a few hundred kilometers is typically done using simulations from an HF ray-tracing code (e.g., Jones and Stephenson 1975) coupled with an empirical ionosphere model such as IRI (e.g., Bilitza et al. 2014).
The over-arching purpose of propagation analysis tends to fall into three broad categories: (1) backscatter classification and geolocation, (2) ionospheric morphology and dynamics, and (3) radar performance assessment and calibration. The studies reviewed in this section are therefore categorized under these three subsection headings. To minimize overlap with other sections, the focus of the discussion here is primarily on how propagation analysis has been used as a tool to improve a methodology and/or scientific interpretation of radar data.
Propagation analysis: Backscatter classification and geolocation
A central challenge of SuperDARN data analysis has always been how best to distinguish ground scatter from ionospheric scatter. Traditionally, ground scatter has been identified by applying lower thresholds of a few tens of meter per second on both the LOS velocity and spectral width (Blanchard et al. 2009). This simple approach has worked reasonably well at high latitudes because the ionospheric plasma tends to move at speeds of a few hundreds of meter per second, and is thus more easily distinguishable from the ground, in most situations. At mid-latitudes, however, typical convection speeds are much lower and comparable to the magnitude of Doppler velocity fluctuations expected for ground scatter in the presence of dynamic ionospheric modulations, such as TIDs. To overcome this ambiguity, Ribeiro et al. (2011) presented a new algorithm for distinguishing ground and ionospheric scatter by identifying closed groupings of connected scatter points and assigning the propagation mode based on characteristics of data clusters as a whole, rather than point-by-point. Figure 22 compares the results of the traditional method (top) with the new method (bottom) for 24 h of BKS data on 15–16 January 2010 (Ribeiro et al. 2011). Ionospheric scatter is colored according to the scale on the right while ground scatter is shaded gray. Local sunrise is at ~ 13 UT so the left and right portions correspond to night and day, respectively. The lower panel shows the new algorithm produces a much more sensible classification in which there is a clear separation between bands of low-velocity ionospheric scatter during the night and ground scatter during the day. This slow-moving nighttime scatter is now called SAIS.

Classification of LOS Doppler velocities from beam-7 of the Blackstone radar on 15 January 2010 according to a the traditional point-by-point threshold method (top) and b the new clustering method (bottom). Ionospheric scatter is colored according to the scale at right while ground scatter is shaded gray. Reproduced from Fig. 3 of Ribeiro et al. (2011)
Elevation angle data are particularly important for accurate geolocation and distinguishing various sources of backscatter. Greenwald et al. (2017) found estimates of ground range and refractive index using virtual height models are rarely consistent with results from ray tracing. Ponomarenko et al. (2016) used elevation angle data to determine near-range echoes at mid-latitudes measured by CVE and TIG. In the early morning sector, these near-range echoes were found most likely to be meteor backscatter, whereas those near local noon during midsummer were either PMSEs or produced by lower E region neutral turbulence. In some cases, particularly statistical studies, the propagation conditions can sometimes be inferred from the context of the radar measurements themselves. For example, Parkinson et al. (2003b) examined the occurrence of irregularities observed by TIG over a broad range of latitudes and found, among other things, that nightside echoes were typically observed via 1.5-hop propagation near dusk and then via 0.5-hop propagation from pre-midnight to dawn.
Other studies have examined the extent to which radar detection of ionospheric backscatter depends on the occurrence of irregularities versus HF propagation conditions. For example, Kumar et al. (2011) found the range-time evolution of F region ionospheric backscatter measured by TIG during disturbed periods was partly dependent on changes in propagation conditions associated with enhanced E and F region densities. Likewise, Kane et al. (2012) found irregularity backscatter occurrence measured by TIG during geomagnetically quiet times was most likely controlled directly by the ionospheric density during nighttime but by both density and propagation conditions during the day.
Finally, using HF propagation analysis for accurate backscatter classification and geolocation can be an important component of mid-latitude SuperDARN applications totally unrelated to space science. For example, Greenwood et al. (2011) used data from TIG and UNW to show SuperDARN radars can remotely monitor ocean wind-wave directions from Bragg peaks in one or two hop sea scatters. The dominant wind-wave direction is inferred by constraining a model of the directional sea spectrum to the ratio of the two Bragg peaks. Good agreement was found with the WAve Model (Bender and Leslie 1994), on average, but with the radar observations exhibiting far more spatial variability and structure.
Propagation analysis: Ionospheric morphology and dynamics
The second broad objective of HF propagation analysis is to use radar measurements to identify perturbations in the intervening ionospheric medium, such as seasonal anomalies, storm-time effects, or TIDs. For example, de Larquier et al. (2011) used ray-tracing analysis to identify an anomaly in mid-latitude evening ground scatter measurements such that ground scatter range decreased around sunset, rather than increased, as might be expected. Millstone Hill ISR data confirmed that the anomalous behavior measured by BKS on one particular night was associated with elevated electron densities (see Fig. 23 from de Larquier et al. 2011). Statistical analysis showed the anomaly is most pronounced from April to September (i.e., summer). Analysis with the Horizontal Wind Model (HWM07) (Drob et al. 2008) suggests it is produced by equatorward meridional winds pushing lower layers of the ionosphere up geomagnetic field lines to higher altitude where recombination is slower. A later study by Milan et al. (2013) found a similar effect in FIR radar ground scatter and associated it with the Weddell Sea Anomaly (WSA) (Horvath and Essex 2003).

Observations of the mid-latitude evening anomaly on 13 August 2010 seen in a Blackstone radar beam-7 backscattered power and b Millstone Hill ISR electron density versus altitude. Dashed lines identify solar noon and sunset. Reproduced from Fig. 5 of de Larquier et al. (2011)
SuperDARN radars can also be used to monitor ionospheric conditions in real time, as “oblique ionosondes.” This capability was first demonstrated at high latitudes by Hughes et al. (2002) by utilizing a special “sounding-mode” of radar operation to determine the maximum usable frequency (MUF) and F2-layer critical frequency (f0F2) using variations in F region ground scatter skip distance as a function of frequency. This result was followed by Bland et al. (2014) who used TIG and UNW data to show the technique is particularly well suited at mid-latitudes because the higher ionospheric densities mean that ground scatter echoes tend to dominate over ionospheric echoes. Figure 24 shows the technique produces good agreement with the nearby ionosonde at Macquarie Island (Bland et al. 2014). However, propagation conditions play an important role because the technique was found to be much less effective in winter months and away from solar maximum when the 1-hop F region ground scatter is less distinct and harder to isolate. These problems can be overcome by using elevation angle measurements to better discriminate E and F region ground scatter, as well as identify contamination from low-velocity ionospheric scatter (i.e., SAIS) and ground scatter originating from the back lobe (Milan et al. 1997b).

Diurnal variation of foF2 for 12–13 September 2010 calculated from Bruny Island radar data (black), Unwin radar data (red), and Macquarie Island ionosonde (blue). Reproduced from Fig. 4 of Bland et al. (2014)
Other studies have used perturbations in HF propagation conditions to infer the spatiotemporal response of ionospheric density to intense space weather disturbances. For example, Currie et al. (2016) used superposed epoch analysis to examine the range dependence of backscatter observed by TIG and Kodiak radar (KOD) during 25 intense geomagnetic storms and found a reduction in backscatter for middle to far ranges but an increase at close ranges. Peaks in absorption from a nearby riometer showed no effect on the close-range backscatter suggesting that this result cannot be explained by D region absorption. Instead, ray-tracing analysis suggested enhanced E region density can over-refract middle- to low-elevation rays so they do not reach the F region.
Watanabe and Nishitani (2013) examined how the ionosphere responds to solar flare events by analyzing variations in the propagation conditions inferred from HOK data. Most flares produced a sudden fade-out of ground scatter echoes, consistent with increased ionization, but they also found positive Doppler shifts in the ground scatter just before fade-out which were negatively correlated with elevation angle. This behavior is consistent with increased D region electron density being the most dominant factor during fade-out events, rather than a lowering of reflection height due to increased F region density. The space weather impacts of solar flares and SuperDARN were also studied using multiple radar data in the recent literature (e.g., Berngardt et al. 2018; Chakraborty et al. 2018; Fiori et al. 2018).
Propagation analysis: Radar performance assessment and calibration
One reason why propagation analysis has been an under-utilized tool within the SuperDARN community is the elevation angle data collected at most radars is not routinely calibrated and therefore tends to be unreliable. Proper calibration requires measuring the phase offset between signals returning to the main and secondary antenna arrays, which is not trivial, and its value tends to drift over time. However, Ponomarenko et al. (2015) developed an empirical method for calibrating angle of arrival data using the contextual information provided within the data itself. Specifically, the phase offset is adjusted so that the elevation angles decrease with range in continuous bands of ground scatter data, as expected (see Fig. 25 from Ponomarenko et al. 2015). Such calibration adjustments are necessary after each radar hardware/software update but also desirable on a routine basis because of gradual changes in the physical properties of antennas, cables, and electric circuitry.

Range-Time-Parameter plots of elevation angle for beam 7 of the HOK data at 06–12 UT on 23 February 2014 for: uncalibrated (top) and calibrated data (bottom). Adapted from Fig. 6 of Ponomarenko et al. (2015)
Statistical comparisons between radar data and simulations using propagation analysis can also be useful for identifying deficiencies in standard SuperDARN data processing. For example, Oinats et al. (2016b) compared 1-hop ground scatter measurements from HOK with simulated data to examine the accuracy of SuperDARN echo geolocation. They found that assuming a fixed virtual height produces a systematic error in geolocation which has a strong dependence on LT, season, and solar activity level. They also found contamination of backscatter from the back lobe can be as high as 35% and tends to be most problematic in winter and equinox.
Finally, ray tracing can also be a useful tool for demonstrating proof-of-concept for proposed new radar construction. For example, Nishitani and Ogawa (2005) used the Jones-Stephenson ray-tracing code coupled with the IRI and IGRF models to identify regions where the then-proposed HOK would most likely measure backscatter from ionospheric irregularities. Figure 26 from Nishitani and Ogawa (2005) shows the results for nighttime quiet geomagnetic conditions at 9, 11, and 13 MHz with X indicating potential irregularity backscatter locations (i.e., ≤ 1° aspect angle). They were able to conclude that the proposed radar would collect more than enough data to be useful as a facility for analyzing mid-latitude ionospheric irregularities.

Ray-tracing analysis (solid curves) and expected locations for ionospheric irregularity backscatter occurrence (asterisks) for HOK during nighttime quiet geomagnetic conditions and transmission frequencies of (top to bottom) 9, 11, and 13 MHz, respectively. Adapted from Fig. 3 of Nishitani and Ogawa (2005)
Propagation analysis: Summary and future directions
In this subsection, it has been demonstrated how HF propagation analysis can be used to conduct value-added ionospheric research at mid-latitudes and assess radar performance. The mid-latitude ionosphere provides a much simpler propagation environment than at higher latitudes, so convergence between measurements and simulated data using ionospheric models is much more likely. For this reason, small model-data disagreements can often be interpreted in terms of anomalous ionospheric behavior, deficiencies in model specification, or issues of radar performance.
Looking forward, there is scope for continued use of propagation analysis to further refine our understanding of mid-latitude ionospheric plasma morphology and irregularities. Two specific topics that deserve further examination are solar cycle effects and interhemispheric influences. However, such efforts will require reliable elevation angle information. Shepherd (2017) described an algorithm for determining elevation angle data using interferometer arrays offset from the main array in three dimensions, rather than one or two, thus providing more flexibility in the positioning of interferometer arrays for future radars.
Finally, it is worth noting that further development and refinement of propagation analysis has the potential to vastly expand SuperDARN’s capabilities as an asset for real-time space weather monitoring, beyond just specification of the ionospheric convection electric field. Specifically, a comprehensive multi-radar dataset of backscattered power measurements combined with fully calibrated elevation angle data could conceivably be inverted to provide hemispheric maps of ionospheric plasma density. Such a data product would be immensely useful to the space physics community, as well as the society whose activity is affected by space weather environment changes.
Ion-neutral interactions
Introduction of ion-neutral interactions
The exchange of energy and momentum between the charged and neutral components of the Earth’s upper atmosphere are manifested in ionospheric phenomena observed by SuperDARN radars. Examples include generation and propagation of TIDs, sudden onset of acoustic-gravity waves (AGWs), mutual momentum exchange between the ion convection and neutral winds, and generation of small-scale plasma irregularities. This section reviews mid-latitude SuperDARN radar contributions in understanding these phenomena.
TIDs: Introduction
TIDs can be initiated by a number of sources and consequently vary over a wide range of spatial scales and propagation properties. Large-scale TIDs (LSTID) are classified as perturbations with scale sizes greater than 1000 km and having periods longer than 30 min while MSTIDs are perturbations of a smaller size and a shorter period (Hunsucker 1982). TIDs have been extensively studied using various observation techniques including ionosondes (Hocke and Schlegel 1996 and references therein; Crowley and Rodrigues 2012), incoherent scatter radars (Hocke and Schlegel 1996 and references therein), optical imagers (e.g., Shiokawa et al. 2002; Shiokawa et al. 2003), and GPS receivers (Ding et al. 2008, 2011; Otsuka et al. 2011; Tsugawa et al. 2003, 2004).
TIDs can be identified in SuperDARN radar data as quasi-periodic range progressions of echoes in either ionospheric scatter (IS) or ground scatter (GS). An example of a TID event is shown in Fig. 27 (Grocott et al. 2013). The top panel uses ray-tracing analysis to demonstrate how wave-like perturbations in ionospheric electron density can produce selective focusing of the HF radar waves at specific ranges (e.g., 1800 km) so that returned signals have stronger backscattered power (Samson et al. 1990). The bottom panel shows an example of how this behavior is manifested in FIR GS data as regions of enhanced power moving toward the radar with a periodicity of ~ 30 min. At least 10 such excursions are visible. This signature is consistent with the previous model calculation results by Stocker et al. (2000).

a Model ray paths of HF radar propagation through an ionosphere modulated by a TID. Focusing and defocusing at the ground is caused by the uneven contours of electron density (adapted from Samson et al. (1990)). b Example of FIR radar ground scatter data received along a single beam, versus ground range and universal time, showing several signatures of TID moving toward the radar. Reproduced from Fig. 2 of Grocott et al. (2013)
SuperDARN signatures of LSTIDs
The number of LSTID events studied thus far with SuperDARN has been somewhat limited. Hayashi et al. (2010) were the first authors to conclusively identify an LSTID event, during a geomagnetic storm, using daytime HOK GS observations and GPS Earth Observation Network System (GEONET) network GPS data of TEC. In Fig. 28 from Hayashi et al. (2010), three large-scale density perturbations are clearly seen in the TEC data (bottom panel) with enhancements propagating equatorward (events 1 and 2) and one propagating poleward (event 3). The speeds of the equatorward perturbations were 600 and 800 m s−1, respectively, with corresponding periods of 45 and 30 min. These values imply horizontal scales for the ionospheric structures of 1500–1700 km. By contrast, the propagation speed for the poleward-propagating perturbation was 600 m s−1 with a period of 75 min, implying a horizontal scale of ~ 2700 km. Also, the TEC enhancements for the poleward-propagating perturbation were found to be several times stronger (1 TEC unit (TECU) versus 0.4 TECU, TECU = 1016 electrons m−2).

LSTID signatures observed simultaneously by HOK and GEONET-GPS receiver network on 15 December 2006. The upper panel shows Doppler velocity of GS echoes measured by HOK, and the lower panel shows GEONET-GPS total electron content (TEC) perturbations (sampled along the direction of HOK beam 0 at lower latitudes) plotted as a function of UT and geographic latitude. In the lower panel, the TEC perturbation values were obtained by subtracting 60-min running average. Three major disturbances are visible in each map, denoted as events 1–3. Adapted from Fig. 5 of Hayashi et al. (2010)
Turning now to the HOK data (top panel, Fig. 28), it can be seen that the radar detected concurrent bands of enhanced GS echoes, moving toward or away from the radar, with Doppler velocity enhancements up to 50 m s−1, correlated with the TEC enhancements. Furthermore, the main body of the high Doppler velocity echoes showed propagation speeds comparable to those inferred from the GPS data. Hayashi et al. (2010) suggested the equatorward propagating LSTIDs (events 1 and 2) seen in both the HOK and GPS data were signatures of AGWs generated at high latitudes and propagating equatorward to mid-latitudes. Indeed, estimates of the expected density perturbation amplitude based on linear AGW theory showed reasonable agreement with observations for events 1 and 2 but vastly underestimated the amplitude for the poleward-propagating signatures (event 3). It was thus suggested that event 3 was instead an LSTID initiated by sources in the Southern Hemisphere auroral zone. This interpretation is somewhat anomalous because equatorward propagation is more commonly observed for LSTIDs (Tsugawa et al. 2004; Ding et al. 2008). A later study by Milan et al. (2013) using the FIR radar concluded that 1–2 h perturbations in nightside GS echoes were produced by equatorward propagating LSTIDs excited by geomagnetic disturbances at auroral or sub-auroral latitudes.
SuperDARN signatures of MSTIDs: Introduction
It has long been anticipated that MSTIDs have different sources during daytime and nighttime and thus different general characteristics (Kotake et al. 2006; Ogawa et al. 2009; Kotake et al. 2007; Kelley 2011). Accordingly, after general characterization of MSTIDs, daytime and nighttime observations are considered separately.
MSTID occurrence
The vast majority of SuperDARN publications on mid-latitude MSTIDs are based on the analysis of GS signals, but a few have been identified in ionospheric scatter (IS) F region echoes as well (e.g., Ogawa et al. 2009; Suzuki et al. 2009). Generally, the GS occurrence changes dramatically versus season and time of day because of variations in the background ionospheric electron density. This tendency complicates assessment of MSTID occurrence (e.g., Grocott et al. 2013; Frissell et al. 2014). At mid-latitudes, GS is typically present during daytime, centered around noon, and decreases dramatically toward winter as the electron density in the ionosphere becomes smaller (Grocott et al. 2013; Frissell et al. 2014; Oinats et al. 2015). Thus, MSTID occurrence rates should be normalized by the rate of GS occurrence, which has only been done by Grocott et al. (2013).
One of the first SuperDARN publications on mid-latitude MSTIDs examined TIG sea scatter measurements during the year 2000 (He et al. 2004) and found more events occur during daytime (especially during postnoon hours) and in winter, with fewer events near equinoxes and even fewer in summer. This tendency is consistent with Bristow et al. (1996) who also reported more frequent auroral zone MSTID event detection in winter. Frissell et al. (2014) with the BKS data and Oinats et al. (2015) with the HOK data both concluded the MSTID occurrence rate maximizes during daytime in winter. By contrast, Grocott et al. (2013) examined normalized FIR MSTID occurrence for daytime events and found the MSTID occurrence rate was higher during equinoctial time (although the authors could not fully conclude with respect to winter occurrence rates because of insufficient statistics). To further complicate matters, observations with other instruments are also somewhat contradictory with respect to a preferential season and time of day for MSTID occurrence (Ding et al. 2011; Kubota et al. 2011; Kotake et al. 2007). Clearly, more work is needed.
Typical MSTID parameters
It has been established that the typical period, wavelength, and propagation speed of MSTIDs are very comparable across the MLAT of SuperDARN observations, and in both hemispheres (He et al. 2004; Ishida et al. 2008; Grocott et al. 2013; Frissell et al. 2014, 2016; Oinats et al. 2015, 2016a). Frissell et al. (2014) presented histogram distributions for these parameters based on daytime BKS observations in the American sector. Typical values were found to be 30–40 min periods, 200–300 km spatial scales, and 100–150 m s−1 phase speeds. A follow-up study (Frissell et al. 2016) considered a more extensive data set comprising six North American mid-latitude radars and four auroral zone radars and concluded that daytime MSTID parameters at high and mid-latitudes are generally comparable. One minor difference was more frequent occurrence of shorter-wavelength and faster moving MSTIDs at high latitudes, consistent with an earlier study by Ishida et al. (2008) using a more limited data set. Other studies have shown that nightside MSTIDs have typical parameters comparable to those during daytime (Oinats et al. 2015, 2016a; Milan et al. 2013). Minor differences noted by Oinats et al. (2016a) are 20–30% longer periods and wavelengths of nighttime MSTIDs although the differences are difficult to quantify because the data are presented as scatter plots. Data presented by Oinats et al. (2015) seem to suggest that nighttime MSTIDs during summer have larger propagation speeds, by at least 30%.
Daytime MSTIDs: Introduction
Establishing the direction of MSTID propagation is fundamentally important for locating potential sources and for understanding the mechanisms of MSTIDs generation.
Daytime MSTIDs: Propagation direction
A number of SuperDARN studies have assessed the direction of daytime MSTID propagation observed by individual radars. For example, Ishida et al. (2008) analyzed HOK and KSR data and found a great deal of similarity between the propagation directions of MSTIDs in the auroral zone and at mid-latitudes, namely toward the southeast or southwest. Frissell et al. (2014) analyzed BKS observations and identified two semi-distinct populations of daytime MSTIDs propagating over North America: a major component propagating southeast (az =150°, where az is the angle between the propagation direction and geographic north, positive clockwise) and a minor population propagating northwest (az = − 50°). The dominant southeast propagation direction has been further confirmed by Frissell et al. (2016) using data from 6 mid-latitude North American radars. Observations with FIR (Grocott et al. 2013) and TIG (He et al. 2004) are consistent with this result in the sense that the majority of MSTIDs propagate toward the equator with some eastward component. However, it is important to emphasize that numerous studies have reported minor populations of MSTIDs propagating in seemingly “anomalous” directions which are likely associated with local factors. For example, Grocott et al. (2013) identified a persistence of MSTIDs propagating westward and related them to AGW generation by either the Andean and Antarctic Peninsula mountains or the polar vortex. Ishida et al. (2008) also detected occasional MSTIDs propagating westward and southeast which were thought to be related to meteorological phenomena above the troposphere. He et al. (2004) showed occasional occurrence of poleward-propagating MSTIDs.
Oinats et al. (2015) performed extensive analysis of MSTID propagation directions by considering skip distances of the HOK GS echoes. Four major directions were identified. Two directions were found to dominate near noon: south and southwest in winter and northeast in summer (see their Fig. 2). In a follow-up study, Oinats et al. (2016a) found that the second cluster corresponds to MSTIDs at short radar ranges reflecting disturbances in the E region (see their Fig. 2).
One working hypothesis for the preferential direction of observed MSTID propagation is a filtering effect of neutral winds such that only those AGWs propagating opposite to the neutral wind flow will be detected by the radars (e.g., Kotake et al. 2007; Oinats et al. 2016a). General agreement of SuperDARN-inferred directions with this hypothesis has been invoked by Ogawa et al. (2009) and Grocott et al. (2013). Oinats et al. (2016a) went further by modeling the expected directions of MSTID propagation on the basis of the HWM07 neutral wind model (Drob et al. 2008). Figure 29 shows the expected (modeled) occurrence of MSTIDs on the azimuth-LT plane as gray-scale pixels and the actual MSTID occurrence by line contours with color signifying various rates. Both echo detection through the E and F regions are considered. For the dayside, one can see that the agreement is very good for the summer observations, slightly worse for the equinoctial observations, and much worse for the winter conditions where shift to the southeast directions is as large as 30°–50°.

a–b Modeled rates of anti-wind MSTID direction occurrence versus local time based on the HWM07 neutral wind model (Drob et al. 2008) applied to the center of the HOK FOV. Contours are MSTID occurrence rates according to the HOK observations of ground scatter from the E region. b The same as a but for ground scatter from the F region. Blue, red, and magenta contours are for the rates of 3, 5, and 10%, respectively. Adapted from Fig. 3 of Oinats et al. (2016a)
Daytime MSTID generation: Geomagnetic influences and polar vortex activity
One classical scenario of MSTID onset is generation of AGWs due to geomagnetic activity in the auroral zone and subsequent propagation to mid-latitudes (Ogawa et al. 2002b; Ishida et al. 2008). For the dayside, however, published papers have found mixed results regarding this scenario.
Ishida et al. (2008) specifically targeted geomagnetic influences through a statistical study of KSR, KOD, and HOK GS signals in the auroral zone and at mid-low latitudes during periods with relatively low and high solar activity. For one quiet day event with nearly simultaneous monitoring of MSTIDs by all radars, the MSTID parameters, such as azimuth of propagation, speed, and period, were very comparable. On the other hand, for disturbed conditions, the MSTID parameters at mid- and high latitudes were quite different. By considering multiple events, with statistics comprising 130 events in the auroral zone and 40 events at mid-latitudes, the authors found a great deal of similarity between the propagation directions of MSTIDs (although much more variability was seen for the high-latitude MSTIDs) which seems to favor a high-latitude source location.
Grocott et al. (2013) found almost no correlation of MSTID occurrence with magnetic storm activity (SYM-H index, 0.3 correlation coefficient) but a more pronounced correlation with auroral substorm activity (AE index, 0.57 correlation coefficient). Oinats et al. (2016a) reported a minor increase in the speed and the amplitude of MSTID-related perturbations with the AE index for HOK observations (although data in all LT sectors were included in their analysis).
Finally, an extensive analysis of daytime MSTID dependence on magnetic activity in the auroral zone by Frissell et al. (2016) resulted in a firm negative conclusion. These authors created a special index quantifying MSTID activity according to the intensity of power modulations of the GS echo power for each individual radar (10 radars were considered). They found negligible correlation of the introduced MSTID index with SYM-H and AE indices but high correlation with a newly defined Polar vortex index. Figure 30 a from Frissell et al. (2016) shows variations of the MSTID index characterizing the level of GS signal power fluctuations for quiet periods (dotted line and blue color of the background) and periods with strong MSTID activity (solid line and pink color of the background). Figure 30 b–d show temporal variations of the polar vortex index (calculated from the variabilities of the geopotential differences at the 1 and 10 mb levels), AE, and SYM-H indices, respectively. No visible correlation exists between enhanced MSTID activity and magnetic indices, while the polar vortex index shows generally the same trends as the MSTID index (e.g., pronounced decreases around 15 January and a monotonic decrease after March). Even some short-term excursions of the indices are consistent with each other. On the basis of these data, Frissell et al. (2016) concluded that the southeast direction of MSTID propagation over North America is due to AGW generation in the troposphere at the boundary regions of the active polar vortex area. They also demonstrated that the seasonal variation in MSTID activity is in accord with stratospheric warmings, pointing to the critical role of the lower atmosphere in generation of daytime MSTIDs. It was assumed that the neutral wind filtering effect controls the direction of the observed MSTIDs, in agreement with conclusions by other studies (e.g., Kotake et al. 2007; Oinats et al. 2016a).

Time series of North American SuperDARN MSTID, polar vortex, and geomagnetic activity indices for the 2012–2013 observational season. a Continental MSTID index (gray and blue traces) and daily number of good sampling windows (dotted line). Background color indicates daily MSTID score and classification, with MSTID-active days in reds and MSTID-quiet days in blues. b Polar Vortex Index. c Negative AE index. d SYM-H index. In all panels, gray traces show raw data while blue traces show a 4-day running mean smoothing. Adapted from Fig. 9 of Frissell et al. (2016)
Polar vortex activity is likely not the only source of daytime mid-latitude MSTIDs. Indeed, in an earlier paper, Frissell et al. (2014) discussed northwest propagating MSTIDs and related them to tropospheric convection processes over the Atlantic Ocean. Earlier, Grocott et al. (2013) identified the possibility of MSTID propagation from tropospheric processes over the mountains in Antarctica. Finally, Oinats et al. (2016a) reported that HOK often sees MSTIDs propagating northwest and attributed them to E region ionospheric perturbations, also propagating in unusual directions.
Nighttime MSTIDs: Introduction
Optical and GPS TEC observations have shown that nighttime MSTIDs are a frequent phenomenon at mid-latitudes (e.g., Shiokawa et al. 2003; Otsuka et al. 2011). However, detection of nighttime MSTIDs using HF ground scatter signals is complicated by the fact that electron density decreases after sunset and the ground scatter echo occurrence rates plummet (e.g., Frissell et al. 2014). This effect is especially profound in winter. In addition, propagation conditions tend to be more complex during nighttime making definitive identification of quasi-periodic MSTID ground scatter patterns/range bands much more difficult. In such conditions, concurrent observations with other instruments such as optical imagers and/or GPS TEC receivers are extremely useful. For example, Shiokawa et al. (2008) and Koustov et al. (2009) reported HOK GS echo bands moving equatorward in unison with optically identified MSTIDs. Finally, Oinats et al. (2015) found nighttime mid-latitude MSTIDs are less frequent in winter; however, this may be due to a general decrease in GS occurrence because optical observations show clear MSTID maxima at solstices (Duly et al. 2013 and references therein).
Nighttime MSTIDs: Propagation direction
Ichihara et al. (2013) reported nighttime MSTIDs observed by HOK usually propagate southwest but sometimes north to northeast. These latter MSTIDs occur more frequently after sunset, near the dusk terminator or in the midnight sector. The authors also found northward propagating MSTIDs are not always accompanied by similarly moving MSTIDs at lower latitudes (over central Japan), equatorward of the radar observational area. These statistical results substantiate a report by Shiokawa et al. (2008) who studied one event of northeast propagating MSTIDs during nighttime. MSTID motion seen in optical data during this event were related to the descent of the ionospheric F region identified by a concurrently operating ionosonde. HOK observed some irregularly-propagating GS progressions that could have been identified as MSTIDs, but details were not investigated.
Oinats et al. (2015) indicate that the majority of nighttime MSTIDs occur during late evening to pre-midnight hours (16–24 LT) and preferentially at equinox (see their Fig. 2). This finding is in disagreement with Duly et al. (2013). They found propagation to the southwest (az = 210°), similar to daytime MSTIDs over Japan, and pre-midnight MSTIDs occurrence consistent with the wind filtering effect (Fig. 29 from Oinats et al. 2016a). Another cluster of events during morning hours, between 3 and 5 LT (see their Fig. 2) propagate to the northeast (az = 30°). Surprisingly, these are not strong in winter, probably because of weakening in the neutral wind filtering effects, as predicted by Oinats et al. (2016a) (see Fig. 29b).
Nighttime MSTIDs: High-latitude geomagnetic influences
One might generally expect better correlation between nighttime MSTID occurrence and high-latitude geomagnetic activity because the auroral oval is located at much lower magnetic and geographic latitudes on the nightside. So far, however, this expectation has not been fully articulated. Oinats et al. (2016a) found increased amplitude of MSTIDs with AE magnetic index in all LT sectors but individual events studied by Shiokawa et al. (2008) and Koustov et al. (2009, 2014) were during geomagnetically quiet conditions. Only one of the events considered by Ogawa et al. (2009) can be related to geomagnetic disturbances at high latitudes while two others occurred under very quiet conditions, according to the Kp and AE indices. These mixed findings question the importance of auroral zone sources for generating nighttime mid-latitude MSTIDs, similar to what has been found on the dayside.
Finally, it is noted that Ichihara et al. (2013) found preferential occurrence of northeast propagating MSTIDs near dusk (see their Fig. 4) suggesting the solar terminator may also play an important role (e.g., Afraimovich et al. 2009). This hypothesis, however, has not been investigated with SuperDARN data yet.
Nighttime MSTIDs: E region signatures and vertical coupling
Electron density perturbations propagating at E region heights can also be detected as MSTIDs in SuperDARN GS and IS signals. Ogawa et al. (2009) were the first authors to report MSTID signatures in E region ionospheric echoes as quasi-periodical striations in HOK ionospheric backscatter. Regions with enhanced echo power were found to be magnetically connected to F region plasma depletions as inferred from 630-nm airglow camera observations. Ogawa et al. (2009) suggested such a coincidence is indicative of electrodynamic coupling between these two regions in the form of a polarization electric field (Perkins 1973) which maps into the E region without attenuation, as envisioned theoretically (e.g., Yokoyama and Hysell 2010).
Koustov et al. (2014) performed a more comprehensive analysis of E region MSTID signatures in HOK echoes and reported preferential occurrence of such echoes in summer with a secondary maximum in winter. This tendency is despite the fact that E region nighttime HOK echoes are more frequent in winter (Yakymenko et al. 2015). The authors found the E region MSTIDs propagate toward the southeast or east during pre-midnight hours and toward the southwest or west during post-midnight hours with average speeds of 86 m s−1 and 56 m s−1, respectively. Their typical spatial scale is ~ 300 km. However, the Doppler velocity of the MSTID striations were smaller than the speed of the power enhancements implying HOK monitored extended plasma blobs moving across the FOV, presumably at the background wind velocity. Plasma motions inside the blobs are assumed to be controlled by a combined effect of the electric field and neutral wind, as later expanded by Yakymenko et al. (2015).
Several additional arguments supporting the notion of strong electrical coupling between the E and F regions during MSTID events have been identified. These include (1) F region echo velocity is consistent with the expected electric field direction within regions of depleted/enhanced electron density (Suzuki et al. 2009), (2) E region plasma velocity is comparable to that in the F region (Koustov et al. 2014), (3) polarity of the E region velocity changes consistently in neighboring regions with enhanced/depleted plasma density (Ogawa et al. 2009), and (4) the power of E region echoes correlates with the measured Doppler velocity (Koustov et al. 2014). However, there are also several outstanding issues, including (1) sometimes, the region of depleted plasma correlates with a sheared plasma flow of opposite polarities, instead of a single direction (Ogawa et al. 2009) and (2) polarity of the velocity is inconsistent with that usually observed for MSTIDs over Japan with the middle and upper atmosphere (MU) VHF radar (although at quite different MLAT).
SuperDARN detection of seismically-activated TIDs
With extensive spatial coverage and reasonably good temporal resolution, the SuperDARN radars can be a powerful tool for investigating ionospheric disturbances generated by sources outside the atmosphere. Only a few SuperDARN studies have been published thus far in this area, and the record will likely remain short in the case of meteorites (Berngardt et al. 2015). However, HF radars have been proven to be useful for tracking TIDs generated by intense earthquakes and tsunamis (Occhipinti et al. 2010) and the SuperDARN radars could become a powerful tool for more systematic studies of such disturbances, especially over oceans where other ionospheric measurements are not possible.
Nishitani et al. (2011) reported the first SuperDARN radar detection of ionospheric disturbances initiated by a major earthquake on 11 March 2011 off the Pacific coast of Tohoku (magnitude, M = 9.0). During this event, HOK was originally operating in a normal azimuth scanning mode but several minutes after the earthquake occurred it switched to a camping beam mode with a single high-resolution 8-s beam. Data obtained on the 8-s beam identified five separate bands of ground scatter moving away from the radar with apparent speeds of 6.7, 6.2, 4.5, 3.9, and 3.5 km s−1 (see Fig. 31 from Ogawa et al. 2012). The speeds of the first two GS bands were faster than any MSTIDs observed previously, by any observational means, while the speed of the three next disturbances were found to be consistent with a scenario of surface Rayleigh waves propagating into the observational area and generating acoustic (air) waves that generate electron density perturbations as they expand upward to ionospheric heights (Ducic et al. 2003). Surprisingly, these kinds of waves with speed faster than 4 km−1 were not seen in the TEC data. It was concluded that the radar observations were associated with up-and-down motions of the ionospheric layers as fast as 200 m s−1 (peak-to-peak values). Note that some of the disturbances, e.g., the one at 1512–1514 UT, were due to aftershocks rather than the main shocks, making it difficult to analyze the data in the later stage of the event.

Doppler velocity of HOK echoes on beam 4 (echo power > 10 dB) versus Japanese Standard Time (JST) after an earthquake on 11 March 2011. Sloped lines mark several individual echo bands propagating northward away from the earthquake epicenter. Measurements at 900–1100 km range (dashed rectangles) are 2-hop signals while their 1-hop counterparts are identified by solid rectangles at 350–500 km range. Adapted from Fig. 5 of Ogawa et al. (2012)
A follow-up study of the 11 March 2011 earthquake event by Ogawa et al. (2012) examined a second class of poleward-propagating backscatter power enhancements which arrived in the HOK observational area later than the Rayleigh wave perturbations and associated them with slower-moving AGWs generated at the epicenter. For these latter perturbations, no clear correlations between echo power and Doppler velocity were detected, contrary to what is seen for typical nighttime MSTIDs (Ogawa et al. 2009). Another interesting phenomenon was two bursts of quasi-periodic pulsations of echo LOS velocity (2–4 min period) which occurred ~ 105 min and ~ 180 min after the earthquake and lasted for about 30 min. It was suggested that these so-called “acoustic resonance” pulsations were produced by acoustic waves trapped between the Earth’s surface and thermosphere modulating the ionospheric electric field and electron density (Shinagawa et al. 2007). Why two separate resonance intensifications were observed, however, requires further investigation.
Ion-neutral coupling and generation of plasma irregularities
The E × B drift of ionospheric plasma at F region heights may alter the directional motion of neutral particles (ion drag effect) and neutral winds can affect the velocity of charged particles. Several studies have attempted to identify the efficiency of these interactions and the time scales on which they operate.
Joshi et al. (2015) investigated mid-latitude ion-neutral coupling during the geomagnetic storm of 2–3 October 2013 using co-located measurements of ionospheric convection from North American mid-latitude SuperDARN radars and neutral winds from Fabry-Perot interferometers (FPIs). The time scales on which the coupling operates were analyzed using momentum exchange theory and time-lagged correlation analysis. During the main phase, they found the neutrals respond to the ion convection on a time scale of ~ 84 min. Figure 32 a and b illustrate this result. Prior to storm onset (0140 UT), the two wind velocity vectors can be seen to oppose the E × B drift of plasma while several hours into the storm (0840 UT) the wind vectors have rotated into the direction of the plasma drift. The time scale of this rotation is comparable to what might be observed at high latitudes using satellite observations (Killeen et al. 1984) but significantly faster than what is expected from local ion-drag momentum forcing alone. This tendency suggests that other storm-time influences are important for driving the neutrals during the main phase, such as Joule heating. During the late recovery phase, however, the neutrals were observed to drive the ions without any significant time delay (Fig. 32c from Joshi et al. 2015) consistent with the so-called “neutral fly wheel effect” or disturbance dynamo (Blanc and Richmond 1980).

SuperDARN ionospheric convection maps during the a, b main and c recovery phases of a geomagnetic storm on 2 October 2013, with fitted vectors in locations where measurements were obtained (color coded according to the scale at right) and superposed neutral wind velocity (black vector) measured at the Illinois (UAO) and Michigan (ANN) FPI sites. Locations of the mid-latitude SuperDARN radars operational at this time are identified. Adapted from Figs. 4 and 7 of Joshi et al. (2015)
The importance of the disturbance dynamo effect at mid-latitudes has also been confirmed earlier by Zou and Nishitani (2014) who found that midnight flows measured by HOK during winter are predominantly westward at latitudes 40°–50° and their speed increases with the intensification of planetary magnetic activity characterized by the Kp magnetic index. They also found a ~ 12-h delay in achieving maximum westward flow speed at mid-latitudes after a substorm onset in the auroral zone. This time delay is significantly longer than the estimates by Joshi et al. (2015) but still in qualitative agreement with the disturbance dynamo model by Blanc and Richmond (1980), provided that one considers the much lower latitudes of the HOK observations.
Neutral winds can also play an important role modulating mid-latitude F region electron density (de Larquier et al. 2011; Milan et al. 2013) and facilitating the generation of small-scale plasma irregularities through neutral wind turbulence (Gurevich et al. 1997). This process is particularly important at mid-latitudes where magnetospheric electric fields are weak. Yakymenko et al. (2015) found that the diurnal variation of HOK echo velocity at short ranges cannot be explained by variation in the E × B drift alone. However, by adding a neutral wind contribution to the irregularity velocity and assuming that the irregularities were not strictly magnetic field-aligned, they were able to match the measurements with theoretical expectations. It was also noticed that the short range HOK echoes are not confined to locations of zero aspect angle which suggests wind-induced irregularities are not strongly field-aligned. Another study by Ponomarenko et al. (2016) concluded that a particular class of near-range echoes observed in the prenoon sector during summer time are most likely from ionospheric irregularities produced by the neutral wind turbulence in the lower E region, rather than meteor echoes as is commonly assumed, because their velocity characteristics are similar to the winds.
Finally, mid-latitude SuperDARN radars can be used to monitor neutral processes in their own right, such as atmospheric tides and turbulization of icy particles at the summer mesopause. Hibbins et al. (2011) used FIR radar observations of meteor echoes to study atmospheric tidal motions in the mesosphere and found strong semidiurnal tides in winter were much stronger in the Southern Hemisphere compared to the Northern Hemisphere. They also noticed bursts of quasi 2-day activity in summer with amplitudes up to 60 m s−1. Ogawa et al. (2013) reported two cases of mesosphere summer echoes (MSEs) detected at mid-latitudes by HOK with narrow spectral widths (< 10 m s−1), high power (> 20 dB), and relatively fast Doppler velocities (up to 50 m s− 1). These HF echoes were observed when medium frequency (MF) and VHF radars detected MSEs in a region several hundred kilometers westward of the HOK echo detection zone. An interpretation in terms of MSEs was further supported by the fact that temporal variations of the HF echo velocity correlated well with the wind velocity concurrently measured by the MF radar.
Ion-neutral interactions: Summary and future directions
In this subsection, the contributions of mid-latitude SuperDARN radars to studies of phenomena associated with ion-neutral interactions, predominantly TIDs, have been summarized. Looking forward, there is additional need for coordinated studies in which radar observations are analyzed in conjunction with other instruments, such as GPS receivers, ionosondes, and airglow imagers. Such studies are most feasible in the East Asia and North American sectors where the density of suitable instruments is particularly high, allowing for the tracking of TID perturbations over extended ranges of latitude and longitude. There is also further scope for examining the interhemispheric conjugacy of TIDs using simultaneous observations from the southern and northern radar networks, perhaps, in conjunction with in situ measurements obtained from satellites orbiting in both the ionosphere (e.g., Swarm) and magnetosphere (e.g., Arase).
MHD waves
Introduction of MHD waves
MHD waves are observed throughout the magnetosphere and therefore at a range of latitudes on the ground, from the equator to polar latitudes. These waves, often referred to as ULF (~ 1–1000 mHz) waves or geomagnetic pulsations, have many different source mechanisms which can be categorized as either external or internal to the magnetosphere. External sources include the Kelvin-Helmholtz instability (KHI) on the magnetopause (e.g., Hughes 1994), solar wind dynamic pressure variations (e.g., Araki et al. 1997), and waves generated at the bow shock which directly propagate through the magnetosphere (e.g., Fairfield 1969). Internal sources include waves related to substorm onset (e.g., Lester et al. 1983), and wave-particle interactions where waves gain energy from particles in the magnetosphere (e.g., Chisham et al. 1992).
SuperDARN radars are particularly sensitive to MHD waves as the latter generate periodic variations of plasma drift observed as Doppler shift oscillations in the radar returns. Critically, such waves can be observed either in ionospheric scatter (Rae et al. 2005), in ground scatter (Ponomarenko et al. 2003), or in artificially stimulated ionospheric scatter (Yeoman et al. 1997). The observations in ionospheric scatter provide direct measurements of the E × B velocity which is imposed by the electric field vector of the MHD wave. Care should be taken, however, in discussing the electric field variations of standing waves and comparing them with magnetic field changes because of the node-antinode relationship between them due to the presence of finite ionospheric conductivity, as pointed out by Sakaguchi et al. (2012). On the other hand, in ground scatter, the observations can effectively be considered to be associated with the bulk motion of the ionospheric plasma in the vertical direction, although there are a number of processes involved here (e.g., Sutcliffe and Poole 1989). Furthermore, visualization of ULF waves in ground scatter can be problematic since the scatter have low velocities. Artificially stimulated ionospheric scatter occurs from intense field-aligned irregularities produced through the interaction of high-power HF radio waves with the ionospheric plasma below the waves’ reflection point. However, this observational mechanism is not pertinent to mid-latitude SuperDARN radars as there are no high-power radio waves transmitters, or heaters, in the FOV of the existing mid-latitude radars. Finally, the standard 16 beam scan with 3-s integration along each beam (1-min temporal resolution) is prohibitive for registering oscillations at frequencies above 8.3 mHz, and consequently, discretionary or special modes have been designed in order to expand the observed frequency spectrum of MHD waves, thereby demonstrating the flexibility of the SuperDARN radars.
The mid-latitude SuperDARN radars are well placed to observe the waves driven by these mechanisms. In particular, they are conveniently located to observe waves which are driven by internal mechanisms such as substorms (Pi2) and wave-particle interactions (high-m Pc4–5). For substorms, the mid-latitude radars are not as badly affected by absorption or changing in propagation conditions of the HF signal due to particle precipitation into the D and E regions (e.g., Gauld et al. 2002) because the transmitted signals typically enter the ionosphere equatorward of the auroral regions. Furthermore, waves driven by wave-particle interactions tend to map more to the field lines which thread the F region of the mid-latitude radars. Finally, the presence of ground scatter tends to be more stable over a wider range of magnetic conditions for the mid-latitude radars than for the high-latitude ones making identification of ULF waves easier.
In this section, the observations of MHD waves by mid-latitude SuperDARN radars are reviewed. Pi2 and Pi1 pulsations are considered first, before discussing Pc3/4, and Pc5 pulsations.
Pi2 and Pi1 pulsations
Studies of Pi2 pulsations are typically event-based and related to data from other instruments, both ground and space-born. In the first observations of sub-auroral Pi2 pulsations by a SuperDARN radar, at WAL, Gjerloev et al. (2007) found that the LOS velocity variations at ~ 56o N AACGM latitude were highly correlated with nearly co-located magnetometer observations at Ottawa. These authors used the relationship between the variations in magnetic field and those in the LOS velocity to demonstrate that a predominantly shear Alfven mode wave can explain the amplitude and phase characteristics. This event occurred as part of a weak substorm, although observations at geosynchronous orbit suggest that there were time differences between the ground and space signatures, with the ground signatures leading those at geosynchronous orbit.
Frissell et al. (2011) presented observations of an individual Pi2 pulsation using data from BKS in a special high-time resolution mode which was implemented to support the Time History of Events and Macroscale Interactions during Substorms (THEMIS) mission. In this mode, each radar operated a scan with 3-s integration times along each beam, but with a special beam, the camping beam, being sampled after every other beam. Thus, the full scan would take 2 min while there was a 6-s time resolution on the camping beam which in this case for BKS was beam 7. The BKS observations of the Pi2 wave were between 54o and 58o N MLAT, close to the latitude of the Remus magnetometer station which observed temporal variations similar to those in the Doppler velocity of the ionospheric scatter detected by the radar. A cross-phase analysis of magnetometer data over a range of latitudes indicates that these observations were made very close to the ionospheric projection of the plasmapause. Fine spatial and temporal details in the signature of the wave in the radar scatter suggest that there were periods when all ranges would see the onset of an enhancement in the velocity, while subsequently there would be evidence of a dispersion in the signature across latitudes. The authors interpreted this in terms of field-line compressions which occur when there is coherence in the radar scatter while at the time of the dispersion there is a relaxation of the field. Furthermore, THEMIS observations of ion velocities by electrostatic analyzers (McFadden et al. 2008) indicated two bursty bulk flows (BBFs) separated by 135 s which occurred about 1 min before the Pi2 event. Comparison of the LOS velocity at a variety of ranges along beam 7 of BKS demonstrates an interesting effect in the profile of each of the first two peaks of the Pi2 pulsation in the radar data (Fig. 33 from Frissell et al. 2011). In both cases, the waveforms started coherently as they moved toward the maximum value in the case of the second pulse and the whole first half of the wave cycle in the case of the first pulse. On the subsequent parts of the wave, however, there was a more dispersed signature as the traces relaxed to the lowest velocity on different time scales, which increased with increasing range. Frissell et al. (2011) interpreted these observations as the initial part of the wave pulse responding to the compression created by the passage of the BBF, while the lack of coherence was explained by the fact that the traces from the longer field lines, farther ranges, took longer time due to the longer field lines. This interpretation is indicative of the response to the BBF compression as it passed over the field lines and then a relaxation after the BBF had passed.

a The BKS LOS velocity as a function of latitude and time. The BKS data along beam 7 are averaged over three range gates and plotted as a function of UT for five sets of gates covering the latitude range of 53.9° N to 57.1° N. b The difference between the first part of each of the first two cycles and the second part. Reproduced from Fig. 3 of Frissell et al. (2011)
By comparing the variations in the ionospheric velocity measured by TIG and UNW with the magnetometer observations at MacQuarie Island (albeit at 65o S), Ponomarenko and Waters (2013) made the first direct observations of Pi2 wave polarization transition between ionosphere and ground. A special three-beam mode was employed in this study and use of a Hilbert transform revealed dynamics of the Pi2 evolution. The authors found for this particular event, which has a frequency of ~ 7.5 mHz, an approximate linear polarization of Pi2 transferred from the ionosphere to the ground with a 40o rotation of the polarization ellipse, rather than the conventional 90o suggested in earlier works (e.g., Southwood and Hughes 1983), which indicates that the conductivity profile is not as simple as originally modeled.
In a pair of papers, Teramoto et al. (2014, 2016) presented two further case studies of Pi2 pulsations using data from the THEMIS mode. In the first (Teramoto et al. 2014), a Pi2 wave was observed by HOK in the ground/sea scatter, which was reflected via the ionospheric F region, as well as from a sporadic E layer. The observations in the two different data sets had the same period, 110 s, and there appears to be no phase lag. The authors suggested that the concept of a pure cavity mode is not sufficient to explain the radar and coincident magnetometer observations and that a contribution from an Alfven mode must be considered in order to explain the observations.
In a second study, Teramoto et al. (2016) presented observations from three radars, HOK, TIG, and UNW, together with ground magnetometer data and electric and magnetic field observations by the THEMIS A, D, and E spacecraft. Note that, to date, this represents the only study of MHD waves at any latitude which use radar data from the two hemispheres. The interhemispheric radar observations were made near the plasmapause and are critical for the understanding of the event. An analysis of the THEMIS spectra indicated that two frequencies were present in the event under study, at 14 mHz and 28 mHz. Ground magnetometers do not appear to observe the higher frequency wave but spectral maxima at both frequencies are seen in the radar observations. TIG is key here because it made observations both inside and outside of the plasmapause, while UNW and HOK observed only inside the plasmapause. TIG observed frequencies inside the plasmapause (14 and 28 mHz) which are different from those outside of it (14 mHz only), while inside the plasmapause HOK only observed the lower spectral frequency and UNW measured the lower spectral frequency at lower latitudes and higher spectral frequency further poleward. The estimations of Poynting flux at THEMIS indicate that the waves were propagating earthward and duskward. The authors concluded that the observed wave was a cavity mode resonance which had been stimulated by compressional waves which had propagated duskward from the source region in the midnight sector.
Shi et al. (2017) provided a careful and thorough analysis of multiple data sets from THEMIS, ground magnetometer, and FHE, FHW, and BKS. Shi et al. (2017) attempted here to separate a plasmaspheric virtual resonance (PVR) where wave energy is primarily confined to the plasmasphere but a small portion escapes beyond the plasmapause, from a plasmaspheric cavity resonance (PCR) where wave energy should be confined to the plasmasphere. The radar data are key as they provide high spatial resolution across the plasmapause as shown in Fig. 34 from Shi et al. (2017), where the wave phase and power are taken across a number of range gates of data from FHE. The peak in power occurs at 60.6° N which is just inside the estimated position of the plasmapause at 60.9° N, while a minimum in power occurs at 59.60° N. The main phase change occurs between 59.8° N and 59° N. This tendency suggests that the wave is not a field line resonance (FLR). The authors also concluded that the source mechanism is related to the downward FAC in the substorm current wedge (SCW).

The FHE beam 10 LOS velocity as a function of time and results of a spectral analysis. a The FHE beam 10 LOS velocity as a function of time for a number of different range gates. b The relative phase from the spectral analysis as a function of latitude while c shows the amplitude from the spectral analysis. Note the red dashed line in b which gives the estimated position of the plasmapause. Reproduced from Fig. 12 of Shi et al. (2017)
So far, the only observation of Pi1 pulsations by a SuperDARN radar were made at WAL while testing a new high-resolution multi-pulse mode (Greenwald et al. 2008) when electric field pulsations with periods between 13 and 20 s were observed during a substorm expansion phase. Magnetometer data at Ottawa revealed simultaneous magnetic pulsations with the same period (Fig. 35 from Greenwald et al. 2008). The top panel of Fig. 35 is a contour plot of the spectral power from a wavelet analysis of the Ottawa X (geographic north-south) component data which shows well-defined peaks at 20 s at 0605 UT and between 25 and 30 s over 0608–0609 UT. The middle panel shows the high time resolution SuperDARN data which were available only for parts of the analyzed interval due to the operational mode. The most important segment lies between 0608 and 0609 UT, and it is zoomed on in the bottom panel. During this segment, two oscillation cycles with periods of 13–14 s were also seen by the Ottawa magnetometers, although in magnetic records the main spectral peak was observed at 25–30 s. There is also evidence for wave activity in the other high-resolution intervals from Fig. 35.

A comparison of magnetometer data from Ottawa with WAL LOS velocity. a The dynamic spectrum of the X component data from the Ottawa magnetometer for the interval 0604 to 0611 UT on 1 August 2007. The contours represent different levels of power with the lighter colors the higher power. b The high time resolution estimates of the LOS velocity from WAL for the same period. c The shorter interval is marked by vertical dashed lines. Reproduced from Fig. 3 of Greenwald et al. (2008)
Pc3–4 and Pc5 pulsations
The first mid-latitude observations of MHD waves were reported by Ponomarenko et al. (2003) using TIG. This work is generally a technical paper in which the authors describe and illustrate a way to visualize ULF wave signatures in the range-time maps of the Doppler velocity observed by SuperDARN radars. This visualization is achieved by applying median high-pass filtering and compressed dynamic range of the gray-scale color map (Fig. 36 from Ponomarenko et al. 2005). This analysis revealed the presence of the ULF signatures for 4–5 h per day. A very important finding was that 60% of the MHD waves were observed in the previously underused ground scatter component. Four different types of MHD waves were observed: (1) low wavenumber Pc5 waves, (2) high wavenumber Pc5 waves, (3) band-limited dayside Pc3–4 waves (thought to be generated via upstream waves), and (4) narrowband nighttime Pc4 waves (thought to be local FLRs). Importantly, the authors reported that 46% of the observed waves had no ground magnetic signature. The methodology presented in this paper was then used as the primary analysis method in three subsequent papers using mid-latitude SuperDARN radars, two of which look at Pc3–4 waves and one of which looks at Pc5 waves, which are discussed below.

LOS velocity data from beam 4 of TIG as a function of range and UT. One hour of LOS velocity data is presented from 2000 to 2100 UT on 28 September 2000. The gray scale, which saturates at + 50 m s−1 and − 50 m s−1, demonstrates the ability of this technique to visualize MHD waves in the data. Note also the band of scatter between range gates 20 and 40 (which is probably ground scatter) shows no evidence of the MHD wave on this occasion. Based on Fig. 4 of Ponomarenko et al. (2005)
Ponomarenko et al. (2005) investigated Pc3–4 waves in sea scatter from TIG. These data were complemented by ground magnetometer data from Macquarie Island. The waves were observed between 8 and 12 MLT, and the authors concluded that the observed waves were driven by the interaction of upstream waves with the magnetosphere. Such waves are believed to be generated at the Earth’s foreshock by the ion-cyclotron instability in reflected proton beams. These observations suggest that the Pc3/4 energy propagates into and through the magnetosphere in the isotropic fast mode and couples to field-line guided mode Alfven waves at harmonics of the local resonant frequency. Furthermore, Ponomarenko et al. (2005) concluded that these waves were third harmonic poloidal mode FLRs.
In a follow-on study, Ponomarenko et al. (2010) report a subsequent investigation of Pc3–4 waves in ionospheric scatter from TIG together with ground magnetometer data, but here the emphasis of the paper is on waves observed on the nightside. The authors present synchronous variations of Pc3–4 spectra near the post-dawn cusp and the nightside plasmapause and plasmatrough with frequencies that closely match those of upstream waves. They present direct evidence of a common source for the day and nightside Pc3–4 waves measured on the ground and in the ionosphere. The observed nightside Pc3–4 oscillations show a pronounced dependence on IMF parameters that replicates the behavior of simultaneous, dayside data. They discuss a possible propagation scenario: (1) Upstream waves are generated at the Earth’s foreshock. (2) These interact with the magnetosphere to drive compressional waves that travel throughout the magnetosphere. (3) These couple to field-aligned Alfven waves that result in the ionospheric and ground Pc3–4 signatures.
In a statistical analysis, Norouzi-Sedeh et al. (2015) applied a manual event selection to over 300 days of high-resolution data obtained in 2007–2009 by TIG and UNW. The ULF wave signatures in Doppler velocity oscillations over a relatively wide frequency range of ~ 0.5–50 mHz were identified by comparing the event time series and Fourier spectra with those obtained from the underlying ground magnetometer data at Macquarie Island. This procedure identified 194 events, most of which were detected between 15 and 21 LT, which is consistent with the radar echo occurrence (GS or IS) with a typical duration of ~ 1–1.5 h. This peak in LT occurrence matches a survey of radially polarized waves observed by the Active Magnetospheric Particle Tracer Explorers Charge Composition Explorer (AMPTE CCE) spacecraft (Anderson et al. 1990). A maximum entropy analysis was then applied to estimate the spectral peak locations with higher precision than can be provided by the fast Fourier transform (FFT) analysis. The maximum occurrence in frequency was observed at ~ 2 mHz with a secondary maximum located near 4–6 mHz, which matches the expected local FLR periods. Furthermore, Norouzi-Sedeh et al. (2015) suggested the presence of discrete spectral peaks at 1.3, 1.6, 2.1, and 2.8 mHz (Fig. 37), although these values vary somewhat throughout the paper and, more importantly, the peaks’ magnitudes seem to be close to the statistical variance level of the analysis. Similar discrete frequencies were also identified over 1830–2130 LT based exclusively on the ground magnetometer data, i.e., without pre-selection of the coincident radar-magnetometer events. While the majority of the oscillations (80%) showed little phase change with range, the rest showed zig-zag patterns which they identified as the ionospheric signatures of FLRs and postulated that they may be associated with the predicted location of the plasmapause or ionospheric trough region. The observed L values, however, are much higher than those predicted by models which leaves an open question on the nature of these waves.

A histogram of significant frequencies in the TIG data set. A three-point smoothing is applied to the data and is shown by the curve with the slightly darker black line superimposed on the histogram. The vertical lines identify peaks of the smoothed curve showing certain frequencies at 1.3, 1.6, 2.1, 2.9, and 3.3 mHz which appear to have higher spectral power than the neighboring frequencies. The frequency resolution is 0.1 mHz. Reproduced from Fig. 7 of Norouzi-Sedeh et al. (2015)
In an event study of a large-scale global mode oscillation at ~ 1.6 mHz which was triggered by a sudden commencement (SC) and observed across a wide range of latitudes by ground magnetometers, Kawano et al. (2016) interpreted the initial oscillation as a global magnetospheric cavity mode through comparison with magnetometer data. The authors argued that only a global cavity mode can have a frequency of ~ 1 mHz in the plasmasphere, as the entire magnetospheric cavity radially oscillates at the same frequency. An interesting feature embedded within this interval is a wave which displays the amplitude and phase pattern characteristic of a FLR, i.e., a single peak in amplitude at the resonant latitude accompanied by a monotonic change in phase across the latitudinal peak. This amplitude and phase pattern is revealed by a detailed spectral analysis of the high resolution (15 km in group range) ground/sea scatter signatures observed by HOK near L = 2 which demonstrate that, for a 15-min part of the 1-h wave event, a maximum in spectral power and steady increase of the phase with latitude have been observed. If these features are interpreted in terms of a poloidal FLR, as done by the authors, then the values of the plasma density at the equatorial plane required to produce the 1.6 mHz eigen oscillation would be an order of magnitude larger than those normally observed at these MLAT. Furthermore, the characteristic “kink” in the latitudinal phase progression is effectively absent from the data. In order to explain these discrepancies, the authors invoked (1) a quarter-wave type of FLR, (2) compression of the plasmasphere, (3) compression of the ionosphere, and (4) enhanced ion outflow caused by the main phase of the magnetic storm, whose combined effect might have produced the observed oscillations.
MHD waves: Future work
It is clear from the work that has been done on MHD waves with the mid-latitude SuperDARN radars that there is significant potential for further study. There are several future directions, both with existing data sets and radars, as well as potential new developments of radar technology, as well as links to current and future space missions. Two areas where the current data sets and radars could be used are identified before moving to new developments.
The work that has been currently done on Pi2 pulsations has yet to result in any firm consensus regarding the modes that are present at mid-latitudes. This situation perhaps is due to both the nature of the waves which are relatively short lived and occur during the nighttime when the presence of ground scatter is perhaps limited. Nevertheless, there are several directions which could be followed here, notably in developing statistical analyses which may enable us to separate out which modes are most often present. Further studies which relate ground and space observations, notably with space missions such as THEMIS, would also be helpful, in particular to determine the exact relationship between the wave signatures and tail dynamics as exemplified by BBFs. Finally, the use of interhemispheric studies may help in determining the wave modes present as this would place additional constraints on the models.
Moving to Pc3–4, these tend to be smaller-scale waves and so are more localized. Consequently, it is to be expected that future studies would focus on small sub-sets of radars, making use of the interhemispheric capability that exists in the Japanese/Australian and the US/South American sectors. Furthermore, future work is required to determine the percentage of such waves which are related to wave energy directly penetrating from the solar wind compared with internal sources of them such as wave-particle interactions. Pc5 waves on the other hand are more likely to be larger scale oscillations such that more studies involving multiple radars, where possible, would be sensible, especially as the network at mid-latitudes continues to expand.
Finally, the development of new radar and analysis techniques is considered. It is clear from the paper by Greenwald et al. (2008) that higher time resolution observations will enable studies of higher frequency waves. Currently, the SuperDARN technique is limited in two ways in this respect. One is the integration time along the beam and the other is the scanning from one beam to the next. Greenwald et al. (2008) demonstrated the potential of new ways of using the multi-pulse data to improve the time resolution along a beam, and this potential has already been recognized within the community. Further, the potential afforded by imaging radars (for more detail see the “Technical developments” subsection) for ULF wave studies cannot be underestimated. Finally, the development of analysis techniques which do not require a continuous data set, such as the Lomb-Scargle spectral analysis (Lomb 1976; Scargle 1982), would benefit the analysis of SuperDARN, where often there are data gaps.
Conclusions and future directions
Conclusions and science directions
In this paper, the scientific accomplishments of the mid-latitude component of SuperDARN have been reviewed in five specified areas, with some discussion of future science directions. Here is the brief summary:
-
1.
Convection: The expansion of SuperDARN to mid-latitudes has been a demonstrated success with previously unattainable measurements of the convection electric field equatorward of ~ 60° MLAT now possible, and the ability to study a variety of phenomena occurring at mid-latitudes. In addition to the expected enhancement in the capability to monitor plasma circulation during geomagnetically active periods, the mid-latitude radars have significantly improved our understanding of SAPS by providing near-continuous measurements of their temporal and spatial variations, and their relationships with other measurements such as GPS TEC and both ground and space-based imagers. Future studies will undoubtedly reveal the statistical nature of SAPS occurrence and the origins of SAPS and SAID.
-
2.
Ionospheric irregularities: With the construction of the first purpose-built mid-latitude SuperDARN radars at WAL and HOK, it is evident that additional types of irregularities exist at mid-latitudes. These include low-velocity irregularities in the sub-auroral region, high-velocity irregularities at the edge of the auroral oval associated with SAPS, and irregularities occurring during the passage of MSTIDs at temperate (lower) mid-latitudes. The relative simplicity of the ionosphere at sub-auroral latitudes is a distinct advantage for relating the irregularities to processes of plasma instability, and there has been impressive progress in the modeling of irregularities in terms of the GDI, TGI, and coupling between the E and F regions. There is a good reason to think that the mid-latitude radar observations are providing a critical testbed of measurements for developing comprehensive first-principle models and that this work will lead to fresh insights into ionospheric plasma physics of interest to a wide range of researchers and operators by encompassing the generation and growth mechanisms of several kinds of ionospheric irregularities and their relation to other phenomena (e.g., SAID / SAPS, MSTIDs, and E region shortenings due to enhanced conductivity) and to geophysical parameters (e.g., latitude and geomagnetic activity).
-
3.
HF propagation analysis: HF propagation analysis can be utilized to conduct value-added ionospheric research at mid-latitudes and as a tool for assessing radar performance. Looking forward, two scientific topics that deserve further examination with propagation analysis are solar cycle dependencies and interhemispheric differences. Also, it is feasible that calibrated elevation angle data could be inverted to provide ionospheric plasma density suitable for interhemispheric comparison.
-
4.
Ionosphere-neutral interactions: The contributions of mid-latitude SuperDARN to the study of phenomena associated with ion-neutral interactions have been predominantly through observations TIDs (large scale and medium scale). With mid-latitude SuperDARN, it is possible to study the characteristics of TIDs in the sub-auroral and mid-latitude regions as a function of latitude, LT, and geomagnetic activity, and several important characteristics have been clarified (e.g., the relationship to the intensity of the polar vortex). It has been demonstrated that the potential scope for study of ion-neutral coupling extends to the ionospheric disturbances that are due to big earthquakes, tsunamis, volcanic eruptions, and tornadoes and to the time scales of flywheel effects and disturbance dynamo effects.
-
5.
MHD waves: There has been a number of discoveries made using the mid-latitude SuperDARN radars to study MHD waves. Statistical studies have been limited to Pc3–5 waves, and an important early finding was that 60% of MHD waves occurred in the ground scatter received by the radars (Ponomarenko et al. 2003), thus opening a new technique for analysis. Studies of nightside Pi2 pulsations have been mostly limited to case studies involving multiple data sets collected from the ground and from space. The first estimate of the rotation of the Pi2 polarization ellipse was made with the results indicating that the conductivity profile is not as simple as originally modeled. In a serendipitous observation when testing a new coding scheme, Greenwald et al. (2008) made the first observations of Pi1 pulsations by a SuperDARN radar. Further studies of MHD waves using extended radar FOVs and new techniques are thus very promising.
Satellite conjunction
Mid-latitude SuperDARN radars have FOVs which cover sub-auroral and auroral latitudes and are connected by magnetic field lines to the inner magnetosphere and near-earth plasma sheet. Comparison between SuperDARN and satellite observations is crucial for understanding the dynamics of the coupled (inner) magnetosphere and ionosphere. Collaborative studies with, for example, the THEMIS (Angelopoulos 2008) and the Van Allen Probes satellites (Mauk et al. 2013) have already proven to be capable of addressing important science themes such as linkage of dynamical aurora in the ionosphere and plasma evolution in the magnetosphere (e.g., Nishimura et al. 2010) and ULF waves (e.g., Teramoto et al. 2016; Kim et al. 2017), and so forth. Recently the Exploration of energization and Radiation in Geospace (ERG) satellite (also known as “Arase” satellite) (Miyoshi et al. 2012) has joined such a collaboration framework particularly for studies of the inner magnetosphere, after its successful launch at the end of 2016. The addition of ERG to the inner magnetospheric satellite fleet enables the global view of ionospheric convection obtained instantaneously by SuperDARN to be compared with simultaneous observations at multiple points in the magnetosphere. Multi-spacecraft conjunction studies with SuperDARN could be used to monitor the longitude/MLT evolution of magnetosphere-ionosphere-coupled processes in an instantaneous manner. Several such studies are expected in the near future. Finally, there are several forthcoming spacecraft missions related to mid-latitude SuperDARN, such as Solar-wind Magnetosphere Ionosphere Link Explorer (SMILE), Ionospheric Connection Explorer (ICON), Global-scale Observations of the Limb and Disk (GOLD), Demonstration and Science Experiments (DSX), and Tool for the Analysis of RAdiations from lightNIngs and Sprites (TARANIS), as well as ongoing missions such as Magnetospheric Multiscale Mission (MMS).
Expansion of SuperDARN coverage
There are several plans to expand the reach of mid-latitude SuperDARN in both longitude and latitude. Some examples are the radars planned for several places in Europe. Construction of an HF radar at Jiamusi, China, has recently been completed while construction of an additional radar at Kunming in southern China is proceeding. There are also possibilities for the Russian SuperDARN-type radars to join the SuperDARN network in the future. Finally, there are plans to build a SuperDARN radar in the low-latitude and equatorial regions (possible candidates are southern Japan, Southeast Asia, Pacific Ocean etc.) to study the horizontal structure of the ionospheric convection and irregularities associated with equatorial plasma bubbles over distances of several thousand kilometers.
Interhemispheric conjugacy
Interhemispheric study of a variety of ionospheric phenomena such as SAPS is important for developing improved understanding of processes in the magnetosphere, and the connection between the magnetosphere and ionosphere. Conjugacy studies are also important for the study of ion-neutral coupling processes, e.g., to identify the dependence of TIDs on local time, geomagnetic/geographic latitude and season. The present sets of radars which could be used for such studies are (i) BKS (North America) and FIR (South America); (ii) HOK and HKW (Asia) and TIG, UNW, and BKP (Oceania).
Technical developments
There are several prospects for further technical development in terms of (1) hardware, (2) software, and (3) algorithms.
-
1.
Hardware: The BKP, which started operation in 2014, is the first fully digital SuperDARN radar and is much more sensitive than the pre-existing radars and much less susceptible to instrumental noise. The same digital radar system developed for BKP is now also running at the FIR site. Similarly, the University of Alaska, Fairbanks group has developed an “imaging” capability for the SuperDARN radar at KOD (Parris and Bristow 2009). Likewise, University of Saskatchewan engineers are currently working on designing a digital “imaging” radar which would replace consecutive sampling of the radar beams by simultaneous multi-directional measurements. This “imaging” will be achieved through illuminating the whole radar’s FOV by widening the main antenna lobe during transmission and recording raw data at each antenna so that the beam forming and data analysis are performed afterwards in software. This approach would decrease the sampling rate for the circulation maps from 1 to 2 min to several seconds and/or significantly improve the accuracy in estimating the echo parameters by increasing the ACF integration time. The “imaging” radar would also provide a continuous azimuthal coverage for studying ULF waves with periods smaller than 2 min (Pc4 and higher frequencies), which currently can only be studied using two to three beams in order to achieve a required sampling rate. Yet, another advantage will be the ability to simultaneously sound at multiple frequencies (real “stereo” mode).
-
2.
Software: The SuperDARN Data Analysis working group periodically releases updated versions of the Radar Software Toolkit (RST). The most recent version is RST 4.2 (SuperDARN Data Analysis Working Group 2018). The major recent improvements are (a) full revision of the ACF fitting package; (b) utilization of the latest statistical models (Cousins and Shepherd 2010; Thomas and Shepherd 2018) using multiple radar data in both hemispheres and the inclusion of data from polar and mid-latitudes versus the previous model (Ruohoniemi and Greenwald 1996) based on only one radar (GBR); (c) the Chisham virtual height model (Chisham et al. 2008) was added as option in addition to the original standard SuperDARN virtual height model, traditionally used to map radar data.
-
3.
Algorithm: A task force, led by Aurélie Marchaudon, has been formed to determine a reliable way of calibrating interferometry (elevation angle) data, including techniques utilizing low-elevation ground scatter (Ponomarenko et al. 2015), near-range (“meteor”) echoes (Chisham and Freeman 2013) and artificial irregularities generated by powerful radio waves (ionospheric “heating”) (Burrell et al. 2016).
Cooperation with modeling activities
Cooperation with theoretical modeling and numerical simulation activities is important for understanding the magnetosphere-ionosphere-thermosphere coupled system. This is especially true for the mid-latitude SuperDARN observations because during magnetic storms the contribution from the ring current becomes dominant (internal forcing), and the convection dynamics cannot be interpreted only in terms of the expansion of the high-latitude convection. As already discussed in the “Convection” Section, Fig. 14 shows one example of the coordinated study, a comparison between the SuperDARN HOK observations of SAPS structure indicating temporal changes (top panel) with simulation results from the CRCM under various boundary conditions (Ebihara et al. 2009). These results clearly indicate the importance of ring current dynamics in controlling the SAPS spatial structure. Additional model-data comparisons of this sort are needed to make further progress understanding the coupled dynamics of the inner magnetosphere and sub-auroral ionosphere. Finally, efforts to use SuperDARN data to constrain first-principle models of ionosphere, such as the Research Institute in Astrophysics and Planetology (IRAP) Plasmasphere-Ionosphere model (IPIM) (Marchaudon and Blelly 2015), are currently in progress and will lead to consistent retrieval of ionospheric parameters over large 3D coverage regions.
National strategy
Funding of each mid-latitude SuperDARN radar is closely related to the national strategy of the participant country.
In the USA, the most recent “Decadal Survey” report commissioned by the National Research Council identified four scientific goals for the space physics research community over the next 10 years. SuperDARN radars at mid-latitudes are particularly relevant to the second goal: to determine the dynamics and coupling of Earth’s magnetosphere, ionosphere, and atmosphere and their response to solar and terrestrial inputs. To meet these goals, the report recommends the creation of a new, integrated multiagency initiative—DRIVE—that will more effectively exploit NASA and NSF scientific assets to address the pressing needs for improved space weather specification and forecasts. The five directives comprising the DRIVE initiative are (1) diversify observing platforms with microsatellites and mid-scale ground-based assets, (2) realize scientific potential by sufficiently funding operations and data analysis, (3) integrate observing platforms and strengthen ties between agency disciplines, (4) venture forward with science centers and instrument and technology development, and (5) educate, empower, and inspire the next generation of space researchers. Much of the success of SuperDARN, to date, can be attributed to the fact that it was founded on the very same collaborative principles that underpin these five directives and, as such, it is uniquely positioned to play a key role in the development of the DRIVE initiative as it moves forward.
In Japan, the government has selected master plan projects and drawn up a roadmap of scientific research every few years, in order to identify future science directions. The project “Study of Coupling Processes in the Solar-Terrestrial System” was approved as a project of “Masterplan 2014” and “Masterplan 2017” by the Science Council of Japan, and of “Roadmap 2014” (one of 11 new approved projects) by the Ministry of Education, Culture, Sports, Science and Technology (MEXT). SuperDARN is related to this project in that it studies the coupling processes in the solar-terrestrial environment using several kinds of observation techniques, including HF radar network (Tsuda et al. 2016).
The UK government has identified severe space weather as a potential risk and has included this topic in its National Risk Register of Civil Emergencies (see https://www.gov.uk/government/publications/national-risk-register-of-civil-emergencies-2017-edition). SuperDARN is contributing to both the science and understanding of space weather and could in the future potentially contribute to operational systems. SuperDARN is also seen as a major contribution to national capability providing long-term and large-scale monitoring of the atmosphere through its Antarctic SuperDARN program. Finally, the UK is a major contributor to the joint European Space Agency (ESA) and Chinese National Space Science Centre (NSSC) space mission SMILE which is scheduled for launch in 2021, and SuperDARN is seen as a major ground-based contributor to that program. Other participating countries also have their national strategy for the future of space science, and some of them are related to the mid-latitude SuperDARN.
Training and public outreach
Construction and operation of mid-latitude SuperDARN radars is important not only for obtaining new scientific results, but also for attracting young students and training technical staff. Through the training activity, they can learn the engineering details of the radar system, characteristics of irregularities and HF wave propagation, and also the science of magnetosphere/ionosphere/upper atmosphere dynamics. Radars located where access is relatively easy provide ideal opportunities for hands-on engineering engagement. One example is that HOK and HKW in Japan has been used for training members of Japanese Antarctic Research Expedition (JARE) every year. Through the training activity, they can learn the engineering details of the radar system in advance. However, even for those radars located in remote locations, the routine data analysis/processing and software development activities provide excellent opportunities for education and training.
For the continued operation and maintenance of the mid-latitude SuperDARN radars, it is crucial that relevant government agencies and the general public understand the value they provide for basic research and space weather applications (e.g., Jansen and Pirjola 2004). It is also important that researchers in other fields outside space science understand SuperDARN. For this purpose, public releases of radar operations and new scientific findings in the most effective ways are necessary (Wild 2012).
Change history
30 July 2019
After publication of this article (Nishitani et al. 2019), it was brought to our attention that the figure 5 is incorrect, where the positions of DCE and SPS were misplaced. The correct figure 5 is as below, the original publication has been corrected.
Abbreviations
- AACGM:
-
Altitude-Adjusted Corrected Geomagnetic
- ACF:
-
Autocorrelation function
- AGW:
-
Acoustic-gravity wave
- AMPTE CCE:
-
Active Magnetospheric Particle Tracer Explorers Charge Composition Explorer
- AWFC:
-
Auroral Westward Flow Channel
- BBFs:
-
Bursty bulk flows
- BCOV:
-
Beaver Cove
- CME:
-
Coronal mass ejection
- CRCM:
-
Comprehensive ring current model
- DSX:
-
Demonstration and Science Experiments
- DUSE:
-
Dusk scatter event
- EKB:
-
Ekaterinburg
- EPB:
-
Electron precipitation boundary
- ERG:
-
Exploration of energization and Radiation in Geospace
- ESA:
-
European Space Agency
- FAC:
-
Field-aligned current
- FFT:
-
Fast Fourier transform
- FLR:
-
Field line resonance
- FOV:
-
Field of view
- FPI:
-
Fabry-Perot interferometer
- FTEs:
-
Flux-transfer events
- GDI:
-
Gradient drift instability
- GEONET:
-
GPS Earth Observation Network System
- GNSS:
-
Global Navigation Satellite System
- GOLD:
-
Global-scale Observations of the Limb and Disk
- GPS:
-
Global positioning system
- GS:
-
Ground scatter
- HAIR:
-
High-aspect angle irregularity region
- HF:
-
High frequency
- HOP:
-
Hokkaido Pair of Radars
- HWM:
-
Horizontal Wind Model
- ICON:
-
Ionospheric Connection Explorer
- IGRF:
-
International Geomagnetic Reference Field
- IMAGE:
-
International Monitor for Auroral Geomagnetic Effects
- IMF:
-
Interplanetary magnetic field
- IRAP:
-
Research Institute in Astrophysics and Planetology
- IRI:
-
International Reference Ionosphere
- IS:
-
Ionospheric scatter
- ISEE:
-
Institute for Space-Earth Environmental Research
- ISR:
-
Incoherent scatter radar
- JARE:
-
Japanese Antarctic Research Expedition
- JSPS:
-
Japan Society for the Promotion of Science
- KHI:
-
Kelvin-Helmholtz instability
- LANL:
-
Los Alamos National Laboratory
- LEO:
-
Low Earth Orbit
- LOS:
-
Line-of-sight
- LSTID:
-
Large-scale traveling ionospheric disturbance
- LT:
-
Local time
- MEXT:
-
Ministry of Education, Culture, Sports, Science and Technology
- MF:
-
Medium frequency
- MHD:
-
Magnetohydrodynamic
- MI:
-
Magnetosphere-ionosphere
- MLAT:
-
Geomagnetic latitude
- MLT:
-
Magnetic local time
- MMS:
-
Magnetospheric Multiscale Mission
- MSEs:
-
Mesosphere summer echoes
- MSI:
-
Mid-sized infrastructure
- MSTID:
-
Medium-scale traveling ionospheric disturbance
- MU:
-
Middle and upper atmosphere
- MUF:
-
Maximum usable frequency
- NASA:
-
National Aeronautics and Space Administration
- NSF:
-
National Science Foundation
- NSSC:
-
National Space Science Centre
- OTH:
-
Over the horizon
- PBIs:
-
Poleward boundary intensifications
- PCR:
-
Plasmaspheric cavity resonance
- PI:
-
Principal investigator
- PIC:
-
Particle-in-cell
- PJ:
-
Polarization jet
- PMSE:
-
Polar mesosphere summer echoes
- PPEF:
-
Prompt penetration electric field
- PVR:
-
Plasmaspheric virtual resonance
- PWING:
-
Study of dynamical variation of Particles and Waves in the INner magnetosphere using Ground-based network observations RST: Radar Software Toolkit
- SAEF:
-
Sub-auroral electric field
- SAIDs:
-
Sub-auroral ion drifts
- SAIS:
-
Sub-auroral ionospheric scatter
- SAPS:
-
Sub-auroral polarization streams
- SAPSWS:
-
SAPS wave structure
- SARAS:
-
Substorm-associated radar auroral surges
- SC:
-
Sudden commencement
- SCW:
-
Substorm current wedge
- SED:
-
Storm-enhanced density
- SI:
-
Sudden impulse
- SMILE:
-
Solar-wind Magnetosphere Ionosphere Link Explorer
- SSC:
-
Storm sudden commencement
- SuperDARN:
-
Super Dual Auroral Radar Network
- TARANIS:
-
Tool for the Analysis of RAdiations from lightNIngs and Sprites
- TCVs:
-
Traveling convection vortices
- TEC:
-
Total electron content
- TECU:
-
TEC unit
- TGI:
-
Temperature gradient instability
- THEMIS:
-
Time History of Events and Macroscale Interactions during Substorms
- TIDs:
-
Traveling ionospheric disturbances
- TIGER:
-
Tasman International Geospace Environment Radar
- TOI:
-
Tongue of ionization
- TTFD:
-
Twin Terminated folded Dipole
- ULF:
-
Ultra-low frequency
- UT:
-
Universal Time
- VHF:
-
Very high frequency
- WSA:
-
Weddell Sea Anomaly
References
Afraimovich EL, Edemskiy IK, Leonovich AS, Leonovich LA, Voeykov SV, Yasyukevich YV (2009) MHD nature of night-time MSTIDs excited by the solar terminator. Geophys Res Lett 36:L15106. https://doi.org/10.1029/2009GL039803
Anderson BJ, Engebretson MJ, Rounds SP, Zanetti LJ, Potemra TA (1990) A statistical study of Pc 3–5 pulsations observed by the AMPTE/CCE magnetic fields experiment, 1. Occurrence distributions. J Geophys Res 95:10495. https://doi.org/10.1029/JA095iA07p10495
Anderson PC, Carpenter DL, Tsuruda K, Mukai T, Rich FJ (2001) Multisatellite observations of rapid subauroral ion drifts (SAID). J Geophys Res 106(A12):29585–29599. https://doi.org/10.1029/2001JA000128
Anderson PC, Hanson WB, Heelis RA, Craven JD, Baker DN, Frank LA (1993) A proposed production model of rapid subauroral ion drifts and their relationship to substorm evolution. J Geophys Res 98(A4):6069–6078. https://doi.org/10.1029/92JA01975
Anderson PC, Heelis RA, Hanson WB (1991) The ionospheric signatures of rapid subauroral ion drifts. J Geophys Res 96(A4):5785–5792. https://doi.org/10.1029/90JA02651
Angelopoulos V (2008) The THEMIS Mission. Space Sci Rev 141:5–34. https://doi.org/10.1007/s11214-008-9336-1
Araki T (1977) Global structure of geomagnetic sudden commencements. Planet Space Sci 25:373–384. https://doi.org/10.1016/0032-0633(77)90053-8
Araki T, Fujitani S, Emoto M, Yumoto K, Shiokawa K, Ichinose T, Luehr H, Orr D, Milling DK, Singer H, Rostoker G, Tsunomura S, Yamada Y, Liu CF (1997) Anomalous sudden commencement on March 24, 1991. J Geophys Res 102:14075–14086. https://doi.org/10.1029/96JA03637
Baker JBH, Greenwald RA, Ruohoniemi JM, Oksavik K, Gjerloev JW, Paxton LJ, Hairston MR (2007) Observations of ionospheric convection from the Wallops SuperDARN radar at middle latitudes. J Geophys Res 112:A01303. https://doi.org/10.1029/2006JA011982
Baker KB, Wing S (1989) A new magnetic coordinate system for conjugate studies at high latitudes. J Geophys Res 94(A7):9139–9143. https://doi.org/10.1029/JA094iA07p09139
Barraclough DR (1987) International geomagnetic reference field: the fourth generation. Phys Earth Planet Inter 48:279–292. https://doi.org/10.1016/0031-9201(87)90150-6
Bender LC, Leslie LM (1994) Evaluation of a Third Generation Ocean Wave Model for the Australian Region. BMRC Research Report No 43 Australian Bureau of Meteorology
Berngardt OI, Perevalova NP, Dobrynina AA, Kutelev KA, Shestakov NV, Bakhtiarov VF, Kusonsky OA, Zagretdinov RV, Zherebtsov GA (2015) Toward the azimuthal characteristics of ionospheric and seismic effects of “Chelyabinsk” meteorite fall according to the data from coherent radar, GPS, and seismic networks. J Geophys Res Space Physics 120:10754–10771. https://doi.org/10.1002/2015JA021549
Berngardt OI, Ruohoniemi JM, Nishitani N, Shepherd SG, Bristow WA, Miller ES (2018) Attenuation of decameter wavelength sky noise during x-ray solar flares in 2013-2017 based on the observations of midlatitude radars. J Atmos Sol Terr Phys 173:1–13 https://doi.org/10.1016/j.jastp.2018.03.022
Bilitza D, Altadill D, Zhang Y, Mertens C, Truhlik V, Richards P, McKinnell LA, Reinisch B (2014) The International Reference Ionosphere 2012 – a model of international collaboration. J Space Weather Space Clim 4:A07. https://doi.org/10.1051/swsc/2014004
Blanc M, Richmond A (1980) The ionospheric disturbance dynamo. J Geophys Res 85(A4):1669–1686. https://doi.org/10.1029/JA085iA04p01669
Blanchard GT, Sundeen S, Baker KB (2009) Probabilistic identification of high- frequency radar backscatter from the ground and ionosphere based on spectral characteristics. Radio Sci 44:RS5012. https://doi.org/10.1029/2009RS004141
Bland EC, McDonald AJ, de Larquier S, Devlin JC (2014) Determination of ionospheric parameters in real time using SuperDARN HF radars. J Geophys Res Space Physics 119:5830–5846. https://doi.org/10.1002/2014JA020076
Boudouridis A, Lyons LR, Zesta E, Ruohoniemi JM (2007) Dayside reconnection enhancement resulting from a solar wind dynamic pressure increase. J Geophys Res 112:A06201. https://doi.org/10.1029/2006JA012141
Boudouridis A, Lyons LR, Zesta E, Weygand JM, Ribeiro AJ, Ruohoniemi JM (2011) Statistical study of the effect of solar wind dynamic pressure fronts on the dayside and nightside ionospheric convection. J Geophys Res 116:A10233. https://doi.org/10.1029/2011JA016582
Bristow WA, Greenwald RA, Villain JP (1996) On the seasonal dependence of medium-scale atmospheric gravity waves in the upper atmosphere at high latitudes. J Geophys Res 101(A7):15685–15699. https://doi.org/10.1029/96JA01010
Burrell AG, Yeoman TK, Milan SE, Lester M (2016) Phase calibration of interferometer arrays at high-frequency radars. Radio Sci 51:1445–1456. https://doi.org/10.1002/2016RS006089
Carbary JF (2005) A Kp-based model of auroral boundaries. Space Weather 3(10):20001. https://doi.org/10.1029/2005SW000162
Carter BA, Makarevich RA (2009) E region decameter-scale plasma waves observed by the dual TIGER HF radars. Ann Geophys 27:261–278. https://doi.org/10.5194/angeo-27-261-2009
Carter BA, Makarevich RA (2010) On the diurnal variation of the E-region coherent HF echo occurrence. J Atmos Solar Terr Phys 72:570–582. https://doi.org/10.1016/j.jastp.2010.02.004
Chakraborty S, Ruohoniemi JM, Baker JBH, Nishitani N (2018) Characterization of short-wave fadeout seen in daytime SuperDARN ground scatter observations. Radio Sci 53(4):472–484 https://doi.org/10.1002/2017RS006488
Chisham G, Freeman MP (2013) A reassessment of SuperDARN meteor echoes from the upper mesosphere and lower thermosphere. J Atmos Sol Terr Phys 102:207–221 https://doi.org/10.1016/j.jastp.2013.05.018
Chisham G, Lester M, Milan SE, Freeman MP, Bristow WA, Grocott A, McWilliams KA, Ruohoniemi JM, Yeoman TK, Dyson PL, Greenwald RA, Kikuchi T, Pinnock M, Rash JPS, Sato N, Sofko GJ, Villain J-P, Walker ADM (2007) A decade of the Super Dual Auroral Radar Network (SuperDARN): scientific achievements, new techniques and future directions. Surv Geophys 28:33 https://doi.org/10.1007/s10712-007-9017-8
Chisham G, Orr D, Yeoman TK (1992) Observations of a giant pulsation across an extended array of ground magnetometers and on auroral radar. Planet Space Sci 40:953–964. https://doi.org/10.1016/0032-0633(92)90135-B
Chisham G, Pinnock M, Rodger AS, Villain J-P (2000) High-time resolution conjugate SuperDARN radar observations of the dayside convection response to changes in IMF By. Ann Geophys 18:191–201. https://doi.org/10.1007/s00585-000-0191-y
Chisham G, Yeoman TK, Sofko GJ (2008) Mapping ionospheric backscatter measured by the SuperDARN HF radars – part 1: a new empirical virtual height model. Ann Geophys 26:823–841. https://doi.org/10.5194/angeo-26-823-2008
Clausen LBN, Ruohoniemi JM, Greenwald RA, Thomas EG, Shepherd SG, Talaat ER, Bristow WA, Zheng Y, Coster AJ, Sazykin S (2012) Large-scale observations of a subauroral polarization stream by midlatitude SuperDARN radars: instantaneous longitudinal velocity variations. J Geophys Res 117:A05306. https://doi.org/10.1029/2011JA017232
Coco I, Amata E, Marcucci MF, Ambrosino D, Villain J-P, Hanuise C (2008) The effects of an interplanetary shock on the high-latitude ionospheric convection during an IMF By-dominated period. Ann Geophys 26:2937–2951. https://doi.org/10.5194/angeo-26-2937-2008
Cousins EDP, Shepherd SG (2010) A dynamical model of high-latitude convection derived from SuperDARN plasma drift measurements. J Geophys Res 115:A12329. https://doi.org/10.1029/2010JA016017
Crowley G, Rodrigues FS (2012) Characteristics of traveling ionospheric disturbances observed by the TIDDBIT sounder. Radio Sci 47:RS0L22. https://doi.org/10.1029/2011RS004959
Currie JL, Waters CL, Menk FW, Sciffer MD, Bristow WA (2016) SuperDARN backscatter during intense geomagnetic storms. Radio Sci 51:814–825. https://doi.org/10.1002/2016RS005960
de Larquier S, Eltrass A, Mahmoudian A, Ruohoniemi JM, Baker JBH, Scales WA, Erickson PJ, Greenwald RA (2014) Investigation of the temperature gradient instability as the source of midlatitude quiet time decameter-scale ionospheric irregularities:1.Observations. J Geophys Res Space Physics 119:4872–4881. https://doi.org/10.1002/2013JA019643
de Larquier S, Ponomarenko P, Ribeiro AJ, Ruohoniemi JM, Baker JBH, Sterne KT, Lester M (2013) On the spatial distribution of decameter-scale subauroral ionospheric irregularities observed by SuperDARN radars. J Geophys Res Space Physics 118:5244–5254. https://doi.org/10.1002/jgra.50475
de Larquier S, Ruohoniemi JM, Baker JBH, Ravindran-Varrier N, Lester M (2011) First observations of the midlatitude evening anomaly using Super Dual Auroral Radar Network (SuperDARN) radars. J Geophys Res 116:A10321. https://doi.org/10.1029/2011JA016787
Ding F, Wan W, Liu L, Afraimovich EL, Voeykov SV, Perevalova NP (2008) A statistical study of large-scale traveling ionospheric disturbances observed by GPS TEC during major magnetic storms over the years 2003–2005. J Geophys Res 113:A00A01. https://doi.org/10.1029/2008JA013037
Ding F, Wan W, Xu G, Yu T, Yang G, Wang J (2011) Climatology of medium-scale traveling ionospheric disturbances observed by a GPS network in Central China. J Geophys Res 116:A09327. https://doi.org/10.1029/2011JA016545
Drob DP, Emmert JT, Crowley G, Picone JM, Shepherd GG, Skinner W, Hays P, Niciejewski RJ, Larsen M, She CY, Meriwether JW, Hernandez G, Jarvis MJ, Sipler DP, Tepley CA, O’Brien MS (2008) An empirical model of the Earth's horizontal wind fields: HWM07. J Geophys Res 113:A12304. https://doi.org/10.1029/2008JA013668
Ducic V, Artru J, Lognonné P (2003) Ionospheric remote sensing of the Denali Earthquake Rayleigh surface waves. Geophys Res Lett 30:1951. https://doi.org/10.1029/2003GL017812
Duly TM, Chapagain NP, Makela JJ (2013) Climatology of nighttime medium-scale traveling ionospheric disturbances (MSTIDs) in the Central Pacific and South American sectors. Ann Geophys 31:2229–2237 https://doi.org/10.5194/angeo-31-2229-2013
Ebihara Y, Nishitani N, Kikuchi T, Ogawa T, Hosokawa K, Fok M (2008) Two-dimensional observations of overshielding during a magnetic storm by the Super Dual Auroral Radar Network (SuperDARN) Hokkaido radar. J Geophys Res 113:A01213. https://doi.org/10.1029/2007JA012641
Ebihara Y, Nishitani N, Kikuchi T, Ogawa T, Hosokawa K, Fok M-C, Thomsen MF (2009) Dynamical property of storm time subauroral rapid flows as a manifestation of complex structures of the plasma pressure in the inner magnetosphere. J Geophys Res 114:A01306. https://doi.org/10.1029/2008JA013614
Ebihara Y, Tanaka T, Kikuchi T (2014) Counter equatorial electrojet and overshielding after substorm onset: Global MHD simulation study. J Geophys Res 119:7281–7296. https://doi.org/10.1002/2014JA020065
Eltrass A, Mahmoudian A, Scales WA, de Larquier S, Ruohoniemi JM, Baker JBH, Greenwald RA, Erickson PJ (2014) Investigation of the temperature gradient instability as the source of midlatitude quiet time decameter-scale ionospheric irregularities: 2. Linear analysis. J Geophys Res Space Physics 119:4882–4893. https://doi.org/10.1002/2013JA019644
Eltrass A, Scales WA, Erickson PJ, Ruohoniemi JM, Baker JBH (2016) Investigation of the role of plasma wave cascading processes in the formation of midlatitude irregularities utilizing GPS and radar observations. Radio Sci 51. https://doi.org/10.1002/2015RS005790
Erickson PJ, Beroz F, Miskin MZ (2011) Statistical characterization of the American sector subauroral polarization stream using incoherent scatter radar. J Geophys Res 116:A00J21. https://doi.org/10.1029/2010JA015738
Erickson PJ, Foster JC, Holt JM (2002) Inferred electric field variability in the polarization jet from Millstone Hill E region coherent scatter observations. Radio Sci 37(2):1027. https://doi.org/10.1029/2000RS002531
Fairfield DH (1969) Bow shock associated waves observed in the far upstream interplanetary medium. J Geophys Res 74:3541–3553. https://doi.org/10.1029/JA074i014p03541
Fejer BG, Kelley MC (1980) Ionospheric irregularities. Rev Geophys 18(2):401–454. https://doi.org/10.1029/RG018i002p00401
Fiori RAD, Boteler DH, Koustov AV (2012) Response of ionospheric convection to sharp southward IMF turnings inferred from magnetometer and radar data. J Geophys Res 117:A09302. https://doi.org/10.1029/2012JA017755
Fiori RAD, Boteler DH, Koustov AV, Haines GV, Ruohoniemi JM (2010) Spherical cap harmonic analysis of Super Dual Auoral Radar Network (SuperDARN) observations for generating maps of ionospheric convection. J Geophys Res 115:A07307. https://doi.org/10.1029/2009JA015055
Fiori RAD, Koustov AV, Chakraborty S, Ruohoniemi JM, Danskin DW, Boteler DH, Shepherd SG (2018) Examining the potential of the Super Dual Auroral Radar Network for monitoring the space weather impact of solar X-ray flares. Space Weather 16(9):1348–1362 https://doi.org/10.1029/2018SW001905
Foster JC, Burke WJ (2002) SAPS: a new categorization for sub-auroral electric fields. EOS Trans Am Geophys Union 83:393. https://doi.org/10.1029/2002EO000289
Foster JC, Coster AJ, Erickson PJ, Holt JM, Lind FD, Rideout W, McCready M, van Eyken A, Barnes RJ, Greenwald RA, Rich FJ (2005) Multiradar observations of the polar tongue of ionization. J Geophys Res Space Physics 110. https://doi.org/10.1029/2004JA010928
Foster JC, Erickson PJ, Lind FD, Rideout W (2004) Millstone Hill coherent-scatter radar observations of electric field variability in the sub-auroral polarization stream. Geophys Res Lett 31:L21803. https://doi.org/10.1029/2004GL021271
Foster JC, Vo HB (2002) Average characteristics and activity dependence of the subauroral polarization stream. J Geophys Res 107(A12):1475. https://doi.org/10.1029/2002JA009409
Freeman MP, Southwood DJ, Lester M, Yeoman TK, Reeves GD (1992) Substorm-associated radar auroral surges. J Geophys Res 97:12173. https://doi.org/10.1029/92JA00697
Friis-Christensen E, McHenry MA, Clauer CR, Vennerstrøm S (1988) Ionospheric traveling convection vortices observed near the polar cleft: a triggered response to sudden changes in the solar wind. Geophys Res Lett 15(3):253–256. https://doi.org/10.1029/GL015i003p00253
Frissell NA, Baker JBH, Ruohoniemi JM, Clausen LBN, Kale ZC, Rae IJ, Kepko L, Oksavik K, Greenwald RA, West ML (2011) First radar observations in the vicinity of the plasmapause of pulsed ionospheric flows generated by bursty bulk flows. Geophys Res Lett 38:L01103. https://doi.org/10.1029/2010GL045857
Frissell NA, Baker JBH, Ruohoniemi JM, Gerrard AJ, Miller ES, Marini JP, West ML, Bristow WA (2014) Climatology of medium-scale traveling ionospheric disturbances observed by the midlatitude Blackstone SuperDARN radar. J Geophys Res Space Physics 119:7679–7697. https://doi.org/10.1002/2014JA019870
Frissell NA, Baker JBH, Ruohoniemi JM, Greenwald RA, Gerrard AJ, Miller ES, West ML (2016) Sources and characteristics of medium-scale traveling ionospheric disturbances observed by high-frequency radars in the North American sector. J Geophys Res Space Physics 121:3722–3739. https://doi.org/10.1002/2015JA022168
Gallardo-Lacourt B, Nishimura Y, Lyons LR, Ruohoniemi JM, Donovan E, Angelopoulos V, McWilliams KA, Nishitani N (2014b) Ionospheric flow structures associated with auroral beading at substorm auroral onset. J Geophys Res Space Physics 119:9150–9159. https://doi.org/10.1002/2014JA020298
Gallardo-Lacourt B, Nishimura Y, Lyons LR, Zou S, Angelopoulos V, Donovan E, McWilliams KA, Ruohoniemi JM, Nishitani N (2014a) Coordinated SuperDARN THEMIS ASI observations of mesoscale flow bursts associated with auroral streamers. J Geophys Res Space Physics 119:142–150. https://doi.org/10.1002/2013JA019245
Galperin YI, Pomomarev YN, Zosimova AG (1973) Direct measurements of ion drift velocity in the upper ionosphere during a magnetic storm, 2. Results of measurements during the November 3, 1967 magnetic storm. Cosm Res (in Russian) 11:283–292
Gauld JK, Yeoman TK, Davies JA, Milan SE, Honary F (2002) SuperDARN HF propagation and absorption response to the substorm expansion phase. Ann Geophys 20:1631–1645. https://doi.org/10.5194/angeo-20-1631-2002
Gillies RG, Hussey GC, Sofko GJ, McWilliams KA (2012) A statistical analysis of SuperDARN scattering volume electron densities and velocity corrections using a radar frequency shifting technique. J Geophys Res 117:A08320. https://doi.org/10.1029/2012JA017866
Gjerloev JW, Greenwald RA, Waters CL, Takahashi K, Sibeck D, Oksavik K, Barnes R, Baker J, Ruohoniemi JM (2007) Observations of Pi2 pulsations by the Wallops HF radar in association with substorm expansion. Geophys Res Lett 34:L20103. https://doi.org/10.1029/2007GL030492
Glassmeier K-H, Hönisch M, Untiedt J (1989) Ground-based and satellite observations of traveling magnetospheric convection twin vortices. J Geophys Res 94(A3):2520–2528. https://doi.org/10.1029/JA094iA03p02520
Greenwald RA, Baker KB, Dudeney JD, Pinnock M, Jones TB, Thomas EC, Villain J-PCJ-C, Senior C, Hanuise C, Hunsucker RD, Sofko G, Koehler J, Nielsen E, Pellinen R, Walker ADM, Sato N, Yamagishi H (1995) DARN/SuperDARN: a global view of the dynamics of high-latitude convection. Space Sci Rev 71:761–796. https://doi.org/10.1007/BF00751350
Greenwald RA, Frissell N, de Larquier S (2017) The importance of elevation angle measurements in HF radar investigations of the ionosphere. Radio Sci 52:305–320. https://doi.org/10.1002/2016RS006186
Greenwald RA, Oksavik K, Barnes R, Ruohoniemi JM, Baker JBH, Talaat ER (2008) First radar measurements of ionospheric electric fields at sub-second temporal resolution. Geophys Res Lett 35:L03111. https://doi.org/10.1029/2007GL032164
Greenwald RA, Oksavik K, Erickson PJ, Lind FD, Ruohoniemi JM, Bake JBH, Gjerloev JW (2006) Identification of the temperature gradient instability as the source of decameter-scale ionospheric irregularities on plasmapause field lines. Geophys Res Lett 33:L18105. https://doi.org/10.1029/2006GL026581
Greenwood RI, Parkinson ML, Dyson PL, Schulz EW (2011) Dominant Ocean wave direction measurements using the TIGER SuperDARN systems. J Atmos Sol Terr Phys 73(16):2379–2385. https://doi.org/10.1016/j.jastp.2011.08.006
Grocott A, Hosokawa K, Ishida T, Lester M, Milan SE, Freeman MP, Sato N, Yukimatu AS (2013) Characteristics of medium-scale traveling ionospheric disturbances observed near the Antarctic Peninsula by HF radar. J Geophys Res Space Physics 118:5830–5841. https://doi.org/10.1002/jgra.50515
Grocott A, Milan SE, Baker JBH, Freeman MP, Lester M, Yeoman TK (2011) Dynamic subauroral ionospheric electric fields observed by the Falkland Islands radar during the course of a geomagnetic storm. J Geophys Res 116:A11202. https://doi.org/10.1029/2011JA016763
Gurevich AV, Borisov ND, Zybin KP (1997) Ionospheric turbulence induced in the lower part of the E region by the turbulence of the neutral atmosphere. J Geophys Res 102:379–388. https://doi.org/10.1029/96JA00163
Hall GE, MacDougall JW, Moorcroft DR, St-Maurice J-P, Manson AH, Meek CR (1997) Super Dual Auroral Radar Network observations of meteor echoes. J Geophys Res 102:14603–14624. https://doi.org/10.1029/97JA00517
Hayashi H, Nishitani N, Ogawa T, Otsuka Y, Tsugawa T, Hosokawa K, Saito A (2010) Large-scale traveling ionospheric disturbance observed by SuperDARN Hokkaido HF radar and GPS networks on 15 December 2006. J Geophys Res 115:A06309. https://doi.org/10.1029/2009JA014297
He L-S, Dyson PL, Parkinson ML, Wan W (2004) Studies of medium scale travelling ionospheric disturbances using TIGER SuperDARN radar sea echo observations. Ann Geophys 22:4077–4088 https://doi.org/10.5194/angeo-22-4077-2004
Hibbins RE, Freeman MP, Milan SE, Ruohoniemi JM (2011) Winds and tides in the midlatitude Southern Hemisphere upper atmosphere recorded with the Falkland Islands SuperDARN radar. Ann Geophys 29:1985–1996 https://doi.org/10.5194/angeo-29-1985-2011
Hocke K, Schlegel K (1996) A review of atmospheric gravity waves and traveling ionospheric disturbances: 1982–1995. Ann Geophys 14:917–940 https://doi.org/10.1007/s00585-996-0917-6
Holzworth RH, Meng C-I (1975) Mathematical representation of the auroral oval. Geophys Res Lett 2 (9):377-380. https://doi.org/10.1029/GL002i009p00377.
Hori T, Shinbori A, Fujita S, Nishitani N (2015) IMF-By dependence of transient ionospheric flow perturbation associated with sudden impulses: SuperDARN observations. Earth Planets Space 67:190. https://doi.org/10.1186/s40623-015-0360-6
Hori T, Shinbori A, Nishitani N, Kikuchi T, Fujita S, Nagatsuma T, Troshichev O, Yumoto K, Moiseyev A, Seki K (2012) Evolution of negative SI-induced ionospheric flows observed by SuperDARN King Salmon HF radar. J Geophys Res 117:A12223. https://doi.org/10.1029/2012JA018093
Horvath I, Essex EA (2003) The Weddell Sea Anomaly observed with the Topex satellite data. J Atmos Solar Terr Phys 65:693–706. https://doi.org/10.1016/S1364-6826(03)00083-X
Hosokawa K, Iyemori T, Yukimatu AS, Sato N (2001) Source of field-aligned irregularities in the subauroral F region as observed by the SuperDARN radars. J Geophys Res 106:24713. https://doi.org/10.1029/2001JA900080
Hosokawa K, Nishitani N (2010) Plasma irregularities in the duskside subauroral ionosphere as observed with midlatitude SuperDARN radar in Hokkaido, Japan. Radio Sci 45:RS4003. https://doi.org/10.1029/2009RS004244
Hosokawa K, Ogawa T, Arnold N, Lester M, Sato N, Yukimatu (2005) Extraction of polar mesosphere summer echoes from SuperDARN data. Geophys Res Lett 32:L12801. https://doi.org/10.1029/2005GL022788
Hosokawa K, Tsugawa T, Shiokawa K, Otsuka Y, Nishitani N, Ogawa T, Hairston MR (2010) Dynamic temporal evolution of polar cap tongue of ionization during magnetic storm. J Geophys Res Space Physics 115:A12333. https://doi.org/10.1029/2010JA015848
Huang C, Sazykin S, Spiro R, Goldstein J, Crowley G, Ruohoniemi JM (2006) Storm-time penetration electric fields and their effects. EOS 87:131–132. https://doi.org/10.1029/2006EO130005
Hughes JM, Bristow WA, Greenwald RA, Barnes RJ (2002) Determining characteristics of HF communications links using SuperDARN. Ann Geophys 20:1023–1030. https://doi.org/10.5194/angeo-20-1023-2002
Hughes WJ (1994) Magnetospheric ULF waves: a tutorial with a historic perspective. Solar wind sources of magnetospheric ultra-low frequency waves. Geophys Monogr Ser 81:1–11 eds Engebretson MJ, Takahashi K, Scholer M, AGU Washington DC. https://doi.org/10.1029/GM081p0001
Hunsucker RD (1982) Atmospheric gravity waves generated in the high latitude ionosphere: a review. Rev Geophys Space Phys 20:293–315. https://doi.org/10.1029/RG020i002p00293
Ichihara A, Nishitani N, Ogawa T, Tsugawa T (2013) Northward-propagating nighttime medium-scale traveling ionospheric disturbances observed with SuperDARN Hokkaido HF radar and GEONET. Adv Polar Sci 24:42–49. https://doi.org/10.3724/SP.J.1085.2013.00042
Ishida T, Hosokawa K, Shibata T, Suzuki S, Nishitani N, Ogawa T (2008) SuperDARN observations of daytime MSTIDs in the auroral and midlatitudes: possibility of long-distance propagation. Geophys Res Lett 35:L13102. https://doi.org/10.1029/2008GL034623
Jansen F, Pirjola R (2004) Space weather research elucidates risks to technological infrastructure. EOS 85(25):241, 245–246. https://doi.org/10.1029/2004EO250002
Jones RM, Stephenson JJ (1975) A versatile three-dimensional ray tracing computer program for radio waves in the ionosphere. OT Rep 75–76.PB2488567 US Dept of Comm, Washington DC
Joshi PP, Baker JBH, Ruohoniemi JM, Makela JJ, Fisher DJ, Harding BJ, Frissell NA, Thomas EG (2015) Observations of storm time midlatitude ion-neutral coupling using SuperDARN radars and NATION Fabry-Perot interferometers. J Geophys Res Space Physics 120:8989–9003. https://doi.org/10.1002/2015JA021475
Kane TA, Makarevich RA (2010) HF radar observations of the F region ionospheric plasma response to storm sudden commencements. J Geophys Res 115:A07320. https://doi.org/10.1029/2009JA014974
Kane TA, Makarevich RA, Devlin JC (2012) HF radar observations of ionospheric backscatter during geomagnetically quiet periods. Ann Geophys 30(1):221–233. https://doi.org/10.5194/angeo-30-221-2012
Karlsson T, Marklund GT, Blomberg LG, Mälkki A (1998) Subauroral electric fields observed by the Freja satellite: a statistical study. J Geophys Res 103:4327. https://doi.org/10.1029/97JA00333
Kataoka R, Hosokawa K, Nishitani N, Miyoshi Y (2009) SuperDARN Hokkaido radar observation of westward flow enhancement in subauroral latitudes. Ann Geophys 27:1695–1699. https://doi.org/10.5194/angeo-27-1695-2009
Kataoka R, Nishitani N, Ebihara Y, Hosokawa K, Ogawa T, Kikuchi T, Miyoshi Y (2007) Dynamic variations of a convection flow reversal in the subauroral postmidnight sector as seen by the SuperDARN Hokkaido HF radar. Geophys Res Lett 34:L21105. https://doi.org/10.1029/2007GL031552
Kawano H, Yukimatu AS, Tanaka Y, Saita S, Nishitani N, Hori T (2016) SC-triggered 1.6 mHz waves including an interval with latitude-dependent phase shift observed by the SuperDARN Hokkaido east radar in mid latitudes: possible global ionospheric cavity-mode waves and their field-line resonance with poloidal Alfven-mode waves. Mem Fac Sci Kyushu Univ Ser D Earth Planet Sci XXXIV:1–15
Kelley MC (2011) On the origin of mesoscale TIDs at midlatitudes. Ann Geophys 29(2):361–366 https://doi.org/10.5194/angeo-29-361-2011
Kelley MC, Fejer BG, Gonzales CA (1979) An explanation for anomalous equatorial ionospheric electric fields associated with a northward turning of the interplanetary magnetic field. Geophys Res Lett 6:301–304. https://doi.org/10.1029/GL006i004p00301
Kikuchi T, Ebihara Y, Hashimoto KK, Kataoka R, Hori T, Watari S, Nishitani N (2010) Penetration of the convection and overshielding electric fields to the equatorial ionosphere during a quasiperiodic DP 2 geomagnetic fluctuation event. J Geophys Res 115:A05209. https://doi.org/10.1029/2008JA013948
Killeen TL, Hays PB, Carignan GR, Heelis RA, Hanson WB, Spencer NW, Brace LH (1984) Ion-neutral coupling in the high-latitude F region: evaluation of ion heating terms from Dynamics Explorer 2. J Geophys Res 89(A9):7495–7508. https://doi.org/10.1029/JA089iA09p07495
Kim K-H, Lee D-H, Shiokawa K, Lee E, Park J-S, Kwon H-J, Angelopoulos V, Park Y-D, Hwang J, Nishitani N, Hori T, Koga K, Obara T, Yumoto K, Baishev DG (2012) Magnetospheric responses to the passage of the interplanetary shock on 24 November 2008. J Geophys Res 117:A10209. https://doi.org/10.1029/2012JA017871
Kim S-I, Kim K-H, Kwon H-J, Jin H, Lee E, Jee G, Nishitani N, Hori T, Lester M, Wygant JR (2017) SC-associated electric field variations in the magnetosphere and ionospheric convective flows. J Geophys Res Space Physics 122:11044–11057. https://doi.org/10.1002/2017JA024611
Kotake N, Otsuka Y, Ogawa T, Tsugawa T, Saito A (2007) Statistical study of medium-scale traveling ionospheric disturbances observed with the GPS networks in Southern California. Earth Planets Space 59(2):95–102. https://doi.org/10.1186/BF03352681
Kotake N, Otsuka Y, Tsugawa T, Ogawa T, Saito A (2006) Climatological study of GPS total electron content variations caused by medium-scale traveling ionospheric disturbances. J Geophys Res 111:A04306. https://doi.org/10.1029/2005JA011418
Koustov AV, Drayton RA, Makarevich RA, McWilliams KA, St-Maurice J-P, Kikuchi T, Frey HU (2006) Observations of high-velocity SAPS-like flows with the King Salmon SuperDARN radar. Ann Geophys 24:1591–1608. https://doi.org/10.5194/angeo-24-1591-2006
Koustov AV, Nishitani N, Ebihara Y, Kikuchi T, Hairston MR, Andrè D (2008) Subauroral polarization streams: observations with the Hokkaido and King Salmon SuperDARN radars and modeling. Ann Geophys 26:3317–3327. https://doi.org/10.5194/angeo-26-3317-2008
Koustov AV, Nishitani N, Ponomarenko PV, Shiokawa K, Suzuki S, Shevtsov BM, MacDougall JW (2009) Joint observations of a traveling ionospheric disturbance with the Paratunka OMTI camera and the Hokkaido HF radar. Ann Geophys 27:2399–2406 https://doi.org/10.5194/angeo-27-2399-2009
Koustov AV, Yakymenko KN, Nishitani N, Ponomarenko PV (2014) Hokkaido HF radar signatures of periodically reoccurring nighttime medium scale traveling ionospheric disturbances detected at short ranges. J Geophys Res Space Physics 119:1200–1218. https://doi.org/10.1002/2013JA019422
Kubota M, Conde M, Ishii M, Murayama Y, Jin H (2011) Characteristics of nighttime medium-scale traveling ionospheric disturbances observed over Alaska. J Geophys Res 116:A05307. https://doi.org/10.1029/2010JA016212
Kumar VV, Makarevich RA, Kane TA, Ye H, Devlin JC, Dyson PL (2011) On the spatiotemporal evolution of the ionospheric backscatter during magnetically disturbed periods as observed by the TIGER Bruny Island HF radar. J Atmos Sol Terr Phys 73(13):1940–1952. https://doi.org/10.1016/j.jastp.2011.05.001
Kunduri BSR, Baker JBH, Ruohoniemi JM, Clausen LBN, Grocott A, Thomas EG, Freeman MP, Talaat ER (2012) An examination of inter-hemispheric conjugacy in a subauroral polarization stream. J Geophys Res 117:A08225. https://doi.org/10.1029/2012JA017784
Kunduri BSR, Baker JBH, Ruohoniemi JM, Thomas EG, Shepherd SG, Sterne KT (2017) Statistical characterization of the large-scale structure of the subauroral polarization stream. J Geophys Res Space Physics 122:6035–6048. https://doi.org/10.1002/2017JA024131
Lester M, Chapman PJ, Cowley SWH, Crooks SJ, Davies JA, Hamadyk P, McWilliams KA, Milan SE, Parsons MJ, Payne DB, Thomas EC, Thornhill JD, Wade NM, Yeoman TK, Barnes RJ (2004) Stereo CUTLASS – a new capability for the SuperDARN radars. Ann Geophys 22:459–473. https://doi.org/10.5194/angeo-22-459-2004
Lester M, Hughes WJ, Singer HJ (1983) Polarization patterns of Pi2 magnetic pulsations and the substorm current wedge. J Geophys Res 88:7958–7966. https://doi.org/10.1029/JA088iA10p07958
Lomb NR (1976) Least-squares frequency analysis of unequally spaced data. Astrophys Space Sci 39:447–462. https://doi.org/10.1007/BF00648343
Lyons LR, Gallardo-Lacourt B, Zou S, Weygand JM, Nishimura Y, Li W, Gkioulidou M, Angelopoulos V, Donovan EF, Ruohoniemi JM, Anderson BJ, Shepherd SG, Nishitani N (2016) The 17 March 2013 storm: synergy of observations related to electric field modes and their ionospheric and magnetospheric effects. J Geophys Res Space Physics 121:10,880–10,897. https://doi.org/10.1002/2016JA023237
Lyons LR, Nishimura Y, Gallardo-Lacourt B, Nicolls MJ, Chen S, Hampton DL, Bristow WA, Ruohoniemi JM, Nishitani N, Donovan EF, Angelopoulos V (2015) Azimuthal flow bursts in the inner plasma sheet and possible connection with SAPS and plasma sheet earthward flow bursts. J Geophys Res Space Physics 120:5009–5021. https://doi.org/10.1002/2015JA021023
Lyons LR, Nishimura Y, Kim H-J, Donovan E, Angelopoulos V, Sofko G, Nicolls M, Heinselman C, Ruohoniemi JM, Nishitani N (2011) Possible connection of polar cap flows to pre- and post-substorm onset PBIs and streamers. J Geophys Res 116:A12225. https://doi.org/10.1029/2011JA016850
Makarevich RA, Bristow WA (2014) Fine structure of subauroral electric field and electron content. J Geophys Res Space Physics 119:3789–3802. https://doi.org/10.1002/2014JA019821
Makarevich RA, Dyson PL (2007) Dual HF radar study of the subauroral polarization stream. Ann Geophys 25:2579–2591. https://doi.org/10.5194/angeo-25-2579-2007
Makarevich RA, Kellerman AC, Bogdanova YV, Koustov AV (2009) Time evolution of the subauroral electric fields: a case study during a sequence of two substorms. J Geophys Res 114:A04312. https://doi.org/10.1029/2008JA013944
Makarevich RA, Kellerman AC, Devlin JC, Ye H, Lyons LR, Nishimura Y (2011) SAPS intensification during substorm recovery: a multi-instrument case study. J Geophys Res 116:A11311. https://doi.org/10.1029/2011JA016916
Marchaudon A, Blelly P-L (2015) A new interhemispheric 16-moment model of the plasmasphere-ionosphere system: IPIM. J Geophys Res Space Physics 120. https://doi.org/10.1002/2015JA021193
Mauk BH, Fox NJ, Kanekal SG, Kessel RL, Sibeck DG, Ukhorskiy A (2013) Science objectives and rationale for the Radiation Belt Storm Probes mission. Space Sci Rev 179:3–27 https://doi.org/10.1007/s11214-012-9908-y
McFadden J, Carlson C, Larson D, Ludlam M, Abiad R, Elliott B, Turin P, Marckwordt M, Angelopoulos V (2008) The THEMIS ESA plasma instrument and in-flight calibration. Space Sci Rev 141:277–302. https://doi.org/10.1007/s11214-008-9440-2
Milan SE, Grocott A, de Larquier S, Lester M, Yeoman TK, Freeman MP, Chisham G (2013) Traveling ionospheric disturbances in the Weddell Sea Anomaly associated with geomagnetic activity. J Geophys Res Space Physics 118:6608–6617. https://doi.org/10.1002/jgra.50566
Milan SE, Jones TB, Robinson TR, Thomas EC, Yeoman TK (1997b) Interferometric evidence for the observation of ground backscatter originating behind the CUTLASS coherent HF radars. Ann Geophys 15:29–39. https://doi.org/10.1007/s00585-997-0029-y
Milan SE, Lester, Cowley SWH, Oksavik K, Brittnacher M, Greenwald RA, Sofko G, Villain J-P (2003) Variations in polar cap area during two substorm cycles. Ann Geophys 21:1121–1140. https://doi.org/10.5194/angeo-21-1121-2003
Milan SE, Lester M (1998) Simultaneous observations at different altitudes of ionospheric backscatter in the eastward electrojet. Ann Geophys 16:55–68. https://doi.org/10.1007/s00585-997-0055-9
Milan SE, Lester M (2001) A classification of spectral populations observed in HF radar backscatter from the E region electrojets. Ann Geophys 19:189–204. https://doi.org/10.5194/angeo-19-189-2001
Milan SE, Lester M, Cowley SWH, Brittnacher M (2000) Convection and auroral response to a southward turning of the IMF: Polar UVI, CUTLASS, and IMAGE signatures of transient magnetic flux transfer at the magnetopause. J Geophys Res 105(A7):15741–15755. https://doi.org/10.1029/2000JA900022
Milan SE, Lester M, Sato N, Takizawa H (2001) On the altitude dependence of the spectral characteristics of decametre-wavelength E region backscatter and the relationship with optical auroral forms. Ann Geophys 19:205–217. https://doi.org/10.5194/angeo-19-205-2001
Milan SE, Lester M, Yeoman TK, Robinson TR, Uspensky MV, Villain J-P (2004) HF radar observations of high-aspect angle backscatter from the E region. Ann Geophys 22:829–847. https://doi.org/10.5194/angeo-22-829-2004
Milan SE, Yeoman TK, Lester M, Thomas EC, Jones TB (1997a) Initial backscatter occurrence statistics for the CUTLASS HF radars. Ann Geophys 15:703–718. https://doi.org/10.1007/s00585-997-0703-0
Mishin EV, Burke W (2005) Stormtime coupling of the ring current, plasmasphere and topside ionosphere: electromagnetic and plasma disturbances. J Geophys Res 110:A07209. https://doi.org/10.1029/2005JA011021
Mishin EV, Burke WJ, Huang CY, Rich FJ (2003) Electromagnetic wave structures within subauroral polarization streams. J Geophys Res 108(A8):1309. https://doi.org/10.1029/2002JA009793
Mishin EV, Puhl-Quinn PA (2007) SAID: plasmaspheric short circuit of substorm injections. Geophys Res Lett 34:L24101. https://doi.org/10.1029/2007GL031925
Miyoshi Y, Ono T, Takashima T, Asamura K, Hirahara M, Kasaba Y, Matsuoka A, Kojima H, Shiokawa K, Seki K, Fujimoto M, Nagatsuma T, Cheng CZ, Kazama Y, Kasahara S, Mitani T, Matsumoto H, Higashio N, Kumamoto A et al (2012) The Energization and Radiation in Geospace (ERG) project. In: Summers D, Mann IR, Baker DN, Shultz M (eds) Dynamics of the Earth’s radiation belts and inner magnetosphere, geophysical monograph series, 199. AGU, Washington, D. C, pp 103–116. https://doi.org/10.1029/2012GM001304
Nagano H, Nishitani N, Hori T (2015) Occurrence characteristics and lowest speed limit of Sub-Auroral Polarization Stream (SAPS) observed by the SuperDARN Hokkaido East radar. Earth Planets Space 67:126. https://doi.org/10.1186/s40623-015-0299-7
Nishida A (1968) Coherence of geomagnetic DP 2 fluctuations with interplanetary magnetic variations. J Geophys Res 73:5549–5559. https://doi.org/10.1029/JA073i017p05549
Nishimura Y, Lyons LR, Zou S, Xing X, Angelopoulos V, Mende SB, Bonnell JW, Larson D, Auster U, Hori T, Nishitani N, Hosokawa K, Sofko G, Nicolls M, Heinselman C (2010) Preonset time sequence of auroral substorms: coordinated observations by all-sky imagers, satellites, and radars. J Geophys Res Space Physics 115:A00108. https://doi.org/10.1029/2010JA015832
Nishitani N, Ogawa T (2005) Model calculations of possible ionospheric backscatter echo area for a mid-latitude HF radar. Adv Polar Upper Atmos Res 19:55–62
Nishitani N, Ogawa T, Otsuka Y, Hosokawa K, Hori T (2011) Propagation of large amplitude ionospheric disturbances with velocity dispersion observed by the SuperDARN Hokkaido radar after the 2011 off the Pacific coast of Tohoku Earthquake. Earth Planets Space 63(7):891–896. https://doi.org/10.5047/eps.2011.07.003
Nishitani N, Ogawa T, Sato N, Yamagishi H, Pinnock M, Villain J-P, Sofko G, Troshichev O (2002) A study of the dusk convection cell's response to an IMF southward turning. J Geophys Res 107(A3). https://doi.org/10.1029/2001JA900095
Norouzi-Sedeh L, Waters CL, Menk FW (2015) Survey of ULF wave signatures seen in the Tasman International Geospace Environment Radars data. J Geophys Res 120:949–963. https://doi.org/10.1002/2014JA020652
Occhipinti G, Dorey P, Farges T, Lognonné P (2010) Nostradamus: the radar that wanted to be a seismometer. Geophys Res Lett 37:L18104. https://doi.org/10.1029/2010GL044009
Ogawa T, Arnold NF, Kirkwood S, Nishitani N, Lester M (2003) Finland HF and Esrange MST radar observations of polar mesosphere summer echoes. Ann Geophys 21:1047–1055. https://doi.org/10.5194/angeo-21-1047-2003
Ogawa T, Balan N, Otsuka Y, Shiokawa K, Ihara C, Shimomai T, Saito A (2002b) Observations and modeling of 630 nm airglow and total electron content associated with traveling ionospheric disturbances over Shigaraki, Japan. Earth Planets Space 54:45–56. https://doi.org/10.1186/BF03352420
Ogawa T, Nishitani N, Kawamura S, Murayama Y (2013) Mesosphere summer echoes observed with the SuperDARN Hokkaido HF radar at Rikubetsu, Japan (43.5N). Earth Planets Space 65:1593–1597. https://doi.org/10.5047/eps.2013.07.009
Ogawa T, Nishitani N, Otsuka Y, Shiokawa K, Tsugawa T, Hosokawa K (2009) Medium-scale traveling ionospheric disturbances observed with the SuperDARN Hokkaido radar, all-sky imager, and GPS network and their relation to concurrent sporadic E irregularities. J Geophys Res 114:A03316. https://doi.org/10.1029/2008JA013893
Ogawa T, Nishitani N, Sato N, Yamagishi H, Yukimatu AS (2002a) Upper mesosphere summer echoes detected with the antarctic Syowa HF radar. Geophys Res Lett 29:1157. https://doi.org/10.1029/2001GL014094
Ogawa T, Nishitani N, Tsugawa T, Shiokawa K (2012) Giant ionospheric disturbances observed with the SuperDARN Hokkaido HF radar and GPS network after the 2011 Tohoku earthquake. Earth Planets Space 64(12):1295–1307. https://doi.org/10.5047/eps.2012.08.001
Oinats AV, Kurkin VI, Nishitani N (2015) Statistical study of medium-scale traveling ionospheric disturbances using SuperDARN Hokkaido ground backscatter data for 2011. Earth Planets Space 67:22. https://doi.org/10.1186/s40623-015-0192-4
Oinats AV, Nishitani N, Ponomarenko P, Berngardt O, Ratovsky K (2016a) Statistical characteristics of medium-scale traveling ionospheric disturbances revealed from the Hokkaido East and Ekaterinburg HF radar data. Earth Planets Space 68:8. https://doi.org/10.1186/s40623-016-0390-8
Oinats AV, Nishitani N, Ponomarenko P, Ratovsky KG (2016b) Diurnal and seasonal behavior of the Hokkaido East SuperDARN ground backscatter: simulation and observation. Earth Planets Space 68:18. https://doi.org/10.1186/s40623-015-0378-9
Oksavik K, Greenwald RA, Ruohoniemi JM, Hairston MR, Paxton LJ, Baker JBH, Gjerloev JW, Barnes RJ (2006) First observations of the temporal/spatial variation of the sub-auroral polarization stream from the SuperDARN Wallops HF radar. Geophys Res Lett 33:L12104. https://doi.org/10.1029/2006GL026256
Otsuka Y, Kotake N, Shiokawa K, Ogawa T, Tsugawa T, Saito A (2011) Statistical study of medium-scale traveling ionospheric disturbances observed with a GPS receiver network in Japan. Aeronomy of the Earth's atmosphere and ionosphere IAGA Special Sopron Book Series Volume 2 Part 3, pp 291–299. https://doi.org/10.1007/978-94-007-0326-1_21
Parkinson ML, Devlin JC, Ye H, Waters CL, Dyson PL, Breed AM, Morris RJ (2003b) On the occurrence and motion of decametre-scale irregularities in the sub-auroral, auroral, and polar cap ionosphere. Ann Geophys 21:1847–1868. https://doi.org/10.5194/angeo-21-1847-2003
Parkinson ML, Dyson PL, Pinnock M (2006) On the occurrence of auroral westward flow channels and substorm phase. Adv Space Res 38(8):1755–1762. https://doi.org/10.1016/j.asr.2005.08.028
Parkinson ML, Pinnock M, Wild JA, Lester M, Yeoman TK, Milan SE, Ye H, Devlin JC, Frey HU, Kikuchi T (2005) Interhemispheric asymmetries in the occurrence of magnetically conjugate sub-auroral polarisation streams. Ann Geophys 23:1371–1390. https://doi.org/10.5194/angeo-23-1371-2005
Parkinson ML, Pinnock M, Ye H, Hairston MR, Devlin JC, Dyson PL, Morris RJ, Ponomarenko P (2003a) On the lifetime and extent of an auroral westward flow channel (AWFC) observed during a magnetospheric substorm. Ann Geophys 21:893–913. https://doi.org/10.5194/angeo-21-893-2003
Parris RT, Bristow WA (2009) Observations and characterization of HAARP induced F-region decameter scale plasma density irregularities using the new imaging capabilities of the Kodiak Island SuperDARN radar. American Geophysical Union, Fall Meeting 2009
Perkins F (1973) Spread F and ionospheric currents. J Geophys Res 78:218–226. https://doi.org/10.1029/JA078i001p00218
Pettigrew ED, Shepherd SG, Ruohoniemi JM (2010) Climatological patterns of high-latitude convection in the Northern and Southern Hemispheres: dipole tilt dependencies and interhemispheric comparisons. J Geophys Res 115:A07305. https://doi.org/10.1029/2009JA014956
Pinnock M, Rodger AS, Dudeney JR, Baker KB, Greenwald RA, Greenspan M (1993) Observations of an enhanced convection channel in the cusp ionosphere. J Geophys Res 98:3767–3776. https://doi.org/10.1029/92JA01382
Ponomarenko P, Iserhienrhien B, JP S-M (2016) Morphology and possible origins of near-range oblique HF backscatter at high and midlatitudes. Radio Sci 51:718–730. https://doi.org/10.1002/2016RS006088
Ponomarenko P, Nishitani N, Oinats AV, Tsuya T, St. Maurice J-P (2015) Application of ground scatter returns for calibration of HF interferometry data. Earth Planets Space 67:138. https://doi.org/10.1186/s40623-015-0310-3
Ponomarenko PV, Menk FW, Waters CL (2003) Visualization of ULF waves in SuperDARN data. Geophys Res Lett 30:1926–1929. https://doi.org/10.1029/2003GL017757
Ponomarenko PV, Waters CL (2013) Transition of Pi2 ULF wave polarization structure from the ionosphere to the ground. Geophys Res Lett 40:1474–1478. https://doi.org/10.1002/grl.50271
Ponomarenko PV, Waters CL, St-Maurice J-P (2010) Upstream Pc3-4 waves: experimental evidence of propagation to the nightside plasmapause/plasmatrough. Geophys Res Lett 37:L22102. https://doi.org/10.1029/2010GL045416
Ponomarenko PW, Menk FW, Waters CL, Sciffer MD (2005) Pc3-4 ULF waves observed by the SuperDARN TIGER radar. Ann Geophys 23:1271–1280 https://doi.org/10.5194/angeo-23-1271-2005
Provan G, Yeoman TK, Milan SE (1998) CUTLASS Finland radar observations of the ionospheric signatures of flux transfer events and the resulting plasma flow. Ann Geophys 16:1411-1422. https://doi.org/10.1007/s00585-998-1411-0
Puhl-Quinn P, Matsui H, Mishin EV, Mouikis C, Kistler L, Khotyaintsev Y, Décréau P, Lucek E (2007) Cluster and DMSP observations of SAID electric fields. J Geophys Res 112:A05219. https://doi.org/10.1029/2006JA012065
Rae IJ, Donovan EF, Mann IR, Fenrich FR, Watt CEJ, Milling DK, Lester M, Lavraud B, Wild JA, Singer HJ, Rème H, Balogh A (2005) Evolution and characteristics of global Pc5 ULF waves during a high solar wind speed interval. J Geophys Res 110:A12211. https://doi.org/10.1029/2005JA01107
Ribeiro AJ, Ruohoniemi JM, Baker JBH, Clausen LBN, Greenwald RA, Lester M (2012) A survey of plasma irregularities as seen by the midlatitude Blackstone SuperDARN radar. J Geophys Res 117:A02311. https://doi.org/10.1029/2011JA017207
Ribeiro AJ, Ruohoniemi JM, Baker JBH, Clausen LBN, de Larquier S, Greenwald RA (2011) A new approach for identifying ionospheric backscatter in midlatitude SuperDARN HF radar observations. Radio Sci 46:RS4011. https://doi.org/10.1029/2011RS004676
Rich FJ, Denig WF (1992) The major magnetic storm of March 13-14, 1989 and associated ionosphere effects. Can J Phys 70:510
Ruohoniemi JM, Barnes RJ, Greenwald RA, Shepherd SG (2001) The response of the high-latitude ionosphere to the coronal mass ejection event of April 6, 2000: a practical demonstration of space weather nowcasting with the Super Dual Auroral Radar Network HF radars. J Geophys Res Space Physics 106:30085–30097. https://doi.org/10.1029/2000JA000217
Ruohoniemi JM, Greenwald RA (1996) Statistical patterns of high-latitude convection obtained from Goose Bay HF radar observations. J Geophys Res 101:21743–21763. https://doi.org/10.1029/96JA01584
Ruohoniemi JM, Greenwald RA (1998) The response of high-latitude convection to a sudden southward IMF turning. Geophys Res Lett 25:2913–2916. https://doi.org/10.1029/98GL02212
Ruohoniemi JM, Greenwald RA (2005) Dependencies of high-latitude plasma convection: consideration of interplanetary magnetic field, seasonal, and universal time factors in statistical patterns. J Geophys Res 110:A09204. https://doi.org/10.1029/2004JA010815
Ruohoniemi JM, Greenwald RA, Villain J-P, Baker KB, Newell PT, Meng C-I (1988) Coherent HF radar backscatter from small-scale irregularities in the dusk sector of the subauroral ionosphere. J Geophys Res 93(A11):12871–12882. https://doi.org/10.1029/JA093iA11p12871
Sakaguchi K, Nagatsuma T, Ogawa T, Obara T, Troshichev OA (2012) Ionospheric Pc5 plasma oscillations observed by the King Salmon HF radar and their comparison with geomagnetic pulsations on the ground and in geostationary orbit. J Geophys Res 117:A03218. https://doi.org/10.1029/2011JA016923
Samson JC, Greenwald RA, Ruohoniemi JM, Frey A, Baker KB (1990) Goose bay radar observations of earth-reflected, atmospheric gravity-waves in the high-latitude ionosphere. J Geophys Res 95(A6):7693–7709. https://doi.org/10.1029/JA095iA06p07693
Scargle JD (1982) Studies in astronomical time series analysis. II -statistical aspects of spectral analysis of unevenly spaced data. Astrophys J 263:835. https://doi.org/10.1086/160554
Senior C, Cerisier J-C, Thorolfsson A, Lester M (2002) Propagation in the ionosphere of convection changes following a sharp interplanetary magnetic field By transition. J Geophys Res 107(A10):1316. https://doi.org/10.1029/2001JA005078
Shepherd SG (2014) Altitude-adjusted corrected geomagnetic coordinates: definition and functional approximations. J Geophys Res Space Physics 119:7501–7521. https://doi.org/10.1002/2014JA020264
Shepherd SG (2017) Elevation angle determination for SuperDARN HF radar layouts. Radio Sci 52:938–950 https://doi.org/10.1002/2017RS006348
Shepherd SG, Greenwald RA, Ruohoniemi JM (1999) A possible explanation for rapid large-scale ionospheric responses to southward turnings of IMF. Geophys Res Lett 26(20):3197–3200. https://doi.org/10.1029/1999GL010670
Shi X, Baker JBH, Ruohoniemi JM, Hartinger MD, Frissell NA, Liu J (2017) Simultaneous space and ground-based observations of a plasmaspheric virtual resonance. J Geophys Res 122:4190–4209. https://doi.org/10.1002/2016JA023583
Shinagawa H, Iyemori T, Saito S, Maruyama T (2007) A numerical simulation of ionospheric and atmospheric variations associated with the Sumatra earthquake on December 26, 2004. Earth Planets Space 59:1015–1026. https://doi.org/10.1186/BF03352042
Shiokawa K, Ihara C, Otsuka Y, Ogawa T (2003) Statistical study of nighttime medium-scale traveling ionospheric disturbances using midlatitude airglow images. J Geophys Res 108(A1):1052. https://doi.org/10.1029/2002JA009491
Shiokawa K, Otsuka Y, Nishitani N, Ogawa T, Tsugawa T, Maruyama T, Smirnov SE, Bychkov VV, Shevtsov BM (2008) Northeastward motion of nighttime MSTIDs at middle latitudes observed by an airglow imager. J Geophys Res 113:A12312. https://doi.org/10.1029/2008JA013417
Shiokawa K, Otsuka Y, Ogawa T, Balan N, Igarashi K, Ridley AJ, Knipp DJ, Saito A, Yumoto K (2002) A large-scale traveling ionospheric disturbance during the magnetic storm of 15 September 1999. J Geophys Res 107(A6):1088. https://doi.org/10.1029/2001JA000245
Southwood DJ, Hughes WJ (1983) Theory of hydromagnetic waves in the magnetosphere. Space Sci Rev 35:301. https://doi.org/10.1007/BF00169231
Southwood DJ, Wolf RA (1978) An assessment of the role of precipitation in magnetospheric convection. J Geophys Res 83:5227. https://doi.org/10.1029/JA083iA11p05227
Spiro RW, Heelis RA, Hanson WB (1979) Rapid subauroral ion drifts observed by Atmosphere Explorer C. Geophys Res Lett 6:657–660. https://doi.org/10.1029/GL006i008p00657
Stocker AJ, Arnold NF, Jones TB (2000) The synthesis of travelling ionospheric disturbance (TID) signatures in HF radar observations using ray tracing. Ann Geophys 18:56–64 https://doi.org/10.1007/s00585-000-0056-4
SuperDARN Data Analysis Working Group. Participating members: Thomas EG, Ponomarenko PV, Billett DD, Bland EC, Burrell AG, Kotyk K, Reimer AS, Schmidt M, Shepherd SG, Sterne KT, Walach M-T (2018) SuperDARN Radar Software Toolkit (RST) 4.2. https://doi.org/10.5281/zenodo.1403226
Sutcliffe PR, Poole AWV (1989) Ionospheric doppler and electron velocities in the presence of ULF waves. J Geophys Res 94:13505–13514. https://doi.org/10.1029/JA094iA10p13505
Suzuki S, Hosokawa K, Shibata T, Shiokawa K, Otsuka Y, Nishitani N, Ogawa T, Koustov AV, Shevtsov B (2009) Coordinated observations of nighttime medium-scale traveling ionospheric disturbances in 630-nm airglow and HF radar echoes at midlatitudes. J Geophys Res 114:A07312. https://doi.org/10.1029/2008JA013963
Teramoto M, Nishitani N, Nishimura Y, Nagatsuma T (2016) Latitudinal dependence on the frequency of Pi2 pulsations near the plasmapause using THEMIS satellites and Asian-Oceanian SuperDARN radars. Earth Planets Space 68:22–36. https://doi.org/10.1186/s40623-016-0397-1
Teramoto M, Nishitani N, Pilipenko V, Ogawa T, Shiokawa K, Nagatsuma T, Yoshikawa A, Baishev D, Murata KT (2014) Pi2 pulsation simultaneously observed in the E and F region ionosphere with the SuperDARN Hokkaido radar. J Geophys Res 119:3444–3462. https://doi.org/10.1002/2012JA018585
Thébault E et al (2015) International geomagnetic reference field: the 12th generation. Earth Planets Space 67:79. https://doi.org/10.1186/s40623-015-0228-9
Thomas EG, Baker JBH, Ruohoniemi JM, Clausen LBN, Coster AJ, Foster JC, Erickson PJ (2013) Direct observations of the role of convection electric field in the formation of a polar tongue of ionization from storm enhanced density. J Geophys Res Space Physics 118:1180–1189. https://doi.org/10.1002/jgra.50116
Thomas EG, Shepherd SG (2018) Statistical patterns of ionospheric convection derived from mid-latitude, high-latitude, and polar SuperDARN HF radar observations. J Geophys Res 123:3196–3216 https://doi.org/10.1002/2018JA025280
Thomas RM, Whitham PS, Elford WG (1986) Frequency dependence of radar meteor echo rates. Proc Astron Soc Aust 6:303–306. https://doi.org/10.1017/S1323358000026904
Thorolfsson A, Cerisier J-C, Pinnock M (2001) Flow transients in the postnoon ionosphere: the role of solar wind dynamic pressure. J Geophys Res 106(A2):1887–1901. https://doi.org/10.1029/2000JA900078
Tsuda T, Yamamoto M, Hashiguchi H, Shiokawa K, Ogawa Y, Nozawa S, Miyaoka H, Yoshikawa A (2016) A proposal on the study of solar-terrestrial coupling processes with atmospheric radars and ground-based observation network. Radio Sci 51:1587–1599. https://doi.org/10.1002/2016RS006035
Tsugawa T, Saito A, Otsuka Y (2004) A statistical study of large-scale traveling ionospheric disturbances using the GPS network in Japan. J Geophys Res 109:A06302. https://doi.org/10.1029/2003JA010302
Tsugawa T, Saito A, Otsuka Y, Yamamoto M (2003) Damping of large-scale traveling ionospheric disturbances detected with GPS networks during the geomagnetic storm. J Geophys Res 108(A3):1127. https://doi.org/10.1029/2002JA009433
Unwin RS, Cummack CH (1980) Drift spikes: the ionospheric signature of large poleward directed electric fields at subauroral latitudes, IMS in Antarctica. Mem Natl Inst Polar Res 16:72–83
Watanabe D, Nishitani N (2013) Study of ionospheric disturbances during solar flare events using the SuperDARN Hokkaido radar. Adv Polar Sci 24:12–18. https://doi.org/10.3724/SP.J.1085.2013.00012
Wild J (2012) Public engagement with SuperDARN. SuperDARN workshop 2012, Shanghai, China
Wild JA, Cowley SWH, Davies JA, Khan H, Lester M, Milan SE, Provan G, Yeoman TK, Balogh A, Dunlop MW, Fornaçon K-H, Georgescu E (2001) First simultaneous observations of flux transfer events at the high-latitude magnetopause by the Cluster spacecraft and pulsed radar signatures in the conjugate ionosphere by the CUTLASS and EISCAT radars. Ann Geophys 18:1491–1508. https://doi.org/10.5194/angeo-19-1491-2001
Wild JA, Milan SE, Cowley SWH, Dunlop MW, Owen CJ, Bosqued JM, Taylor MGGT, Davies JA, Lester M, Sato N, Yukimatu AS, Fazakerley AN, Balogh A, Rème H (2003) Coordinated interhemispheric SuperDARN radar observations of the ionospheric response to flux transfer events observed by the Cluster spacecraft at the high-latitude magnetopause. Ann Geophys 21:1807–1826 https://doi.org/10.5194/angeo-21-1807-2003
Wolf RA, Spiro RW, Sazykin S, Toffoletto FR (2007) How the Earth’s inner magnetosphere works: an evolving picture. J Atmos Solar-Terr Phys 69:288–302. https://doi.org/10.1016/j.jastp.2006.07.026
Yakymenko KN, Koustov AV, Nishitani N (2015) Statistical study of midlatitude E region echoes observed by the Hokkaido SuperDARN HF radar. J Geophys Res 120:9959–9976. https://doi.org/10.1002/2015JA021685
Yeh H-C, Foster JC, Rich FJ, Swider W (1991) Storm time electric field penetration observed at mid-latitude. J Geophys Res 96:5707. https://doi.org/10.1029/90JA02751
Yeoman TK, Wright DM, Robinson TR, Davies JA, Rietveld M (1997) High spatial and temporal resolution observations of an impulse driven field line resonance in radar backscatter artificially generated with the Tromsø heater. Ann Geophys 15:634–644. https://doi.org/10.1007/s00585-997-0634-9
Yokoyama T, Hysell DL (2010) A new midlatitude ionosphere electrodynamics coupling model (MIECO): latitudinal dependence and propagation of medium-scale traveling ionospheric disturbances. Geophys Res Lett 37:L08105. https://doi.org/10.1029/2010GL042598
Zou S, Lyons LR, Nicolls MJ, Heinselman CJ, Mende SB (2009) Nightside ionospheric electrodynamics associated with substorms: PFISR and THEMIS ASI observations. J Geophys Res 114:A12301. https://doi.org/10.1029/2009JA014259
Zou Y, Nishitani N (2014) Study of midlatitude ionospheric convection during quiet and disturbed periods using the SuperDARN Hokkaido radar. Adv Space Res 54:473–480. https://doi.org/10.1016/j.asr.2014.01.011
Acknowledgements
This review paper originated from approximately one-week long workshops in January 2017 and January 2018, during which we discussed the content of the paper, its structure and future directions of the mid-latitude SuperDARN network. These workshops were carried out by the joint research program of the Institute for Space-Earth Environmental Research, Nagoya University, and supported by funding agencies described in the ‘funding’ section. Finally, we would like to thank everyone who contributed to the completion of the review paper.
Funding
SuperDARN is a collection of radars funded by national scientific funding agencies of Australia, Canada, China, France, Italy, Japan, Norway, South Africa, United Kingdom and the United States of America. Organization of the workshops for writing up the present review paper was supported by Japan Society for the Promotion of Science (JSPS) (Grant-in-Aid for Specially Promoted Research): Study of dynamical variation of particles and waves in the inner magnetosphere using ground-based network observations (PWING), Project Number: 16H06286. Completion of the present review paper was partly supported by JSPS (Grand-in-Aid for Scientific Research), Project Number: 18KK0099. Part of the work of TH was done at the ERG-Science Center operated by ISAS/JAXA and Institute for Space-Earth Environmental Research (ISEE) /Nagoya University.
Availability of data and materials
The SuperDARN datasets shown in this paper are available in the Virginia Tech website at: http://vt.superdarn.org.
The AACGM-v2 software for calculating geomagnetic coordinates of the SuperDARN radars is available in the Dartmouth College web server at: http://superdarn.thayer.dartmouth.edu/aacgm.html.
Author information
Authors and Affiliations
Contributions
NN, JMR, and ML originally proposed the present review paper, attended the workshops in Nagoya, Japan, and contributed to the writing of the paper. JBHB, AVK, SGS, and GC attended the workshop(s) and contributed to the writing of the paper as section heads. TH, EGT, RAM, AM, PP, and JW attended the workshop(s) and contributed to the writing of the paper. SEM, WAB, JD, and EM contributed to the content of the paper as mid-latitude SuperDARN principal investigators and co-investigators. RAG, TA, and TK contributed to the content of the paper as the authors of the references cited in the present paper and by commenting on the manuscript. All authors read and approved the final manuscript.
Corresponding author
Ethics declarations
Competing interests
The authors declare that they have no competing interests.
Publisher’s Note
Springer Nature remains neutral with regard to jurisdictional claims in published maps and institutional affiliations.
Additional information
The original version of this article was revised: After publication of this article [1], it was brought to our attention that the figure 5 is incorrect, where the positions of DCE and SPS were misplaced. The correct figure 5 is as below, the original publication has been corrected.
Additional file
Additional file 1:
Historical overview of mid-latitude SuperDARN. (PDF 212 kb)
Rights and permissions
Open Access This article is distributed under the terms of the Creative Commons Attribution 4.0 International License (http://creativecommons.org/licenses/by/4.0/), which permits unrestricted use, distribution, and reproduction in any medium, provided you give appropriate credit to the original author(s) and the source, provide a link to the Creative Commons license, and indicate if changes were made.
About this article

Cite this article
Nishitani, N., Ruohoniemi, J.M., Lester, M. et al. Review of the accomplishments of mid-latitude Super Dual Auroral Radar Network (SuperDARN) HF radars. Prog Earth Planet Sci 6, 27 (2019). https://doi.org/10.1186/s40645-019-0270-5
Received:
Accepted:
Published:
DOI: https://doi.org/10.1186/s40645-019-0270-5