


Abstract
Background Asthma is one of the most common chronic diseases in childhood, occurring in up to 10% of all children. Exercise-induced bronchoconstriction (EIB) is indicative of uncontrolled asthma and can be assessed using an exercise challenge test (ECT). However, this test requires children to undergo demanding repetitive forced breathing manoeuvres. We aimed to study the electrical activity of the diaphragm using surface electromyography (EMG) as an alternative measure to assess EIB.
Methods Forty-two children suspected of EIB performed an ECT wearing a portable EMG amplifier. EIB was defined as a fall in FEV1 of more than 13%. Children performed spirometry before exercise, and at 1, 3 and 6 min after exercise until the nadir FEV1 was attained and after the use of a bronchodilator. EMG measurements were obtained between spirometry measurements.
Results Twenty out of 42 children were diagnosed with EIB. EMG peak amplitudes measured at the diaphragm increased significantly more in children with EIB; 4.85 μV (1.82–7.84), compared to children without EIB; 0.20 μV (−0.10–0.54), (p<0.001) at the lowest FEV1 post-exercise. Furthermore, the increase in EMG peak amplitude could accurately distinguish between EIB and non-EIB using a cut-off of 1.15 μV (sensitivity 95%, specificity 91%).
Conclusion EMG measurements of the diaphragm are strongly related to the FEV1 and can accurately identify EIB. EMG measurements are a less invasive, effort-independent measure to assess EIB and could be an alternative when spirometry is not feasible.
Abstract
An increase in muscular activity of the diaphragm is strongly related to the decrease in FEV1 in a standard exercise challenge test and can be used to diagnose exercise-induced bronchoconstriction in children https://bit.ly/2KFLwmS
Introduction
Asthma is one of the most common chronic inflammatory diseases in children, occurring in up to 10% of all children and reducing quality of life [1, 2]. Exercise-induced bronchoconstriction (EIB) in children is a sign of airway inflammation and indicates poor asthma control [3–6]. EIB is characterised by the classic symptoms of asthma: coughing, wheezing and dyspnoea, which are due to airflow limitation through smooth muscle contraction, congestion of the airway wall and an increased mucus production. This leads to a decreased lumen and an increase in airway resistance [7–10]. In order to maintain sufficient airflow, the muscle contraction force of the diaphragm and accessory breathing muscles increases.
EIB is diagnosed by means of the spirometry results of an exercise challenge test (ECT) [5, 11–14]. A decrease in FEV1 in response to exercise of more than 13% is regarded a significant reaction in EIB in children [11]. Spirometry requires repetitive forced breathing manoeuvres, which in children may cause exhaustion and loss of technique. Moreover, spirometry may affect respiratory physiology [15–18].
Electromyography (EMG) of the diaphragm and intercostal muscles can reliably and reproducibly be used to study tidal breathing [19]. EMG measurements of the diaphragm and intercostal muscles were successfully used as an alternative measure of pulmonary function in a histamine provocation test and a reversibility in response to bronchodilator test [20, 21]. Furthermore, EMG measurements of the diaphragm have been used to assess muscle activity in relation to flow and are a reliable monitor for heart- and breathing rate in sleeping neonates [22, 23].
Several parameters can be extracted from respiratory EMG measurements. The peak amplitude corresponds to the maximal amount of muscular activity within a single breath (μV). The width corresponds to the duration of each breath (s). The area under the curve (AUC) of the EMG signal corresponds to the total amount of action potentials over the duration of a single breath (μV·s). The baseline activity measured corresponds to the tonic muscle activity (μV).
The aim of this study was to investigate the relation between the decrease in FEV1 in response to exercise and the changes in diaphragm muscle activity and evaluate the use of EMG as an alternative tool to diagnose EIB in asthmatic children.
Materials and methods
Study design
This study had a cross-sectional design. Children who were referred for an ECT between the ages of 6 and 18 with respiratory symptoms in response to exercise were approached to participate. Children and/or parents who did not speak Dutch, children with an implantable cardioverter-defibrillator (ICD) or pacemaker, psychomotor retardation, comorbid chronic diseases other than asthma or who were prematurely born were excluded. Subjects were categorised in the EIB group if their decrease in FEV1 was more than 13% post-exercise. Written informed consent for participating in measurements, data storage and data handling was obtained from all subjects and/or parents of subjects prior to measurements. This study was approved by the local medical ethics committee and was registered in the Dutch trial register (trial no. NL6891).
Measurement protocol
Each subject performed an ECT, in a cooled chamber with dry, cold air (10.0–12.0°C), according to the standards of the American Thoracic Society [11]. Children were equipped with the EMG measurement device and electrodes prior to their first spirometry measurement and wore the device throughout the full ECT protocol. After baseline measurements children exercised on a treadmill at 10% slope, nose-clipped, for 6 min at 80% of the maximal predicted heartrate [(220 – age) × 0.8].
Pulmonary function was measured using the standard European Respiratory Society protocol [24]. After each spirometry measurement, children were instructed to sit still for 30 s in an upright position with their hands placed in their lap. Spirometry measurements were obtained before exercise, at 1, 3 and 6 min after exercise until the nadir FEV1 was attained, as well as after salbutamol (Ventolin nebuliser, 200 μg) was administered. EMG measurements were obtained between spirometry measurements.
Devices and software
EMG measurements were performed using the Dipha-16 (DEMCON Macawi Respiratory Systems BV, Enschede, the Netherlands). The device contained eight EMG leads and a ground lead. Two leads were placed bilaterally at the diaphragm and two leads were placed bilaterally in the second intercostal space, two were placed bilaterally at the sternocleidomastoid muscles and two were placed bilaterally at the trapezoid muscles using Red Dot Ag/AgCl latex-free electrodes (3M). The ground lead was placed at the sternum. Data were wirelessly transferred to a laptop.
Pre-processing of the data occurred within the measurement application provided by the manufacturer. Pre-processing entailed the detection of QRS complexes within the signal and replacing them with a running average of the signal, a technique designed and first applied by O’Brien et al. [25]. Of the remaining signal the root mean square (RMS) was calculated and stored for further analysis. Post-measurement processing was performed using Matlab R2018a (Mathworks).
Post-processing
EMG measurement timeframes in between spirometry measurements were isolated, after which the respiratory frequency was determined for each timeframe by inspection of the raw measurement combined with the power spectral density of the timeframe. The applied gating algorithm in the manufacturer's measurement software did not remove P- and T-waves from the measured signals [25]. The P- and T-waves, as well as apparent artefacts, were removed using a fourth-order low-pass Butterworth filter.
Peak amplitude, peak width, AUC and baseline activity were subsequently determined for each muscle group and measurement window, respectively. Furthermore, changes relative to the baseline measurement were calculated.
Statistical analysis
IBM SPSS Statistics 25 was used for statistical analysis. Cohen's D was calculated based upon the results of a study by Maarsingh [20], who also investigated the increase in EMG activity in response to a bronchial challenge, and was found to be 1.43. Alpha was set at 0.01 and beta at 0.9. All EMG parameters were assessed for normality by evaluating the histogram and the Shapiro–Wilk test. Normally distributed data were compared using an independent-samples t-test at a 95% confidence interval. Data that were not normally distributed were compared using a Mann–Whitney U-test with α set to 5%. Receiver operator characteristic (ROC) curves were computed to evaluate the accuracy at which EMG can distinguish between controlled and uncontrolled asthma. Spearman's rho was calculated to determine the correlation between the decrease in FEV1 and the increase in (accessory) breathing muscle activity. Correlation coefficients were interpreted as very weak (0.00–0.19), weak (0.20–0.39), moderate (0.40–0.59), strong (0.60–0.79) and very strong (0.80–1.00). Patients with missing data were excluded from this study.
Results
Population
A power calculation revealed that 34 patients were required (17 with EIB, 17 without). To account for possible drop-out and non-asthmatic respiratory symptoms which may occur during an ECT, a population size of 50 was chosen. In total 52 children were approached to participate in this study, of which 50 agreed and 42 were eligible for participation. Of the eight excluded patients, six displayed shortness of breath during submaximal exercise without a decrease in FEV1 post-exercise, one patient was unable to perform the ECT and one patient had incomplete measurement data due to failure of the measurement software.
Correlation
There was a very strong correlation between the decrease in FEV1 and the increase in peak amplitude of the diaphragm, with a Spearman's rho of 0.87 (figure 1). We were unable to obtain reliable measurements of the intercostal muscles pre- and post-exercise in the majority of patients. After restricting the data to the respiratory frequency within each timeframe the breathing pattern was no longer visible in most of the measurements of the accessory breathing muscles.
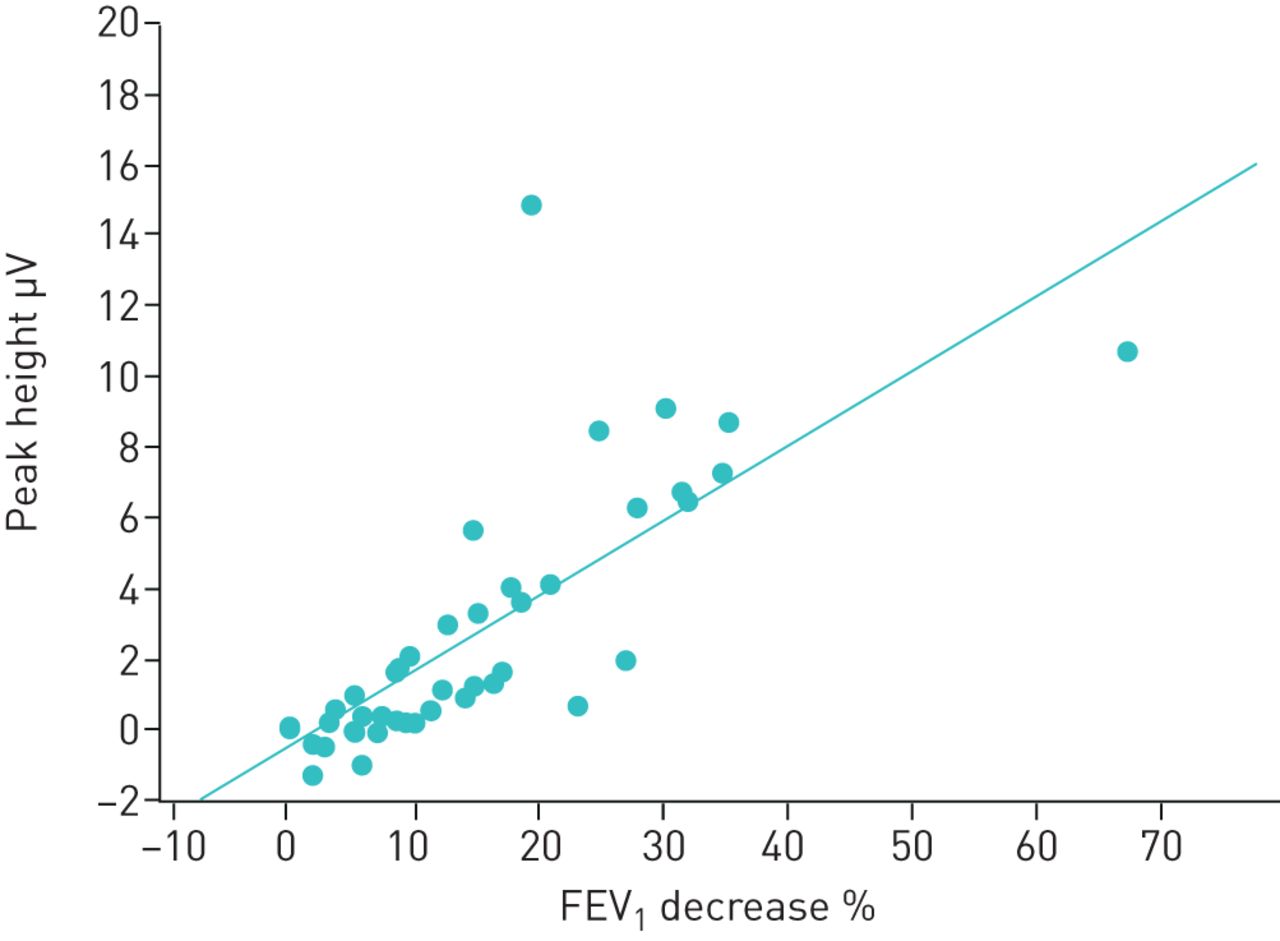
Peak amplitude difference of the electromyography signal in relation to the decrease in forced expiratory volume in 1 s (FEV1) between baseline and the nadir FEV1. The circles indicate single measurements and the line indicates the linear regression line (0.21 × –0.48, rho=0.87).
Group comparison
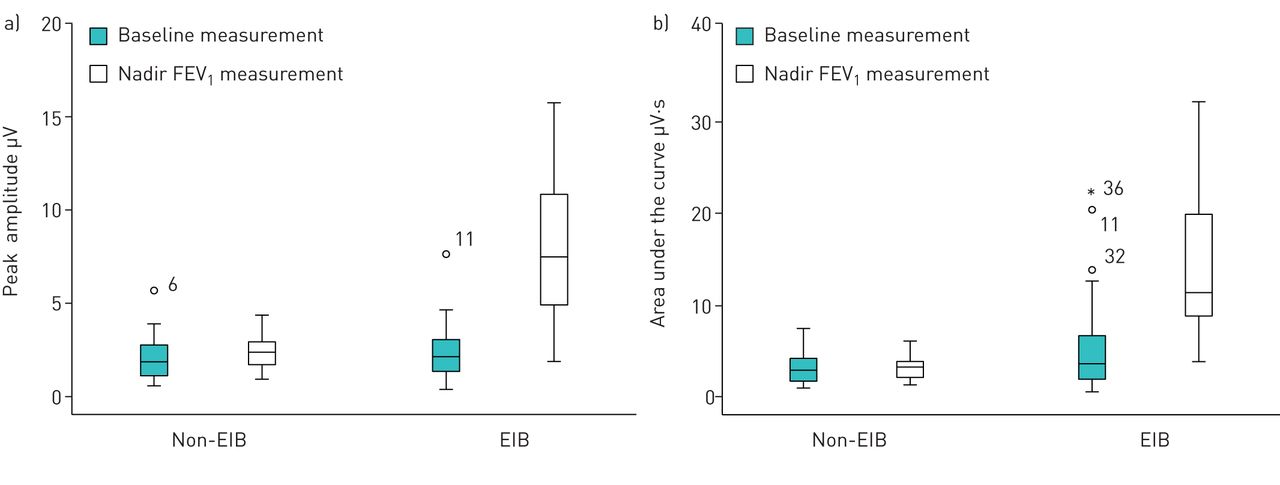
Both groups were comparable in demographic and clinical parameters (table 1). EMG parameters at the diaphragm were comparable between groups at baseline (figure 2). At the nadir FEV1 we found a significant increase in peak amplitude and AUC for the EIB patients (table 2). After administration of salbutamol, the measured parameters returned to baseline levels.

Comparison of distributions of the electromyography a) peak amplitude and b) area under the curve in the exercise-induced bronchoconstriction (EIB) and non-EIB group at baseline and at the nadir forced expiratory volume in 1 s (FEV1). The circles represent outliers, the asterisk is an extreme outlier (defined as more than 1.5× larger than the standard deviation).
Demographic and clinical parameters of the study population.
Overview of the increases in electromyography parameters between baseline and at the nadir forced expiratory volume in 1 s (FEV1)
It is possible to distinguish between EIB and non-EIB using the difference in measured peak amplitude between baseline and the measurement at the nadir FEV1 with a sensitivity of 95% and a specificity of 91% at a cut-off value of 1.15 μV. The AUC of the ROC curve is 0.97 (figure 3). The measured AUC allows EIB and non-EIB to be distinguished with a sensitivity of 85% and a specificity of 91% at a cut-off value of 1.57 μV·s. The AUC of the ROC is 0.91.

Receiver operating characteristic curves of the difference in electromyography (EMG) peak amplitude and measured areas under the curve between baseline and the nadir forced expiratory volume in 1 s. The difference in EMG peak amplitude provides a sensitivity of 95% and specificity of 91% at a cut-off of 1.15 μV·s. The measured areas under curve provide a sensitivity of 85% and specificity of 91% at a cut-off of 1.57 μV·s.
Discussion
This study shows that the fall in FEV1 in children with respiratory symptoms in response to exercise is strongly related to the increase in electrical activity of the diaphragm, allowing the use of EMG to accurately diagnose EIB.
To our knowledge this is the first study to investigate the electrical activity of the respiratory muscles in a standardised clinical ECT setting to assess EIB. Our study is in line with Maarsingh's study, who found a linear increase in the logarithm of the electrical activity of the diaphragm in asthmatic children in response to a histamine challenge [20]. We chose exercise as the bronchoprovocative stimulus, which is an important real-life trigger and specific for childhood asthma. Furthermore, Maarsingh found that EMG measurements of the diaphragm combined with a histamine challenge can rule out bronchial hyperreactivity but not diagnose it. We hypothesise that this is due to the difference in the applied challenge. Histamine directly provokes a reaction in smooth muscle cells in all individuals, whilst exercise as an indirect agent provokes a reaction in asthmatics.
A possible confounder in the patient population is the large difference in FEV1 found at the baseline measurement. In the EIB group eight out of 20 patients showed a baseline FEV1 of under 70% of their predicted value. A lower baseline FEV1 is known not to be of influence in the occurrence of EIB in children [26]. In order to investigate whether EMG measurements were influenced by baseline lung function, data were also analysed with subjects that performed a baseline spirometry of over 70%. Excluding subjects with a baseline FEV1 of under 70% of predicted from analysis cleared the discrepancy in baseline FEV1 between groups but did not change statistical power in any of the measured parameters. Data are provided in the supplement.
EMG measurements of the diaphragm provide sensitive information but are also prone to disturbances and artefacts. Sitting still for 30 s may have altered a patient's breathing pattern during measurements. However, we emphasised sitting still during measurements and gave no breathing instructions. Slight movements, coughs and speech provide relatively large potential differences, outweighing the potential differences produced by activity of the diaphragm. During this study, close attention was paid to the position and movement of children during the 30 s intervals. Apparent artefacts were removed from measurements before analysis by visual inspection of the measured signal as well as the power spectral density of the measured signal. The applied windows and filters applied in post-processing may have been the reason we were unable to find reliable measurements of the accessory respiratory muscles in all patients, contrary to earlier studies by Maarsingh and Hutten [20, 22]. We only used measurements from the diaphragm because other sites provided inadequate results. Although windowing and filtering may have resulted in missing some data, the applied windows and filters in post-processing were required to minimise the effects of harmonic distortion and ensure only signals related to the respiratory frequency were included in the analysis.
The observed difference in peak amplitude at greater changes in FEV1 allows a distinction to be made between EIB and non-EIB. However, it is unclear whether change in peak amplitude after exercise in the non-EIB group is a physiological response to exercise. In healthy adults a similar pattern was observed [27, 28]. Analysis of airway response to exercise in healthy children would provide further insight into the normal electrophysiological response to exercise in children.
EMG enables easily applied measurements that do not disturb pulmonary physiology, in the future allowing automatic long-term monitoring in a clinical setting. However, more complex algorithms, automatic signal processing and assessment are required for application in a monitoring setting.
In conclusion, increases in EMG peak amplitudes at the diaphragm are strongly related to the decrease in FEV1 and can accurately distinguish between EIB and non-EIB. EMG measurements of the diaphragm provide an elegant, easily applied measure for EIB that does not disturb respiratory physiology and may be considered as an alternative when spirometry is not feasible.
Supplementary material
Supplementary Material
Please note: supplementary material is not edited by the Editorial Office, and is uploaded as it has been supplied by the author.
Supplementary material 00298-2019.SUPPLEMENT
Supplementary material 00298-2019.FIGURES1
Supplementary material 00298-2019.FIGURES2A
Supplementary material 00298-2019.FIGRUES2B
Supplementary material 00298-2019.FIGURES3
Acknowledgement
This work was previously presented at the American Thoracic Society International Conference 2019 in Dallas, TX, USA (Poster Discussion Session D30: “Asthma: What's new in assessment and treatment”; presentation A6106/614).
Footnotes
This article has supplementary material available from openres.ersjournals.com
This study is registered at www.trialregister.nl with identifier number NL6891. No deidentified patient data will be shared, no additional data will be shared and no other documents will be made available.
Author contributions: All authors are responsible for the contents of the manuscript. P.B. Keijzer, M.R. van der Kamp and J.M.M. Driessen conducted measurements. P.B. Keijzer was responsible for data analysis. F.H.C. de Jongh supervised signal analysis and processing.
Conflict of interest: P.B. Keijzer has nothing to disclose.
Conflict of interest: M.R. van der Kamp has nothing to disclose.
Conflict of interest: B.J. Thio has nothing to disclose.
Conflict of interest: F.H.C. de Jongh has nothing to disclose.
Conflict of interest: J.M.M. Driessen has nothing to disclose.
Support statement: This work did not require specific funding. The measurement device was borrowed from the University of Twente.
- Received October 30, 2019.
- Accepted April 22, 2020.
- Copyright ©ERS 2020
This article is open access and distributed under the terms of the Creative Commons Attribution Non-Commercial Licence 4.0.
References


