


Abstract
Being overweight or obese is associated with an increased risk of cardiovascular disease (CVD). Physical activity might reduce the risk associated with overweight and obesity. We examined the association between overweight and obesity and CVD risk as a function of physical activity levels in a middle-aged and elderly population.
The study was a prospective cohort study.
The study included 5344 participants aged 55 years or older from the population-based Rotterdam Study. Participants were classified as having high or low physical activity based on the median of the population. Normal weight (18.5–24.9 kg/m2), overweight (25.0–29.9 kg/m2) and obese participants (≥30 kg/m2) were categorized as having high or low physical activity to form six categories. We assessed the association of the six categories with CVD risk using Cox proportional hazard models adjusted for confounders. High physical activity and normal weight was used as the reference group.
During 15 years of follow-up (median 10.3 years, interquartile range 8.2–11.7 years), 866 (16.2%) participants experienced a CVD event. Overweight and obese participants with low physical activity had a higher CVD risk than normal weight participants with high physical activity. The HRs and 95% confidence intervals (CIs) were 1.33 (1.07–1.66) and 1.35 (1.04–1.75), respectively. Overweight and obese participants with high physical activity did not show a higher CVD risk (HRs (95%CIs) 1.03 (0.82–1.29) and 1.12 (0.83–1.52), respectively).
Our findings suggest that the beneficial impact of physical activity on CVD might outweigh the negative impact of body mass index among middle-aged and elderly people. This emphasizes the importance of physical activity for everyone across all body mass index strata, while highlighting the risk associated with inactivity even among normal weight people.
Introduction
Although overweight and obesity are associated with an increased risk of cardiovascular disease (CVD),1–3 higher levels of physical activity are associated with a decreased risk of CVD.4–6 However, to what extent physical activity can counterbalance the risk associated with overweight and obesity remains unclear.
Several studies have investigated the combined association of physical activity and body mass index (BMI) with CVD risk in middle-aged adults, but the results are inconsistent.7–12 A review combining studies that evaluated the risk associated with obesity and physical activity reported that four of eight studies favoured the hypothesis that the risk for cardiovascular mortality was lower in obese participants with high physical activity than in normal weight participants with low levels of physical activity.13 A study by Weinstein et al.,8 which assessed the joint effect of physical activity and BMI on coronary heart disease in women, reported that the risk of coronary heart disease associated with increased BMI was considerably reduced by higher levels of physical activity. These results indicate that the risk of CVD associated with a high BMI might be partly negated by physical activity. However, these previous studies included middle-aged participants and information among the elderly population remains scarce. It has been suggested that the risk of myocardial infarction and stroke associated with overweight and obesity are attenuated in older adults.14 This might be because BMI in older adults is a poor indicator of body fat and body fat distribution and BMI alone might not be a good indicator of CVD risk.15 Lean mass and fat mass may act as nutritional preserves during illness. Physical activity levels tend to decrease with age16 and therefore the role of physical activity on the association between BMI and CVD could differ between younger, middle-aged and elderly adults.
The current study aimed to investigate the role of physical activity in the association between BMI and CVD among middle-aged and elderly participants using data from the large population-based Rotterdam Study.
Methods
Study population
This study was embedded within the Rotterdam Study, a prospective population-based cohort study among people aged 55 years or older in the municipality of Rotterdam, The Netherlands. The baseline examination of the original cohort (RS-I) was completed between 1990 and 1993. In 2000–2001, the Rotterdam Study was extended with 3011 participants who had become ≥55 years old or had moved into the study district (RS-II). For the current study, we used data from participants attending the third examination of the original cohort (RS-I-3) between 1997 and 1999 (n = 4797) and the participants attending the first examination of the extended cohort (RS-II-1) between 2000 and 2001 (n = 3011). Of this combined total (n = 7808), 6510 participants completed data collection for both physical activity and BMI. Total of 1122 people with prevalent CVD were excluded and six were excluded due to missing follow-up data. Participants who were considered being as underweight (BMI <18.5 kg/m2) were also excluded (n = 38). Eventually, 5344 participants were included in the analyses. Trained research assistants interviewed the participants at home to collect the baseline information.
All participants gave written informed consent and the study protocol was approved by the medical ethics committee of Erasmus University, Rotterdam. Detailed information on the design of the Rotterdam Study can be found elsewhere.17 The Rotterdam Study has been approved by the institutional review board (medical ethics committee) of the Erasmus Medical Center and by the medical ethics committee according to the Wet Bevolkingsonderzoek ERGO (Population Study Act Rotterdam Study), executed by the Ministry of Health, Welfare and Sports of The Netherlands.
Assessment of anthropometric data and physical activity
Height and weight were measured with the participants standing without shoes and heavy outer garments. BMI was calculated as weight divided by height squared (kg/m2). Physical activity levels were assessed with an adapted version of the Zutphen Physical Activity Questionnaire,18 including questions regarding walking, cycling, sports, gardening and housekeeping activities. To quantify the intensity of activity, we assigned metabolic equivalent of task (MET) scores to all activities according to the 2011 updated version of the Compendium of Physical Activities.19 We multiplied the MET values of specific activities with time (in hours) per week spent in that activity to calculate MET·hours·week−1 in the total physical activity. Further details on the assessment of physical activity has been reported elsewhere.20
Assessment of confounders
Alcohol use was defined as the number of glasses per day. Education was assessed according to the standard classification of education comparable with the international standard classification of education and was grouped into four categories: elementary education; lower secondary education; higher secondary education; and tertiary education.21 Smoking was divided into two categories: current and other (former and never). Dietary information was not collected at the same time as the physical activity data were collected and therefore we used the diet information measured in the first examination of the original cohort (RS-I-1 between 1989 and 1993) and in the third examination of the extended cohort (RS-II-3 between 2011 and 2012). Information on diet was obtained through a 170-item validated semi-quantitative food frequency questionnaire.22 From the questionnaire, an overall healthy diet score representing adherence to the Dutch dietary guidelines was calculated as described previously.23 A family history of premature myocardial infarction was defined as having a parent, sibling or child who experienced a myocardial infarction at the age of ≤65 years and was used as a binary variable (yes/no). As 97.6 % of our participants were white, adjustment for ethnicity was not required.
Clinical outcomes
The main outcome measure under study was incident hard atherosclerotic CVD composed of fatal and non-fatal myocardial infarction, other coronary heart disease mortality, and fatal and non-fatal stroke.24 Data on clinical outcomes including CVD were collected through an automated follow-up system involving digital linkage of the study database to medical records managed by general practitioners working in the research area. Trained research assistants collected notes, outpatient clinic reports, hospital discharge letters, electrocardiograms and imaging results from general practitioners and hospital records. Research physicians then independently adjudicated all the data on potential events. Medical specialists, whose judgements were considered decisive, then reviewed the potential cases. Information on vital status was additionally obtained from the central registry of the municipality of the city of Rotterdam. Follow-up was complete until 1 January 2012.
Statistical analysis
Participants were classified as having a high or low level of total physical activity by using the median value. Normal weight (<25 kg/m2), overweight (25–29.9 kg/m2) and obese (≥30 kg/m2) participants were categorized as being high or low physically active, forming six categories. Baseline characteristics of the study population are presented as mean ± SD values (or frequency and percentage when appropriate) for the six phenotypes formed by the physical activity levels (lower and higher) across different BMI categories.
We first estimated the CVD risk associated with the BMI categories and with physical activity using Cox proportional hazards regression analysis. In our main analysis, we used Cox proportional hazards regression analysis to estimate the hazards ratio (HR) and 95% confidence intervals (95% CIs) for the six phenotypes in association with CVD, using normal weight with high levels of physical activity as the reference category. Proportional hazards assumptions were confirmed in all Cox models by visually comparing the Kaplan–Meier curves of the different groups. The models were adjusted for age, sex, smoking, alcohol use, education, diet quality and family history of premature myocardial infarction. We decided a priori not to adjust for systolic blood pressure, total or high-density lipoprotein cholesterol or plasma glucose, as they are all intermediates in the association between BMI and CVD.
Physical activity, BMI and the joint BMI and physical activity phenotypes were entered as categorical variables in the model. We also assessed whether there was a trend across categories of BMI by entering the categorical BMI variable as continuous in the model. We did not observe a significant interaction of sex or age with BMI, physical activity or the joint BMI and physical activity phenotypes. No multiplicative or additive interaction between BMI and physical activity was observed.
Sensitivity analyses
As a result of the high competing risk of non-CVD death among elderly people, we performed a competing risk analysis using the method proposed by Fine and Gray.25 We also repeated the main analysis in participants older than 65 years to specifically examine associations in elderly people. We further investigated the possible effect of reverse causation by excluding events in the first two years. We repeated the analysis in participants without missing information on diet.
We had 24.6% missing data on diet quality. For other covariates, we had <5% missing data. We used the single imputation by the Expectation Maximization method in SPSS. The analyses were performed using IBM SPSS Statistics for Windows (IBM, Armonk, NY, USA) and R version 3.2.1 (R Foundation for Statistical Computing, Vienna, Austria). Statistical significance was accepted at p < 0.05.
Results
The median level of physical activity by which the two physical activity categories were created was 79.4 MET·hours·week−1. The median and interquartile range (IQR) for the high and low categories were 111.3 (93.7–139.6) and 54.6 (39.0–67.5), respectively. These numbers correspond to four hours and two hours per day of moderate intensity physical activity (4 MET). Table 1 shows the characteristics of the participants by the level of physical activity and BMI category. The participants with low levels of physical activity were more often male, older and current smokers than the participants with a high level of physical activity. The mean age of the population was 68.5 years (standard deviation 7.9; range 55–97 years) and 60.1% were women. There were 866 (16.2%) incident CVD events during a median follow-up of 10.3 years.
Characteristics at baseline as a function of metabolic health status and body mass index.
| High levels of physical activity | Low levels of physical activity | |||||
|---|---|---|---|---|---|---|
| Normal weight | Overweight | Obese | Normal weight | Overweight | Obese | |
| Participants | 924 | 1279 | 468 | 841 | 1256 | 576 |
| Age (years) | 67.3 ± 6.9 | 67.6 ± 7.0 | 66.9 ± 7.0 | 70.0 ± 8.8 | 69.4 ± 8.6 | 69.4 ± 8.5 |
| Women | 645 (69.8) | 834 (65.2) | 371 (79.3) | 416 (49.5) | 547 (43.6) | 399 (69.3) |
| Body mass index (kg/m2) | 23.1 ± 1.5 | 27.2 ± 1.4 | 33.0 ± 2.7 | 23.1 ± 1.4 | 27.3 ± 1.4 | 33.2 ± 3.2 |
| Physical activity | ||||||
| Median (IQR) total physical activity (MET·hours·week−1) | 112.2 (95.0–139.4) | 111.3 (93.0–139.6) | 110.1 (93.5–139.6) | 54.4 (39.7–67.4) | 54.9 (38.9–67.4) | 54.8 (37.3–68.2) |
| Participating in walking | 921 (99.7) | 1277 (99.8) | 468 (100.0) | 829 (98.6) | 1233 (98.2) | 555 (96.4) |
| Participating in cycling | 696 (75.3) | 944 (73.8) | 306 (65.4) | 433 (51.5) | 669 (53.3) | 216 (37.5) |
| Participating in domestic work | 919 (99.5) | 1268 (99.1) | 464 (99.1) | 809 (96.2) | 1177 (93.7) | 554 (96.2) |
| Participating in gardening | 490 (53.0) | 661 (51.7) | 216 (46.2) | 305 (36.3) | 471 (37.5) | 165 (28.6) |
| Participating in sports | 476 (51.5) | 592 (46.3) | 196 (41.9) | 240 (28.5) | 385 (30.7) | 149 (25.9) |
| Current smoking | 198 (21.4) | 202 (15.8) | 56 (12.0) | 195 (23.2) | 209 (16.6) | 87 (15.1) |
| Dutch healthy diet index | 49.1 (10.9) | 50.3 (11.0) | 50.2 (11.0) | 47.8 (11.3) | 48.4 (11.3) | 50.2 (10.3) |
| Median (IQR) alcohol use (glasses day−1) | 0.4 (0.1–1.4) | 0.6 (0.1–1.7) | 0.29 (0.0–1.1) | 0.5 (0.0–1.4) | 0.6 (0.1–2.0) | 0.2 (0.0–1.0) |
| Education | ||||||
| Elementary | 109 (11.8) | 161 (12.6) | 77 (16.5) | 94 (11.2) | 149 (11.9) | 97 (16.8) |
| Lower secondary | 434 (47.0) | 618 (48.3) | 229 (48.9) | 300 (35.7) | 505 (40.2) | 272 (47.2) |
| Higher secondary | 253 (27.4) | 371 (29.0) | 130 (27.8) | 299 (35.6) | 393 (31.3) | 143 (24.8) |
| Tertiary | 128 (13.9) | 129 (10.1) | 32 (6.8) | 148 (17.6) | 209 (16.6) | 64 (11.1) |
IQR: interquartile range; MET: metabolic equivalent of task.
Data are presented as mean ± SD values or n (%) unless stated otherwise.
Body mass index was calculated as weight in kilograms divided by height in metres squared. Categories were defined as normal weight (18.5 < 25 kg/m2), overweight (25–30 kg/m2) and obese (≥30 kg/m2).
Table 2 presents the association of BMI categories and level of physical activity with incident CVD separately. Compared with normal weight participants, overweight (HR 1.13, 95% CI 0.97–1.57) and obese (HR 1.20, 95% CI 0.99–1.46) participants were not at significantly increased risk of CVD. In addition, we observed no significant trend across categories of BMI (p = 0.05 for trend). Compared with the higher level of physical activity (irrespective of obesity), participants with a low level of physical activity were at higher risk of CVD (HR 1.22, 95% CI 1.06–1.41).
Association of body mass index and physical activity levels with cardiovascular disease.
| n/N | Hazards ratio (95% confidence interval) | ||
|---|---|---|---|
| Body mass index | Normal weight | 270/1765 | 1 (reference) |
| Overweight | 428/2535 | 1.13 (0.97–1.57) | |
| Obese | 168/1044 | 1.20 (0.99–1.46) | |
| Physical activity | High physical activity | 367/2671 | 1 (reference) |
| Low physical activity | 499/2673 | 1.22 (1.06–1.41)* |
n: number of events; N: number at risk.
Analyses adjusted for age, sex, education, diet quality, alcohol and smoking.
p < 0.05 vs. reference group.
Figure 1 shows the association between the joint physical activity and BMI phenotypes with incident CVD. Compared with normal weight participants with high levels of physical activity, the risk of CVD was not significantly different in overweight (HR 1.03, 95% CI 0.82–1.29) and obese (HR 1.12, 95% CI 0.83–1.52) participants with a high level of physical activity. By contrast, overweight and obese participants with a low level of physical activity were at increased risk of CVD compared with normal weight participants with high physical activity. The corresponding HRs (95%CIs) were 1.33 (1.07–1.66) and 1.35 (1.04–1.75), respectively.
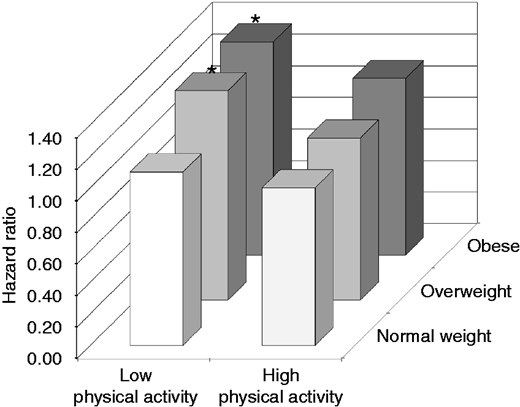
Association between joint physical activity and body mass index categories with cardiovascular disease. Analyses adjusted for age, sex, education, diet quality, alcohol, smoking and family history of premature myocardial infarction. *p < 0.05 vs. reference group.
Sensitivity analyses
Table S1 in the supplementary data (available online) shows that the HRs (95% CIs) from the competing risk approach were not substantially different from our original analysis. When we repeated the main analysis in adults aged ≥65 years, or when we excluded the first two years of follow-up, we found similar results (Table S2 and S3 in the supplementary data; available online) to those in the total population. The results for the participants with information on diet quality were similar to the main analysis (Table S4 in the supplementary data; available online).
Discussion
In this population-based study of adults aged ≥55 years, overweight and obese participants with high levels of physical activity were not at increased risk of CVD compared with their normal weight counterparts. By contrast, among the participants with lower levels of physical activity, being overweight and obese was associated with a higher risk of CVD. Low physical activity levels increased the risk of CVD in the total population. These findings suggest that the impact of physical activity on CVD might outweigh that of BMI among middle-aged and elderly participants.
Similar studies regarding the joint association of BMI and physical activity with CVD are consistent with our findings.7–12 A study of 18,892 Finish men and women aged 25–74 years concluded that physical inactivity has an independent association with risk of CVD, whereas obesity increases the risk through the modification of other risk factors.11 In addition, the Women’s Health Study found that the risk of coronary heart disease associated with elevated BMI is considerably reduced by higher physical activity levels.8 However, the risk was not completely eliminated, which reinforces the importance of being lean and physically active.8 Similarly, the analysis from the Nurse’s Health Study of 88,393 women aged ≥34–59 years showed that being moderately physically active attenuated, but did not eliminate, the adverse effect of obesity on the risk of coronary heart disease.7 They also showed that being lean did not counteract the increased risk associated with physical inactivity.7
In the current study, we extended the evidence to middle-aged and elderly participants. We showed that, once analysed separately, the magnitude of the association between reduced physical activity and CVD was roughly similar to that between obesity and CVD, although the latter did not reach statistical significance. However, once analysed jointly, overweight and obese participants with high levels of physical activity were not at a significantly increased risk of CVD, whereas being overweight and obese was associated with an increased risk of CVD among physically inactive participants. Our results, although not refuting the cardiovascular risk associated with overweight and obesity, suggest that the impact of physical activity on CVD might outweigh that of BMI among middle-aged and elderly adults.
In addition to leisure time physical activity, we included transportation and housework in the assessment of total physical activity in the current study. Therefore our results extend previous findings and indicate that overall higher levels of physical activity (irrespective and beyond leisure time) can be beneficial to reduce CVD risk. Our study was conducted in an older population. Elderly participants might have more difficulties in engaging in sport or exercise (leisure time physical activity) and spend a relatively large proportion of their time on housework compared with younger participants.26 Our study emphasizes the importance of the beneficial effects of physical activity as part of our daily life, as supported by recent recommendations.27
Overweight and obese participants with a low level of physical activity had a 1.33 and 1.35 times higher risk of CVD than normal weight participants with a high level of physical activity. Other studies7,8,11,12 have reported a up to three times higher CHD risk7,8 and up to 2.36 times higher CVD risk11,12 for obese participants with low physical activity compared with normal weight participants with high activity. The lower risk in the current study might be explained by the relatively high levels of physical activity in the low physical activity group. The median level of physical activity for the low group was 54.6 MET·hours·week−1, corresponding to two hours per day of moderate intensity physical activity. This is a higher physical activity level than reported in the low group of other studies.7,8,11,12 However, although our risk estimates were relatively low, our results do not indicate that the risk associated with inactivity should be neglected. For public health programmes, it remains important to focus on increasing the physical activity levels of populations and to concomitantly stress body weight management.
The mechanism underlying the harmful effect of overweight and obesity on CVD risk has been well investigated. Adipose tissue releases free fatty acids, interleukins and cytokines that influence cardiac function by accelerating atherosclerotic processes, inflammation, and endothelial and coagulation dysfunction.28,29 The plausible mechanisms through which physical activity has been suggested to improve CVD risk are improved endothelial function, stabilization of vulnerable plaques (preventing plaque rupture) and reduced myocardial oxygen demand.30 This indicates that physical activity directly reduces and combats the harmful effect of the prothrombotic factors released by adipose tissue.8,31
Obese participants with high levels of physical activity conferred a similar risk of CVD as normal weight participants with low level of physical activity when we compared both groups with normal weight participants with a high level of physical activity. Notably, both groups were at higher risk of CVD, although the associations did not reach the significance threshold. These findings suggest that being lean might counteract the increased risk associated with physical inactivity, and being physically active could possibly slightly offset the increased risk of being obese. Therefore our study confirms previous findings that physically active and lean participants are at low risk of CVD7,11 and extends these findings to middle-aged and elderly participants.
The major strengths of the current study are its prospective population-based design, the large sample size of adults aged ≥55 years and the relatively long follow-up period. We had a reliable assessment of CVD events and were able to adjust for several lifestyle factors, thereby minimizing the possibility of the observed associations being explained by confounding. However, several limitations should be considered. First, our conclusions are drawn from baseline measurements. Therefore some misclassification could have occurred due to changes in BMI or physical activity levels during follow-up. However, weight gain tends to be linear over time and therefore the difference between the groups is likely to remain constant, even with weight change.8 Our results are based on self-reported physical activity. Although our questionnaire has been shown to be both valid and reliable,32 potential recall bias and social desirability cannot be excluded. These last two limitations could have resulted in bias towards the null hypothesis. Information on diet quality was not collected at the same time as BMI and physical activity. We acknowledge this limitation and used this information as a proxy of diet quality. Information on diet quality was missing for 24.6% of participants and was therefore imputed. Although we cannot fully exclude the possibility of residual confounding by diet quality, restricting the analysis to participants with diet information revealed comparable results. It may be hypothesized that participants with poor health engage in less physical activity than others, thereby creating the opportunity for reverse causation. However, in our analyses, exclusion events that occurred within the first two years of follow-up showed comparable results.
In this long-term follow-up study of older adults, the risk associated with overweight and obesity was attenuated in participants with high physical activity levels. This suggests that regular physical activity reduces the CVD risk in older adults and that further benefits can be gained from maintaining a healthy weight.
Acknowledgement
The dedication, commitment and contribution of inhabitants, general practitioners and pharmacists of the Ommoord district to the Rotterdam Study are gratefully acknowledged.
Author contribution
The contributions of the authors were as follows: KD, CK and OHF had the original idea for the study. KD and CK jointly performed the statistical analysis, interpreted the data, drafted and critically revised the article. MAI, AH, MK and OHF revised the manuscript critically for important intellectual content. OF provided supervision. All authors read and approved the final article. CH and KD contributed equally to this work.
Declaration of conflicting interests
The author(s) declared no potential conflicts of interest with respect to the research, authorship, and/or publication of this article.
Funding
The author(s) disclosed receipt of the following financial support for the research, authorship, and/or publication of this article. The Rotterdam Study is funded by Erasmus MC and Erasmus University, Rotterdam, the Netherlands; the Netherlands Organisation for Scientific Research (NWO); the Netherlands Organisation for the Health Research and Development (ZonMw); the Research Institute for Diseases in the Elderly (RIDE); the Ministry of Education, Culture and Science; the Ministry for Health, Welfare and Sports; the European Commission (DG XII); and the municipality of Rotterdam. KD is supported Erasmus Mundus Western Balkans (ERAWEB), a project funded by the European Commission. MK is supported by Fund the AXA Research Fund. OHF works in ErasmusAGE, a centre for ageing research across the life course funded by Nestlé Nutrition (Nestec Ltd) and Metagenics Inc. Nestlé Nutrition (Nestec Ltd) and Metagenics Inc. had no role in the design and conduct of the study, the collection, management, analysis and interpretation of the data or the preparation, review or approval of the manuscript.
References
Author notes
These authors contributed equally to this work

Comments