

Abstract
Background: Variable responses to hypothermic neuroprotection are related to the clinical heterogeneity of encephalopathic babies; hence better disease stratification may facilitate the development of individualized neuroprotective therapies. Objectives: We examined if whole blood gene expression analysis can identify specific transcriptome profiles in neonatal encephalopathy. Material and Methods: We performed next-generation sequencing on whole blood RNA from 12 babies with neonatal encephalopathy and 6 time-matched healthy term babies. Genes significantly differentially expressed between encephalopathic and control babies were identified. This set of genes was then compared to the host RNA response in septic neonates and subjected to pathway analysis. Results: We identified 950 statistically significant genes discriminating perfectly between healthy controls and neonatal encephalopathy. The major pathways in neonatal encephalopathy were axonal guidance signaling (p = 0.0009), granulocyte adhesion and diapedesis (p = 0.003), IL-12 signaling and production in macrophages (p = 0.003), and hypoxia-inducible factor 1α signaling (p = 0.004). There were only 137 genes in common between neonatal encephalopathy and bacterial sepsis sets. Conclusion: Babies with neonatal encephalopathy have striking differences in gene expression profiles compared with healthy control and septic babies. Gene expression profiles may be useful for disease stratification and for developing personalized neuroprotective therapies.
Introduction
Neonatal encephalopathy is a leading cause of death and neurodisability among full-term newborn infants [1]. In healthy animal models of an abrupt reduction of cerebral oxygen and/or blood flow, rescue hypothermia therapy is highly neuroprotective [2].
Several randomized controlled trials have shown that therapeutic hypothermia reduces the incidence of death and long-term neurodisability after moderate or severe neonatal encephalopathy [3]. In clinical practice, hypothermic neuroprotection is not universal, and half of the cooled babies develop adverse neurodevelopmental outcomes [3]. One of the key reasons for this lack of neuroprotection is clinical heterogeneity [4]. For example, brain injury caused by acute or chronic hypoxia may require different therapeutic approaches [5]. Furthermore, the coexistence of perinatal infection or inflammation affects the efficacy of therapeutic interventions [4].
This is a major roadblock in the clinical translation of over 15 novel highly promising neuroprotective drug therapies for neonatal encephalopathy which are effective in animal models and are awaiting evaluation in clinical trials [6]. Hence, an effective and rapid disease stratification tool based on underlying disease mechanisms may aid in developing personalized neuroprotective therapies.
In the past decades there has been growing evidence that specific infectious and inflammatory diseases elicit unique patterns of gene expression measured in blood. These transcriptomic signatures have been effectively exploited in a wide range of acute and chronic infections, and efforts are currently focused on developing rapid diagnostic tests suitable for use in clinical practice [7-9]. It is not known whether the neonatal response to hypoxia causes changes in gene expression in peripheral blood, although cell culture studies demonstrate that oxygen sensing shapes the immune response and controls cell survival, with increased neutrophil survival and T-cell differentiation mediated by NF-κB pathway activation [10, 11].
Our aim was to assess if whole blood host gene expression profiles in neonatal encephalopathy are different from those in healthy and septic newborn babies and to describe the underlying biological pathways of the key genes involved.
Methods
We recruited 12 full-term babies with neonatal encephalopathy undergoing therapeutic hypothermia and 6 gestation- and postnatal age-matched healthy control babies from three university hospitals (Imperial College Healthcare NHS Trust [UK], Medway NHS Foundation Trust [UK], and Università degli Studi della Campania “Luigi Vanvitelli” [Italy]) over a 1-year period.
One member of the research personnel performed a standardized neurological examination within 6 h after birth using the NICHD Neonatal Research Network (NRN) hypothermia trial encephalopathy staging (based on modified Sarnat staging). The original NICHD NRN classification classified babies into moderate or severe encephalopathy, and this was later expanded to include babies with mild encephalopathy [12]. However, the clinical decision to provide therapeutic hypothermia was based on the attending clinician’s preference.
We collected 0.5 mL of peripheral venous or arterial blood in 1.4 mL ribonucleic acid (RNA)-stabilizing solution (PreAnalytiX, Qiagen/BD) within 12 h after birth, as per the manufacturer’s instructions. The blood samples were initially stored at –80°C and then transported to the Health Research Institute La Fe (Valencia, Spain) for RNA extraction and next-generation sequencing.
In addition, all encephalopathic babies had detailed infection screens (blood culture, C-reactive protein, and a full blood count) and a structured neurological examination as a part of their standard clinical care. Babies with bloodstream-positive infection, chromosomal abnormalities, and major congenital malformations were excluded.
RNA Extraction, Next-Generation Sequencing, and Read Alignment
We extracted total RNA using a PAXgene Blood RNA Kit v2 (PreAnalytiX) according to the manufacturer’s instructions and assessed RNA integrity using a 2100 Bioanalyzer (Agilent). We used only samples with an RNA integrity number of at least 7 for analysis. Ten nanograms of total RNA were reverse transcribed using the Ion AmpliSeq Transcriptome Human Gene Expression Kit following the protocol of the manufacturer (Thermo Fisher Scientific). Target genes were amplified using an Ion AmpliSeq Transcriptome Human Gene Expression Core Panel (Thermo Fisher Scientific) and the primer sequences were then partially digested. These amplicons were then ligated to barcode adapters and were purified using Agencourt AMPure XP reagent (Beckman Coulter Inc.).
After purification, the barcoded amplicons were eluted and quantified by qPCR (Viia7 Real-Time PCR System; Thermo Fisher Scientific) and normalized prior to emulsion PCR and chip loading on the Ion Chef system with an Ion PI Hi-Q Chef Kit and PI chip (Thermo Fisher Scientific), obtaining reads with an average length of 200 bp.
Read alignment for the AmpliSeq sequencing data was performed using the ampliSeqRNA plugin available for Ion Torrent sequencing platforms (Thermo Fisher Scientific) as per the manufacturer’s instructions.
Data Analysis
Aligned reads were converted into summarized gene counts and normalized for gene length. In order to summarize the data and identify sources of variance and outliers, we used principal component analysis to explore the sequencing data. We also assessed interindividual variability in gene expression by calculating the coefficient of variation divided by the mean for all the genes in each sample of the neonatal encephalopathy, control, and sepsis groups.
Normalization factors and negative binomial dispersions were estimated from the raw count data. With these estimates, negative binomial generalized linear models were adjusted for each gene by conducting likelihood tests.
Negative binomial models were fitted and hypothesis testing was performed using likelihood ratio tests. The p values were corrected for multiple testing using the Benjamini-Hochberg false discovery rate (FDR) method to control for type I errors. Statistical analysis was performed using R (v3.3.1; R Project for Statistical Computing) and the DESeq2 (v1.17.18) R package [13].
Subsequently, the data were analyzed through the use of Ingenuity Pathway Analysis (Qiagen Inc.). Ingenuity Pathway Analysis was used to assess the biological pathways enriched in the differentially expressed genes. Pathway analyses were carried out using the first 1,000 most significant genes ranked by FDR value with an absolute log2 fold change of > 1.5 and which were associated with biological functions in the Ingenuity Pathways Knowledge Base. The significance of the canonical pathways was tested using Fisher’s exact test to minimize the probability of detecting enrichment by chance alone.
To assess the diagnostic potential of gene expression in neo-natal encephalopathy, we assessed the overlap of the differentially expressed genes between neonatal encephalopathy and healthy controls, with the genes differentially expressed in bacterial neonatal sepsis (GSE25504) [7]. Patients with blood culture-positive sepsis formed the neonatal sepsis group and were used for the analysis [7].
Using GEO2R analysis (http://www.ncbi.nlm.nih.gov/geo/geo2r/), we first identified the significantly differentially expressed genes by comparing neonates with bacterial sepsis (n = 10) to healthy controls (n = 6), and we then assessed the overlap between the two different gene sets (genes with an FDR < 0.05, absolute log2 fold changes ≥1).
Statistical Analysis
Clinical data are described as n (%) or median and interquartile range where appropriate. Statistical analysis was performed using the Mann-Whitney U test for continuous variables. The Pearson χ2 test or the Fisher exact test was used to evaluate the difference in prevalence rates.
Analyses were performed with SPSS Statistics 24 (IBM Corp., USA), and a p value of < 0.05 was considered statistically significant.
Results
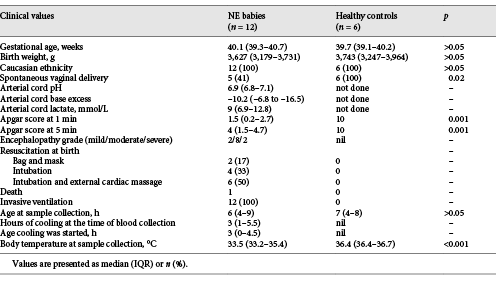
The mean birth weight, gestational age, ethnicity (all Caucasian), and age at the time of blood sampling were similar between encephalopathic and healthy control babies (Table 1). The encephalopathic babies had been receiving therapeutic cooling therapy for a median of 3 h at the time of blood collection; hence their core body temperature was lower (33.5°C) than that of the healthy control babies (36.4°C). Two of the babies recruited had mild neonatal encephalopathy. In both cases, the Apgar score at 5 min was ≤5, and the decision to provide therapeutic hypothermia was based on the attending clinician’s preference.
Clinical characteristics of the babies with neonatal encephalopathy (NE) and healthy control babies
The principal component analysis of gene expression showed good separation of the expression profiles of encephalopathic babies and healthy control babies captured by principal component 1 (Fig. 1). There was no significant difference in the coefficient of variation between the neonatal encephalopathy group and the control group and between the sepsis group and the control group (data not shown).
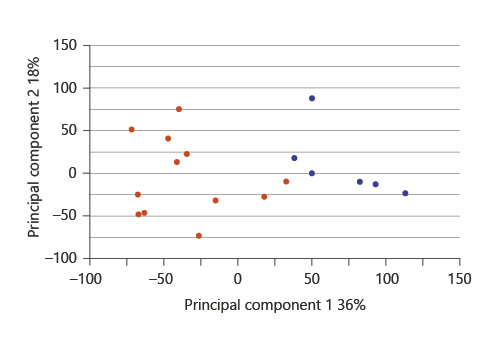
Two-dimensional principal component analysis plot of mean centering and scaling based on the complete gene expression. Patients are plotted according to their respective position along the two axes, either in red (neonatal encephalopathy) or blue (healthy control).
Two-dimensional principal component analysis plot of mean centering and scaling based on the complete gene expression. Patients are plotted according to their respective position along the two axes, either in red (neonatal encephalopathy) or blue (healthy control).
Negative binomial models identified 950 significantly differentially expressed genes with an FDR value < 0.0001 and an absolute log2 fold change > 1.5. Expression of the top 4 significant genes did not vary over the time within the encephalopathic and control groups (Fig. 2). Unsupervised hierarchical clustering of the significantly differentially expressed genes using Euclidean distance completely discriminated between the healthy babies and the neonatal encephalopathy cases (Fig. 3). Of these genes, 280 (29%) were overexpressed in neonatal encephalopathy and 670 (71%) were underexpressed. None of these genes were part of the cold-inducible genes [14].

Scatter plot of the top 4 significant genes according to the timing of blood sample collection (hours of age) in the neonatal encephalopathy (red) and control (blue) groups.
Scatter plot of the top 4 significant genes according to the timing of blood sample collection (hours of age) in the neonatal encephalopathy (red) and control (blue) groups.
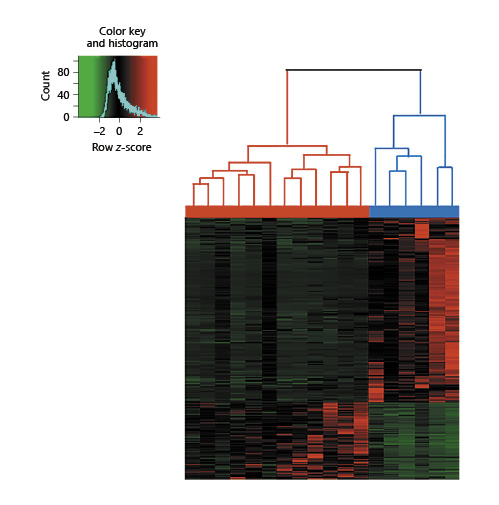
Unsupervised hierarchical clustering of 18 babies (12 babies with neonatal encephalopathy and 6 healthy babies, horizontal axis), with 950 genes derived from negative binomial likelihood tests. Each column represents a patient and each line a gene. Upregulated genes are represented in red and downregulated genes in green. The red bar represents neonatal encephalopathy (n = 12), and the blue bar represents healthy control babies (n = 6).
Unsupervised hierarchical clustering of 18 babies (12 babies with neonatal encephalopathy and 6 healthy babies, horizontal axis), with 950 genes derived from negative binomial likelihood tests. Each column represents a patient and each line a gene. Upregulated genes are represented in red and downregulated genes in green. The red bar represents neonatal encephalopathy (n = 12), and the blue bar represents healthy control babies (n = 6).
The most significant genes ranked by FDR were MALAT1 (FDR < 0.001) and RICTOR (FDR < 0.001). When the top 1,000 most significant genes with a log2 fold change > 1.5 in neonatal encephalopathy versus controls were used for pathway analysis, the most significant pathways identified were axonal guidance signaling (p < 0.001), granulocyte adhesion and diapedesis (p = 0.003), IL-12 signaling and production in macrophages (p = 0.003), and hypoxia-inducible factor 1α (HIF-1α) sig-naling (p = 0.004) (Fig. 4). The disease/function analysis revealed an olfactory receptor response after hypoxic/ischemic insult (p < 0.001) followed by cancer (p < 0.001) and cell-to-cell signaling and interaction (p < 0.001).

Canonical pathway analysis in terms of –log(p value) derived from the first 1,000 significant genes with a log2 fold change > 1.5 in the comparison between neonatal encephalopathy and healthy control babies. The upregulated genes are shown in red and the downregulated genes are shown in green.
Canonical pathway analysis in terms of –log(p value) derived from the first 1,000 significant genes with a log2 fold change > 1.5 in the comparison between neonatal encephalopathy and healthy control babies. The upregulated genes are shown in red and the downregulated genes are shown in green.
In the GSE25504 microarray gene expression experiment, 684 genes were found to be differentially expressed between bacterial sepsis and controls (FDR < 0.05, |log2 fold change| > 1). When we examined the overlap of differential expression of the two lists of significantly differentially expressed genes, 137 genes were found to be differentially expressed both in neonatal encephalopathy and in bacterial sepsis versus controls (Fig. 5a). However, out of these 137 genes, only 10 had concordance in the direction of expression in both data sets relative to healthy controls (Fig. 5b).

GSE25504 microarray gene expression experiment. a Venn diagram. 4,155 genes were differentially expressed between neonatal encephalopathy and healthy controls; 684 genes were differentially expressed between bacterial sepsis and healthy controls (FDR < 0.05 and |log2 fold change| ≥1). There were 137 genes in common between the neonatal encephalopathy and bacterial sepsis sets. b Cross-plot of the 137 shared genes (FDR < 0.05 and |log2 fold change| ≥1) showing that only 10 genes had the same fold change direction in the two data sets.
GSE25504 microarray gene expression experiment. a Venn diagram. 4,155 genes were differentially expressed between neonatal encephalopathy and healthy controls; 684 genes were differentially expressed between bacterial sepsis and healthy controls (FDR < 0.05 and |log2 fold change| ≥1). There were 137 genes in common between the neonatal encephalopathy and bacterial sepsis sets. b Cross-plot of the 137 shared genes (FDR < 0.05 and |log2 fold change| ≥1) showing that only 10 genes had the same fold change direction in the two data sets.
Discussion
We have presented the first report on changes to the whole blood transcriptome in neonatal encephalopathy. The expression profile soon after birth in encephalopathic babies was strikingly different to that observed in age-matched healthy control babies. The main biological pathways involved in the hypoxic-ischemic response were axonal guidance signaling, granulocyte adhesion/diapedesis, IL-12 signaling, and HIF-1α signaling. There was minimal overlap in the host gene expression profiles of neonatal encephalopathy and bacterial infections, suggesting differences in underlying mechanisms.
Cells experiencing hypoxia undergo a variety of biological responses in order to adapt to these unfavorable conditions. Although hypoxia generally inhibits mRNA synthesis, the transcription of subsets of genes increases dramatically. Our data demonstrate strong differential expression in key genes of the hypoxic response, including HIF1A, MALAT1, and RICTOR (Fig. 6). Emerging data, based on different cell culture studies, indicate that HIF transcription factors act as master switches, orchestrating the cellular response to low oxygen levels, such that cells switch to anaerobic metabolism [15]. However, in these models, the interaction of HIF-1α with axon guidance genes also leads to neuronal migration defects [16]. Our gene expression data from neonates with neonatal encephalopathy corroborate these findings, as we show that there is increased expression of HIF1A and of genes in the axonal guidance pathway.
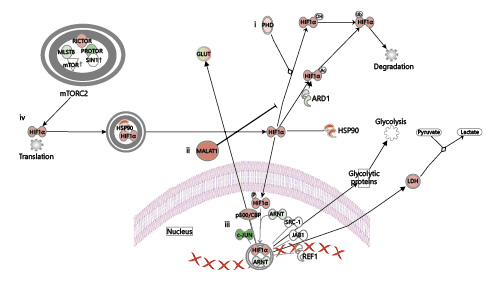
Coordination of the hypoxia response by HIF1A, MALAT1, and RICTOR. (i) In the presence of oxygen, prolyl hydroxylase (PHD) posttranslationally modifies HIF-1α, allowing it to interact with E3 ubiquitin ligase, leading to proteasomal degradation. (ii) Under hypoxic conditions, MALAT1 prevents the ubiquitination of HIF-1α, leading to HIF-1α accumulation and translocation to the nucleus, where it (iii) regulates the transcription of hypoxia-induced genes. (iv) HIF-1α mRNA translation is controlled by mTOR signaling pathways. The upregulated genes in our analysis are shown in red, while the downregulated genes are shown in green.
Coordination of the hypoxia response by HIF1A, MALAT1, and RICTOR. (i) In the presence of oxygen, prolyl hydroxylase (PHD) posttranslationally modifies HIF-1α, allowing it to interact with E3 ubiquitin ligase, leading to proteasomal degradation. (ii) Under hypoxic conditions, MALAT1 prevents the ubiquitination of HIF-1α, leading to HIF-1α accumulation and translocation to the nucleus, where it (iii) regulates the transcription of hypoxia-induced genes. (iv) HIF-1α mRNA translation is controlled by mTOR signaling pathways. The upregulated genes in our analysis are shown in red, while the downregulated genes are shown in green.
MALAT1 (metastasis-associated lung adenocarcinoma transcript 1), a long noncoding RNA, was the most significantly overexpressed transcript in neonatal encephalopathy versus healthy controls in our study. This is concordant with recent evidence showing that MALAT1 has a direct oxygen-dependent regulation and could be a useful biomarker of tumor hypoxia [17, 18]. In solid tumors, upregulation of MALAT1 increases anaerobic glycolysis by potentiating the actions of HIF-1α through decreased HIF-1α ubiquitination [19]. In HeLa cells, it has been shown to control the HIF-1α axis under hypoxic conditions in a positive feedback loop [20]. After ische-mic stroke, it regulates gene expression in cerebrovascular endothelial cells [21, 22], where it is proposed to protect against hypoxia-reperfusion-induced apoptosis [23]. MALAT1 has been of interest as a therapeutic target after its downregulation was found to suppress ischemic injury and autophagy in vitro and in vivo, which makes its strong upregulation in our data of particular interest [24].
The second most significantly expressed gene was RICTOR, a key component of mTOR complex 2, also regulating HIF-1α (Fig. 6). RICTOR inhibition in cell culture models leads to significant inhibition of HIF1A expression and tumor growth [25].
The Ingenuity Pathways functional analysis detected an olfactory receptor response (p < 0.001). Although the HIF transcriptional pathway is altered in medium- and long-term hypoxia, in a mouse model, olfactory receptors have acted as acute oxygen deprivation sensors, mediated through increased lactic acid detection, driving subsequent carotid body signaling and hyperventilation [26].
Only 137 of 4,155 significantly differentially expressed genes in neonatal encephalopathy were shared with the significantly differentially expressed genes found in neonatal sepsis, of which all but 10 showed an opposite direction of regulation (Fig. 5). The modest overlap is surprising, given that both neonatal encephalopathy and sepsis are associated with inflammation. In preclinical and in vitro studies, hypoxia stimulated neutrophil granule release and drove T-cell differentiation and cytotoxic activity [10]. Transcriptional changes after a hypoxia-reoxygenation insult include upregulation of inflammatory response genes including Cxcl10, Hmox1, and Nfkb1 and downregulation of oxidative phosphorylation pathways [27].
Our data suggest that neonatal encephalopathy and infection switch on inflammation via independent mechanisms. Although the underlying mechanisms are not known, hypothermic neuroprotection was lost in preclinical models of neonatal encephalopathy with coexistent gram-negative bacterial sepsis [4]. The striking differences in the transcriptomic profiles of neonatal sepsis and neonatal encephalopathy may provide insights into this loss of neuroprotection.
Our study has strengths and limitations. Firstly, the encephalopathic babies had a lower body temperature than the healthy babies and were being cooled at the time of blood sampling for gene expression. Therefore, we acknowledge that hypothermia may have contributed to the gene expression patterns. Although we cannot completely exclude that some of the differentially expressed genes were stimulated by hypothermia, preclinical evidence has shown that a reduction by 4–10°C for over 6 h was required to influence gene expression in animal models [28-32]. Moreover, none of the hypothermia-inducible genes were found to be significantly differently expressed between neonatal encephalopathy and control babies [33]. Given that hypothermia is now the standard therapy for neonatal encephalopathy in high-income countries, it is no longer possible to examine gene expression profiles in a matched noncooled encephalopathic cohort in these settings.
The encephalopathic babies in our study had been subject to resuscitation. Hence, their gene expression profiles may have been affected by the resuscitation maneuvers employed and administration of supplementary oxygen at birth [27, 34].
Secondly, we examined the gene expression changes in blood as a surrogate for cerebral injury, as hypoxic-ischemic injury is a systemic disease affecting all organs. These results may be different from organ-specific (brain tissue) gene expression changes. The detection of gene expression changes in blood offers an easily accessed proxy sample for infectious and inflammatory conditions with end-organ disease [35]. Our findings extend this model to neonatal encephalopathy and highlight the translational potential for gene expression profiling.
Finally, our modest sample size provides only preliminary data. The minimal overlap between the transcriptomic signatures of neonatal encephalopathy and those of bacterial infection supports the need for larger studies powered to examine the use of gene expression profiles in disease stratification.
Conclusion
We have shown that neonatal encephalopathy is associated with a characteristic gene expression profile at the time of birth. Our data provide insight into the neonatal response to hypoxia. Further studies are warranted to investigate whether gene expression profiling can stratify neonatal encephalopathy, and monitor the response to therapy, so that diagnostic tests based on gene expression might be developed that enable treatment with personalized neuroprotective therapies.
Acknowledgements
We thank Prof. Mike Levin (Professor of International Child Health, Imperial College London) for encouraging us to explore the genome-wide expression profile in neonatal encephalopathy and providing valuable insight into key aspects of the work.
Statement of Ethics
The study was approved by the research ethics committees/internal review boards of the participating hospitals, and all parents provided written informed consent.
Disclosure Statement
The authors have indicated that they have no potential conflicts of interest to disclose.
Funding Sources
The study was funded by a Garfield Weston Chair Endowment grant (F28312) and Imperial Biomedical Research Centre Grant (P51286) (Chief Investigator: S. Thayyil). P. Montaldo is funded by a Medical Research Council doctoral fellowship, and M. Kaforou is funded by a Welcome Trust post-doctoral fellowship (206508/Z/17/Z). G. Pollara is funded by an NIHR clinical lecturer fellowship. P.J. Lally and V. Oliveira are funded by National Institute for Health Research doctoral fellowships.
References
P. Montaldo and M. Kaforou, as well as M. Vento, J. Herberg, and S. Thayyil, equally contributed to this study.

