


Abstract
The increase of interleukin-4 (IL-4) level in tumor environment and the up-regulation of IL-4 receptor (IL-4R) on tumor cells have been long observed. However, their significance for tumor development has not been investigated. Here, we found that endogenous IL-4 promotes tumor growth because neutralizing IL-4 by 11B11 monoclonal antibody (mAb) significantly delayed the growth of MCA205 fibrosarcoma. We also observed that tumor cells with higher IL-4R expression have more chances to survive in immunocompetent mice. To investigate how endogenous IL-4 influences tumor growth, we established a pair of tumor cells with or without IL-4R expression from the common parental cells. IL-4R–competent tumors exhibit increased growth compared with its IL-4R–deficient counterparts when inoculated into syngeneic mice. This growth advantage was still kept in IL-4R knockout mice but was abrogated in mice given i.p. with IL-4 neutralizing mAb. In vitro analyses indicate that IL-4 neither affects the proliferation of tumor cells nor changes the expression of several immune-related molecules, such as MHC-I, Fas, and B7-H3. Nonetheless, IL-4 up-regulates antiapoptotic gene expression in tumor cells and reduces apoptosis of tumor cells in vivo, as evidenced by real-time PCR, immunoblotting, and TUNEL staining. These findings were helpful to understand the long clinical observation and revealed that endogenous IL-4, the product of host immune response, can be used by tumor cells to facilitate their growth. [Cancer Res 2008;68(21):8687–94]
Introduction
The close correlation between interleukin-4 (IL-4) and tumor progression has been observed in plenty of studies (1). In most tested patients with cancers as diverse as prostate cancer (2), breast cancer (3), renal cell cancer (4), non–small cell lung cancer (5), and other tumor types (1), the augmented IL-4–producing activity of such immune cells as peripheral blood mononuclear cells (PBMC) and tumor-infiltrating lymphocytes (TIL) have been detected using reverse transcription–PCR (RT-PCR), ELISA, or flow cytometry. Onishi and colleagues further showed that the IL-4 level correlates the stage and grade of renal cell carcinoma (4). Successful therapy of cancers, such as surgical excision of digestive cancer (6), immunotherapy of ovary cancer with tumor vaccine (7), or treating bladder cancer patients with BCG + IFN-α (8), reduced tumor burden and, meanwhile, substantially decreased IL-4 expression of PBMC and/or TIL in cancer patients. Studies using high metastatic tumor B16F10 and its low metastatic counterpart B16F1 also showed that IL-4 promotes tumor metastasis (9). Neutralization of IL-4 abolished B16F10 metastatic ability, and injection of IL-4 promotes the metastasis of B16F1 (9).
Besides the increased IL-4 expression in cancer patients, the elevated amount of IL-4 receptor (IL-4R) has also been detected on various tumor cells using I125–IL-4 binding assay or flow cytometry, including renal cell carcinoma (10), malignant melanoma (11), glioblastoma (12), head and neck cancer (13), etc., which usually express 1,000 to 13,000 IL-4R molecules per cell with variations depending on the tumor types, whereas much lower number of IL-4R, ranging about <50 to 500 molecules per cell, is present in such normal cells as B cells (14), endothelial cells (15), and monocytes (16). Moreover, the binding affinity of IL-4R on tumor cells is increased compared with those on normal cells (17). To show the expression of IL-4R in situ, Kawakami and colleagues analyzed lung cancer samples from 54 patients using tissue array. They found that 66% to 79% samples represented increased IL-4R expression compared with normal lung tissue (18). Additionally, high IL-4R expression was also detected on the tissue sections of bladder, breast, and prostate cancers (19).
The augmented IL-4–producing activity of immune cells in cancer patients and the increased IL-4R expression on tumor cells indicate that IL-4 may play a crucial role during tumor progression. However, whether IL-4 truly influences tumor growth in vivo and especially whether IL-4 exerts direct effects on tumor cells still remain elusive at present. Some studies tried to address this question by detecting the changes of tumor cells cultured with or without IL-4 (10, 19–23). Nonetheless, all of these were conducted in vitro and could not reveal the true scenario in vivo, in which a far more complicated regulatory network involving different molecules, cells, and the interaction between them is operating.
To make possible the investigation of IL-4 effects on tumor cells in vivo, we established a pair of tumor cells with or without IL-4–responsive ability, which are completely identical, except for the expression of IL-4R. We found that endogenous IL-4 can directly act on tumor cells, increasing their resistance to apoptosis and accelerating tumor growth. These findings shed light on the molecular mechanisms controlling tumor development and are helpful for designing novel therapeutic strategies.
Materials and Methods
Mice. BALB/c and C57BL/6 mice were purchased from Weitonglihua Corporation. IL-4R knockout (IL-4R−/−) mice on the BALB/c background were obtained from Max Delbruck Center for Molecular Medicine and maintained in the animal facilities at Institute of Biophysics under specific pathogen-free condition. Female mice (ages 6–8 wk) were used in this study, unless otherwise indicated. All animal experiments were conducted under the approval of the corresponding authorities.
Cells. MCA205 fibrosarcoma cells are of C57BL/6 origin (24). FB61 fibrosarcoma cells are of BALB/c origin and were established in our laboratory (data to be published). Among the different FB61 cells, FB61-0 is the parental tumor cell and FB61-7, FB61-10, and FB61-15 are in vivo passaged cells and correspondingly isolated from BALB/c mice 7#, 10#, and 15#, which carried tumors arising from FB61-0. FE32 fibrosarcoma cells were also established in our laboratory from BALB/c mice. Among the two types of FE32 cells, FE32-0 is the parental tumor cell and FE32-1 is the in vivo passaged cell. All cells were cultured in RPMI 1640 (Life Technologies) supplemented with 10% FCS (Life Technologies), 100 units/mL penicillin, and 100 μg/mL streptomycin.
Generation of tumor cell line from IL-4R−/− mice. Methylcholanthrene (MCA; 0.8 mg) emulsified in sesame oil were i.m. injected into IL-4R−/− BALB/c mice. Tumors were excised at the size of 1 to 2 cm and cut into fragments. Tumor fragments were sequentially grafted twice onto nude mice, twice onto IL-4R−/− mice, and twice onto IL-4R+/− mice. Tumor nodules were then isolated, minced, and digested into a single-cell suspension using trypsin/EDTA solution (2.5 mg/mL trypsin, 0.4 mmol/L EDTA, 0.2 mg/mL collagenase, and 0.1 mg/mL DNase resolved in 1 × D-HBSS). The cell line was named FA10 and maintained in RPMI 1640, as described above.
Plasmid and transfection. pM5neo–IL-4R plasmid with the ability to drive functional BALB/c IL-4R expression in eukaryotic cells was kindly provided by Dr. André Gessner (25). pM5neo–IL-4R and HyTk-EF1α, a plasmid carrying hygromycin-resistant gene, were mixed at the ratio of 10:1 and transfected into FA10 cells using Lipofectamine 2000 (Invitrogen) according to manufacturer's instruction. Cells were selected in 40 μg/mL hygromycin for 6 d and subjected to cloning. Mock cells were obtained by just introducing HyTk-EF1α plasmid into FA10 cells using the same procedure. Three IL-4R+ clones and five mock clones were obtained, and one clone of each type was used to further analyze in the present study.
Tumor growth in vivo. To compare the growth of IL-4R–competent and IL-4R–deficient tumors in vivo, FA10-4R and FA10-m cells were correspondingly injected into the left and right flanks of BALB/c mice at the amount indicated. The length, width, and height of tumors were measured by caliper every 3 to 4 d. Tumor volume was calculated by length × width × height. Mice bearing a tumor of >300 mm3 in volume (equal to a tumor with 10-mm length, 10-mm width, and 3-mm height) were recorded as tumor-positive. To neutralize endogenous IL-4, the mice were i.p. injected with 0.5 mg 11B11 ascites or, as control, 0.5 mg isotype-matched antibody every 4 d from 2 d before tumor inoculation for up to six times. To investigate the effects of endogenous IL-4 on MCA205 fibrosarcoma growth, C57BL/6 mice were s.c. injected with 1 × 10⁵ MCA205. At −2 and 8 d of tumor injection, the mice received i.p. injection of 1.2 mg 11B11 ascite or isotype-matched control antibody. To investigate the effects of in vivo passage on tumorigenic potential of tumor cells, BALB/c mice were injected at the right flanks with 1 × 10⁶ FB61-0 and at the left flank with 1 × 10⁶ FB61-7, FB61-10, or FB61-15. All the cells were harvested at logarithmic phase and washed thrice with sterile 1 × PBS before injection.
Flow cytometric analysis. To detect IL-4R expression on the surface of IL-4R–reconstituted tumor cells, 1 × 10⁶ FA10-4R and FA10-m cells were incubated with 0.5 μL PE–conjugated anti–mIL-4R monoclonal antibody (mAb; mIL-4R-M1; BD Biosciences) in 50 μL fluorescence-activated cell sorting (FACS) solution (1 × PBS containing 2% new calf serum) at 4°C for 1 h and collected on BD Biosciences FACSCalibur flow cytometer. Data were analyzed using CellQuest software.
To detect IL-4–induced expression changes of different molecules on tumor cells, FA10-4R and FA10-m cells were seeded into six-well plates at the amount of 3 × 10⁵ per well with or without the addition of 10 ng/mL mIL-4 (R&D Systems). In some cases, conditioned medium from mouse IL-4–producing tumor cells, FA10-IL-4, which were generated by introducing IL-4–expressing plasmid into FA10 cells, and FA10 cells were used. IL-4 content in conditioned medium was determined by ELISA set (BD Biosciences) and adjusted to a final concentration of 10 ng/mL when used as IL-4 source. After culturing for 48 h, FA10-4R and FA10-m cells were harvested, stained with PE-conjugated anti–H-2Kd (SF1-1.1; BD Biosciences), Fas (Jo2; BD Biosciences), or B7-H3 (M3.2D7; eBiosciences), and analyzed as above.
Carboxyfluoroscein succinimidyl ester assay. FA10-4R and FA10-m cells, with concentration of 1 × 10⁶/mL, were incubated with 5 μg/mL carboxyfluoroscein succinimidyl ester (CFSE; Molecular Probes) at 37°C for 15 min. After washing thrice in sterile 1 × PBS, 1 × 10⁶ CFSE-labeled and unlabeled cells were analyzed on BD FACS station to determine the fluorescence intensity of negative control (unlabeled cells) and positive control (CFSE-labeled but uncultured cells). The rest of CFSE-labeled cells were seeded into six-well plates and cultured for 4 d in the presence or absence of 10 ng/mL IL-4. Then, the cells were harvested and collected on BD FACS station using the same variable as collecting negative and positive controls.
3-(4,5-Dimethylthiazol-2-yl)-2,5-diphenyltetrazolium bromide assay. FA10-4R and FA10-m cells were seeded into 96-well plates at 3 × 10³ per well in 200 μL RPMI 1640 with or without the addition of 10 ng/mL IL-4. After 3 d of culturing, 3-(4,5-dimethylthiazol-2-yl)-2,5-diphenyltetrazolium bromide (MTT; Sigma) was added to the wells at a final concentration of 0.5 mg/mL. After further culturing for 4 h, the supernatant was discarded and MTT crystalline was dissolved in 150 μL DMSO. Absorbance values were measured at 490 nm on a microplate spectrophotometer (Bio-Rad Laboratories).
[3H]Thymidine incorporation. FA10-4R and FA10-m were seeded into six-well plates at 6 × 10⁴ per well and cultured with or without 10 ng/mL IL-4 for 24 h. Then, [3H]thymidine (Perkin-Elmer) was added to the cultures (2 μCi/mL). After 24 or 36 h, each well of culture was harvested with 300 μL of 1% SDS, thoroughly mixed with 3 mL scintillation cocktail (Perkin-Elmer), and counted in a liquid scintillation spectrometer (Perkin-Elmer).
Real-time PCR. RNA was extracted from FA10-4R and FA10-m culturing in the presence or absence of 10 ng/mL IL-4 for 36 h (Bcl-xL and cFLIP) or from FB61-0, FB61-7, FB61-10, and FB61-15 (IL-4R). RNA (2 μg) was used to synthesize cDNA by 9nt random primer (TaKaRa). Expression amount was determined using iQ SYBR Green Supermix on MyiQ real-time PCR detection system (Bio-Rad Laboratories). β-Actin was used as internal control. The specific primers are as follows: Bcl-xL-up, 5′-ACAGAGCAGACCCAGTAAGT-3′; Bcl-xL-down, 5′-ACCGCAGTTCAAACTCAT-3′; cFLIP-up, 5′-TTGATTGTATTGGCAACG-3′; cFLIP-down 5′-AACTGGCTACCTAACGACT-3′; IL-4R-up, 5′-TTTGCCTGTTCTGTTACTTCA-3′; IL-4R-down, 5′-GGCTTCGGGTCTGCTTATC-3′; β-actin-up, 5′-GAAGTGTGACGTTGACATCCGTA-3′; β-actin-down, 5′-CTCAGGAGGAGCAATGATCTTGA-3′.
Western blotting. FA10-4R and FA10-m cells were seeded into six-well plates at 3 × 10⁵ per well and cultured in the presence or absence of 10 ng/mL IL-4 for 48 h. The cells were then lysed by radioimmunoprecipitation assay buffer (RIPA) solution [50 mmol/L Tris-HCl (pH 7.5), 150 mmol/L NaCl, 1.0% Nonidet P-40, 0.5% (w/v) sodium deoxycholate, 0.1% (w/v) SDS, 1 mmol/L EDTA] supplemented with 100 μmol/L phenylmethanesulfonyl fluoride, 25 μg/mL aproptinin, 1 mmol/L sodium vanadate, and 50 mmol/L sodium fluoride. Aliquots of cell extracts were resolved on 10% SDS-PAGE gel and then transferred to nitrocellulose membrane (Amersham) on a semidry transfer apparatus (Bio-Rad Laboratories). The membrane was incubated with a dilution of primary antibody [1:500 anti–signal transducers and activators of transcription 6 (STAT6; clone 23, BD Biosciences), 1:500 anti–phosphorylated STAT6 (H71-773.58.11, BD Biosciences), 1:200 anti–Bcl-xL (H-5, Santa Cruz), 1:200 anti-cFLIP (H-202, Santa Cruz), or 1:500 anti–β-actin (Santa Cruz)] for 3 h at room temperature or overnight at 4°C, followed by incubation with horseradish peroxidase (HRP)–conjugated goat anti-mouse IgG secondary antibody (for STAT6, phosphorylated STAT6, and Bcl-xL) or HRP-conjugated goat anti-rabbit IgG secondary antibody [for cFLIP, caspase-3, poly(ADP-ribose) polymerase, and β-actin; Pierce]. After washing for six times with PBST, the membrane was incubated with a chemiluminescent substrate (SuperSignal West Dura Extended Duration Substrate, Pierce) for 5 min. Specific bands were visualized by exposing the membrane to X-ray film (Kodak) in a dark room.
Immunohistochemistry. Tissue sections were prepared as described previously (26). TUNEL assay was performed using VasoTACS kit according to manufacturer's instruction with a little modification (R&D Systems). Briefly, biotinylated nucleotides were added to DNA breaks with free 3′-hydroxyl residues by terminal deoxynucleotidyl transferase and were then bound with streptavidin-rhodamine. Cell nuclei were counterstained with 4′,6-diamidino-2-phenylindole (DAPI). Photos of tumor sections were taken by a microscope digital camera (DP71, OLYMPUS).
Results
Neutralization of endogenous IL-4 leads to decreased tumor growth. The increased IL-4 level in tumor sites and the augmented IL-4–producing activity of immune cells have been observed in cancer patients (1–5, 27). To test whether IL-4 influences tumor growth in vivo, we examined the growth of MCA205 fibrosarcoma in syngeneic mice treated with 11B11, an IL-4–neutralizing antibody, or control, an isotype-matched antibody. Tumor growth was significantly delayed in 11B11-treated mice compared with control antibody–treated mice (Fig. 1). At day 22 after tumor cell injection, the mean tumor volume has reached 712.5 ± 79.4 mm3 in control antibody–treated mice but only 447.5 ± 43.0 mm3 in 11B11-treated mice (Fig. 1). These data suggest that endogenous IL-4 promotes the growth of MCA205 fibrosarcoma.

Neutralization of endogenous IL-4 leads to decreased tumor growth. Female C57BL/6 mice were s.c. injected with 1 × 10⁵ MCA205 cells. At 2 d before and 8 d after tumor cell inoculation, the mice were i.p. injected with IL-4–neutralizing mAb 11B11 (▴, n = 6) or, as control, isotype-matched antibody (♦, n = 4). Tumor growth was monitored every 3 to 4 d and expressed as the mean volumes calculated by length × width × height. The experiment was done twice with similar results. *, P < 0.05.
Neutralization of endogenous IL-4 leads to decreased tumor growth. Female C57BL/6 mice were s.c. injected with 1 × 10⁵ MCA205 cells. At 2 d before and 8 d after tumor cell inoculation, the mice were i.p. injected with IL-4–neutralizing mAb 11B11 (▴, n = 6) or, as control, isotype-matched antibody (♦, n = 4). Tumor growth was monitored every 3 to 4 d and expressed as the mean volumes calculated by length × width × height. The experiment was done twice with similar results. *, P < 0.05.
The tumorigenic potential of tumor cells correlates with IL-4R abundance on their surfaces. High levels of IL-4R expression have been found on different tumor cells (10–13, 15, 28, 29). To assess whether IL-4R confers tumor cells with some growth advantage, we examined whether in vivo passage in immunocompetent mice could screen out tumor cells with higher IL-4R expression. To do this, another fibrosarcoma tumor cell line, FB61, was used, which was induced by chemical carcinogen MCA in BALB/c mice. The parental FB61 is weak in terms of tumorigenic potential, only leading to 62.5% (five in eight) tumor-positive mice 40 d after inoculating 1 × 10⁶ cells per mouse (Fig. 2A). After one passage in BALB/c mice, the tumorigenic potential is markedly increased. As shown in Fig. 2A, all of three in vivo passaged FB61 tumor cell lines, FB61-7, FB61-10, and FB61-15, developed tumors in 100% mice before day 30 after tumor inoculation. The IL-4R mRNA level in the different FB61 cell lines was determined by real-time PCR. As shown in Fig. 2B, all three in vivo passaged tumor cell lines have higher amounts of IL-4R mRNA, with the highest level in FB61-10. This result was further confirmed by flow cytometry using PE-conjugated anti–IL-4R mAb. As shown in Fig. 2C, both FB61-10 and FB61-15 express increased IL-4R compared with FB61-0. Strangely, FB61-7 displays two peaks in the histogram figure, indicating that it contains two cell populations with low or high IL-4R expression and might be on the way to be selected (Fig. 2C). When another MCA-induced fibrosarcoma cell line, FE32, was analyzed, we also observed the similar results (Supplementary Fig. S1A and B). These findings suggested that some correlations exist between the tumorigenic potential of tumor cells and IL-4R abundance on their surface.
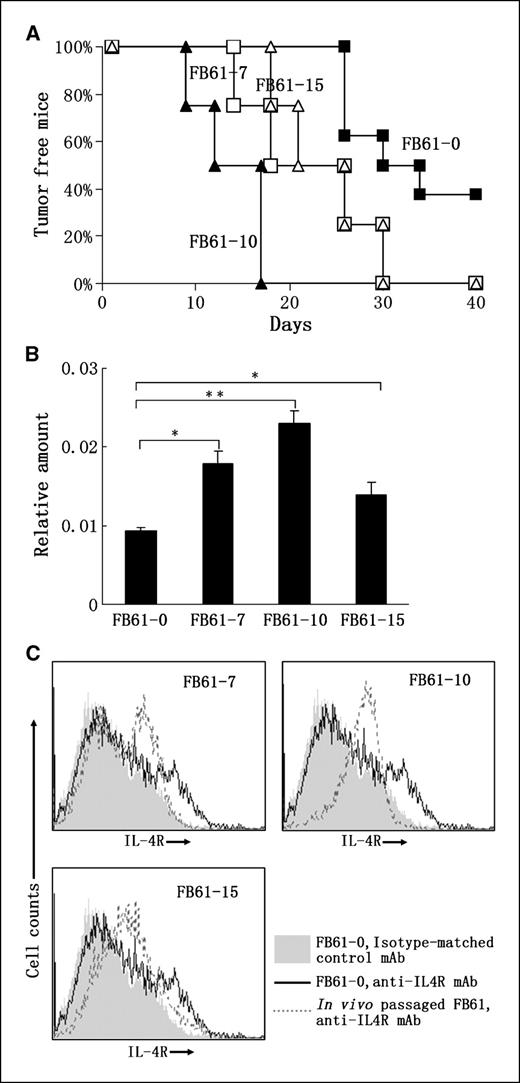
In vivo passage in immunocompetent mice simultaneously improves the tumorigenic potential and IL-4R expression of tumor cells. A, tumorigenic potential after and before in vivo passage. Female BALB/c mice at ages 6 to 8 wk (n = 4 to 8) were s.c. injected with 1 × 10⁶ FB61-0 (parental FB61), FB61-7 (one passage in 7# mouse), FB61-10 (one passage in 10# mouse), or FB61-15 (one passage in 15# mouse). Tumor growth was monitored every 3 to 4 d. Mice bearing tumors with >300 mm3 in volume were recorded as tumor-positive. Percentages of tumor-free mice at different times. Four separate experiments were done with similar results. B, in vivo passage increases IL-4R mRNA level in tumor cells. Total RNA was extracted from parental tumor cell FB61-0 and in vivo passaged tumor cells FB61-7, FB61-10 and FB61-15. Relative amount of IL-4R was determined by real-time PCR. The experiment was done twice with similar results. *, P < 0.05; **, P < 0.01. C, in vivo passage increases IL-4R expression level on tumor cell surface. FB61-0, FB61-7, FB61-10, and FB61-15 were stained with PE-conjugated anti–IL-4R mAb M1 or isotype-matched control mAb and analyzed by flow cytometry. Overlaid images of FB61-0 stained with isotype-matched control mAb (filled) or with anti–IL-4R mAb (black solid line) and one in vivo passaged tumor cell line stained with anti–IL-4R mAb (gray-dotted line). The experiment was done thrice with similar results.
In vivo passage in immunocompetent mice simultaneously improves the tumorigenic potential and IL-4R expression of tumor cells. A, tumorigenic potential after and before in vivo passage. Female BALB/c mice at ages 6 to 8 wk (n = 4 to 8) were s.c. injected with 1 × 10⁶ FB61-0 (parental FB61), FB61-7 (one passage in 7# mouse), FB61-10 (one passage in 10# mouse), or FB61-15 (one passage in 15# mouse). Tumor growth was monitored every 3 to 4 d. Mice bearing tumors with >300 mm3 in volume were recorded as tumor-positive. Percentages of tumor-free mice at different times. Four separate experiments were done with similar results. B, in vivo passage increases IL-4R mRNA level in tumor cells. Total RNA was extracted from parental tumor cell FB61-0 and in vivo passaged tumor cells FB61-7, FB61-10 and FB61-15. Relative amount of IL-4R was determined by real-time PCR. The experiment was done twice with similar results. *, P < 0.05; **, P < 0.01. C, in vivo passage increases IL-4R expression level on tumor cell surface. FB61-0, FB61-7, FB61-10, and FB61-15 were stained with PE-conjugated anti–IL-4R mAb M1 or isotype-matched control mAb and analyzed by flow cytometry. Overlaid images of FB61-0 stained with isotype-matched control mAb (filled) or with anti–IL-4R mAb (black solid line) and one in vivo passaged tumor cell line stained with anti–IL-4R mAb (gray-dotted line). The experiment was done thrice with similar results.
Establishment of IL-4R–deficient and IL-4R–competent tumor cells. To investigate how endogenous IL-4 promotes tumor growth and, especially, whether the direct action on tumor cells is involved in its tumor-promoting effects, we established an IL-4R–deficient tumor cell line by injecting MCA into IL-4R−/− BALB/c mice and then, by introducing IL-4R–expressing or mock plasmid into the above cells, established a pair of tumor cells with or without IL-4R expression, which were named FA10-4R and FA10-m, respectively. FA10-4R and FA10-m cells differ only at their IL-4R expression, and no significant phenotypic and proliferating differences can be observed.
The integration of IL-4R cDNA into cellular chromosome and the successful synthesis of IL-4R mRNA were respectively shown by PCR from FA10-m and FA10-4R genomic DNA or by RT-PCR from FA10-m and FA10-4R mRNA. As shown in Fig. 3A, a 1,564-bp DNA fragment can be amplified from FA10-4R but not FA10-m genomic DNA or mRNA. IL-4R cell surface expression was shown by flow cytometric analysis using PE-conjugated anti–IL-4R mAb or isotype-matched control mAb (Fig. 3B). Incubation with IL-4 led to the phosphorylation of STAT6 at tyrosine 654 in FA10-4R tumor cells, as detected by immunoblotting using anti-STAT6 mAb and anti–phosphorylated STAT6 mAb (Fig. 3C), indicating that the reconstituted IL-4R is functional and can deliver signal into cells.

The functionality of IL-4R is successfully reconstituted in IL-4R–deficient FA10 tumor cells. A, IL-4R gene is stably integrated into the chromosome of FA10-4R tumor cells and can be successfully transcribed. IL-4R gene was amplified by specific primers from FA10-4R or FA10-m genomic DNA or from cDNA synthesized using random primer from total RNA of FA10-m cells, FA10-4R cells, FA10 cells, IL-4R+ splenocytes (sp), or IL-4R+ mouse embryonic fibroblasts (MEF). The PCR products were resolved on 1% agrose gel. IL-4R gene-specific bands with 1,564-bp length are indicated by arrow. B, IL-4R is expressed on the surface of FA10-4R cells. Overlaid histogram of FA10-m stained with isotype-matched control mAb (filled) or PE-conjugated anti–IL-4R mAb (black solid line) and FA10-4R stained with PE-conjugated anti–IL-4R mAb (gray-dotted line). C, IL-4 treatment leads to the phosphorylation of STAT6 in FA10-4R tumor cells. FA10-4R or FA10-m tumor cells cultured for 2 d in the presence or absence of 10 ng/mL IL-4 were lysed by RIPA solution and analyzed by Western blotting using anti-STAT6 mAb or anti–phosphorylated STAT6 (pY641) mAb. All of the above experiments were done at least thrice with similar results.
The functionality of IL-4R is successfully reconstituted in IL-4R–deficient FA10 tumor cells. A, IL-4R gene is stably integrated into the chromosome of FA10-4R tumor cells and can be successfully transcribed. IL-4R gene was amplified by specific primers from FA10-4R or FA10-m genomic DNA or from cDNA synthesized using random primer from total RNA of FA10-m cells, FA10-4R cells, FA10 cells, IL-4R+ splenocytes (sp), or IL-4R+ mouse embryonic fibroblasts (MEF). The PCR products were resolved on 1% agrose gel. IL-4R gene-specific bands with 1,564-bp length are indicated by arrow. B, IL-4R is expressed on the surface of FA10-4R cells. Overlaid histogram of FA10-m stained with isotype-matched control mAb (filled) or PE-conjugated anti–IL-4R mAb (black solid line) and FA10-4R stained with PE-conjugated anti–IL-4R mAb (gray-dotted line). C, IL-4 treatment leads to the phosphorylation of STAT6 in FA10-4R tumor cells. FA10-4R or FA10-m tumor cells cultured for 2 d in the presence or absence of 10 ng/mL IL-4 were lysed by RIPA solution and analyzed by Western blotting using anti-STAT6 mAb or anti–phosphorylated STAT6 (pY641) mAb. All of the above experiments were done at least thrice with similar results.
IL-4R expression on tumor cells leads to accelerated tumor growth. To evaluate how IL-4R expression on tumor cells influences tumor growth, FA10-4R and FA10-m cells were correspondingly inoculated into the left or right flanks of BALB/c mice at the dose of 3 × 10⁵, 1 × 10⁶, or 3 × 10⁶ cells per site. FA10-4R tumors always exhibit accelerated growth compared with FA10-m tumors, regardless of injection dose (Fig. 4A). At day 34 after tumor inoculation, mice were sacrificed, photos of these tumor-bearing mice were taken, and tumor nodules were isolated and weighed (Supplementary Fig. S2). The increased size of FA10-4R over FA10-m tumors can be easily seen from the tumor-bearing mice, the isolated tumor nodules, and the weight of these tumor nodules (Supplementary Fig. S2A–C). These data show that the response of tumor cells to endogenous IL-4 leads to increased tumor growth.
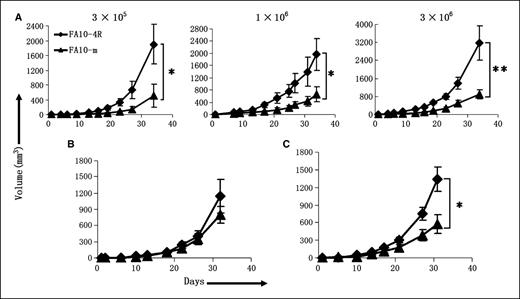
IL-4R expression on tumor cells leads to accelerated tumor growth in vivo. A, FA10-4R tumor grows at higher speed than its IL-4R–deficient counterpart in BALB/c mice. FA10-4R (♦) or FA10-m (▴) tumor cells were correspondingly inoculated into the left or right flanks of BALB/c mice (n = 4 or 6) at 3 × 10⁵, 1 × 10⁶, or 3 × 10⁶ per site. Tumor growth was measured every 3 to 4 d. Points, mean tumor volumes at different times; bars, SD. One of three separate experiments with similar results is presented here. *, P < 0.05; **, P < 0.01. B, IL-4 neutralization abrogates the advantages of FA10-4R over FA10-m tumor. FA10-4R (♦) or FA10-m (▴) tumor cells were correspondingly inoculated into the left or right flanks of BALB/c mice (n = 4 or 6) at the amount of 1 × 10⁶ cells per site. At 2 d before tumor inoculation, the mice received i.p. injection of 0.5 mg 11B11 ascite every 4 d for up to six times. Points, mean tumor volumes at different times; bars, SD. This experiment was done twice with similar results. C, responsiveness to local IL-4 alone by tumor cells is sufficient to accelerate tumor growth. 1 × 10⁶ FA10-4R (♦) or FA10-m (▴) tumor cells were correspondingly inoculated into the left or right flanks of IL-4R knockout BALB/c mice (n = 4 or 6). Tumor growth was recorded. One of two separated experiments with similar results is presented here. *, P < 0.05.
IL-4R expression on tumor cells leads to accelerated tumor growth in vivo. A, FA10-4R tumor grows at higher speed than its IL-4R–deficient counterpart in BALB/c mice. FA10-4R (♦) or FA10-m (▴) tumor cells were correspondingly inoculated into the left or right flanks of BALB/c mice (n = 4 or 6) at 3 × 10⁵, 1 × 10⁶, or 3 × 10⁶ per site. Tumor growth was measured every 3 to 4 d. Points, mean tumor volumes at different times; bars, SD. One of three separate experiments with similar results is presented here. *, P < 0.05; **, P < 0.01. B, IL-4 neutralization abrogates the advantages of FA10-4R over FA10-m tumor. FA10-4R (♦) or FA10-m (▴) tumor cells were correspondingly inoculated into the left or right flanks of BALB/c mice (n = 4 or 6) at the amount of 1 × 10⁶ cells per site. At 2 d before tumor inoculation, the mice received i.p. injection of 0.5 mg 11B11 ascite every 4 d for up to six times. Points, mean tumor volumes at different times; bars, SD. This experiment was done twice with similar results. C, responsiveness to local IL-4 alone by tumor cells is sufficient to accelerate tumor growth. 1 × 10⁶ FA10-4R (♦) or FA10-m (▴) tumor cells were correspondingly inoculated into the left or right flanks of IL-4R knockout BALB/c mice (n = 4 or 6). Tumor growth was recorded. One of two separated experiments with similar results is presented here. *, P < 0.05.
To further confirm that the growth advantage of FA10-4R over FA10-m is really conferred by IL-4, we investigated the growth of these two tumors in the mice whose endogenous IL-4 were depleted by i.p. injected 11B11 mAb. As expected, in IL-4–neutalizing mice, FA10-4R and FA10-m tumors grew at almost the same pace (Fig. 4B), indicating that IL-4 leads to increased growth of FA10-4R fibrosarcoma.
Only tumor cell responsiveness to IL-4 is sufficient to cause increased tumor growth. IL-4 has been shown to exert various detrimental effects on immune cells, such as skewing CD4+ T cells to Th2 direction (30), reducing or abrogating the cytotoxicity of CD8+ T cells (31, 32). In wild-type BALB/c mice, besides IL-4R competent tumor cells, various immune cells can also respond to IL-4. To find out whether only tumor cell responsiveness to IL-4 can lead to increased tumor growth, FA10-4R and FA10-m cells were inoculated into IL-4R knockout mice. The growth speed of IL-4R–competent tumors again exceeded IL-4R–deficient tumor (Fig. 4C). At day 31 after tumor inoculation, FA10-4R tumor reached average volume of 1,336.6 ± 211.8 mm3, far exceeding the volume of FA10-m (576.6 ± 162.3 mm3). These data suggest only tumor cell responsiveness to IL-4 is sufficient to cause increased tumor growth.
The accelerated tumor growth does not result from increased tumor cell proliferation or altered expression of immune-related molecules in the presence of IL-4. To find out the reasons involved in promoting tumor growth, we examined the effects of IL-4 on tumor cell proliferation in vitro. FA10-4R and FA10-m tumor cells were labeled with CFSE and cultured for 4 d in the presence or absence of 10 ng/mL IL-4. CFSE intensity declined as tumor cells grew (Fig. 5A). However, no differences were observed between the proliferation of IL-4R–competent and IL-4R–deficient tumor cells (Fig. 5A). Similar results were also obtained using MTT assay and [3H]thymidine incorporation assay (Fig. 5B and C).
![Figure 5. The effects of IL-4 on tumor cells in vitro. A, CFSE assay. FA10-4R and FA10-m tumor cells were labeled by CFSE, cultured for 4 d in the presence (blue) or absence (pink) of 10 ng/mL IL-4, and analyzed on a BD FACSCalibur cytometer. MCA205–IL-4, a constitutively IL-4–producing tumor cell line by IL-4 gene transfer, and MCA205, the parental cell line of MCA205–IL-4, were also included. CFSE-labeled but uncultured cells (green) and unlabeled cells (red) were used as controls. B, MTT assay. FA10-4R (black) and FA10-m (gray) tumor cells were inoculated into 96-well plates at 3 × 10³ per well. Cell proliferation was determined by MTT assay on day 3 after inoculation. Absorbance values detected at 490 nm. C, [3H]thymidine incorporation. FA10-4R and FA10-m tumor cells were cultured in the presence of 2 μCi/mL [3H]thymidine with or without the addition of 10 ng/mL IL-4. [3H]thymidine incorporation was determined 24 h (black) and 36 h (gray) later. D, IL-4 treatment does not change the expression of H-2Kd, Fas, or B7-H3 on tumor cells. FA10-4R and FA10-m tumor cells cultured in the presence (pink) or absence (green) of 10 ng/mL IL-4 were harvested, stained with PE–anti–H-2Kd mAb, PE–anti-Fas mAb, or PE–anti–B7-H3 mAb, and analyzed by flow cytometry. Isotype-matched control mAb (blue) was used as control. Shown are the overlaid histograms. All of the above experiments were done at least thrice.](https://aacr.silverchair-cdn.com/aacr/content_public/journal/cancerres/68/21/10.1158_0008-5472.can-08-0449/4/m_8687fig05c.jpeg?Expires=1716357829&Signature=4E8jXMDJMknN4lekrf4pKHtemMnEre5EQB5yRq0q~zMyzfbEizS-hIjBu3B2qYElYKyTlUymwqzm4UP1nwcJ8Ou7u4EKN14wfP-6h~vq8BKuiwZ6MmDtchsc5sqCKg6zRS~X74WNNGlgE0YijUTw78hFI~zfMRlSiUNEurtC7zQUQm09UKXS1LB0hpxSsvC1xnzqzMS2Zh-ARhtPeu1N7HkGeGnFBEVtC8oyWNiSLxNKm82DOY4OJeasozRxKYdN98u0oUhcQtTd5EwhzR~ztBSnVjoVN0uTVVIDS2iKyzBlwYuvr9fJCVoixjIwN7aq0NaA6y7G~YbJ5hUPIWXx~A__&Key-Pair-Id=APKAIE5G5CRDK6RD3PGA)
The effects of IL-4 on tumor cells in vitro. A, CFSE assay. FA10-4R and FA10-m tumor cells were labeled by CFSE, cultured for 4 d in the presence (blue) or absence (pink) of 10 ng/mL IL-4, and analyzed on a BD FACSCalibur cytometer. MCA205–IL-4, a constitutively IL-4–producing tumor cell line by IL-4 gene transfer, and MCA205, the parental cell line of MCA205–IL-4, were also included. CFSE-labeled but uncultured cells (green) and unlabeled cells (red) were used as controls. B, MTT assay. FA10-4R (black) and FA10-m (gray) tumor cells were inoculated into 96-well plates at 3 × 10³ per well. Cell proliferation was determined by MTT assay on day 3 after inoculation. Absorbance values detected at 490 nm. C, [3H]thymidine incorporation. FA10-4R and FA10-m tumor cells were cultured in the presence of 2 μCi/mL [3H]thymidine with or without the addition of 10 ng/mL IL-4. [3H]thymidine incorporation was determined 24 h (black) and 36 h (gray) later. D, IL-4 treatment does not change the expression of H-2Kd, Fas, or B7-H3 on tumor cells. FA10-4R and FA10-m tumor cells cultured in the presence (pink) or absence (green) of 10 ng/mL IL-4 were harvested, stained with PE–anti–H-2Kd mAb, PE–anti-Fas mAb, or PE–anti–B7-H3 mAb, and analyzed by flow cytometry. Isotype-matched control mAb (blue) was used as control. Shown are the overlaid histograms. All of the above experiments were done at least thrice.
The effects of IL-4 on tumor cells in vitro. A, CFSE assay. FA10-4R and FA10-m tumor cells were labeled by CFSE, cultured for 4 d in the presence (blue) or absence (pink) of 10 ng/mL IL-4, and analyzed on a BD FACSCalibur cytometer. MCA205–IL-4, a constitutively IL-4–producing tumor cell line by IL-4 gene transfer, and MCA205, the parental cell line of MCA205–IL-4, were also included. CFSE-labeled but uncultured cells (green) and unlabeled cells (red) were used as controls. B, MTT assay. FA10-4R (black) and FA10-m (gray) tumor cells were inoculated into 96-well plates at 3 × 10³ per well. Cell proliferation was determined by MTT assay on day 3 after inoculation. Absorbance values detected at 490 nm. C, [3H]thymidine incorporation. FA10-4R and FA10-m tumor cells were cultured in the presence of 2 μCi/mL [3H]thymidine with or without the addition of 10 ng/mL IL-4. [3H]thymidine incorporation was determined 24 h (black) and 36 h (gray) later. D, IL-4 treatment does not change the expression of H-2Kd, Fas, or B7-H3 on tumor cells. FA10-4R and FA10-m tumor cells cultured in the presence (pink) or absence (green) of 10 ng/mL IL-4 were harvested, stained with PE–anti–H-2Kd mAb, PE–anti-Fas mAb, or PE–anti–B7-H3 mAb, and analyzed by flow cytometry. Isotype-matched control mAb (blue) was used as control. Shown are the overlaid histograms. All of the above experiments were done at least thrice.
Given no effect on tumor cell proliferation, we suspected that IL-4 regulates the expression of such immune-related molecules as MHC class I, which influences the recognition of tumor cells by natural killer and T (NKT) cells (33, 34), Fas, which determines the susceptibility of tumor cells to FasL-mediated apoptosis (35), or B7-H3, which provides costimulatory signal for T-cell activation (36). FA10-4R and FA10-m were cultured in the presence or absence of 10 ng/mL IL-4. Cell surface expression of H-2Kd, Fas, and B7-H3 were analyzed by flow cytometry using specific PE-conjugated mAb. Significant amounts of H-2Kd and Fas were detected on both FA10-4R and FA10-m cells, but their expression was not affected by IL-4 treatment (Fig. 5D). B7-H3 does not appear on the cells, either in the presence or absence of IL-4 (Fig. 5D). However, IL-4 treatment, indeed, up-regulated the expression of IL-4R and H-2Kb on splenocytes and slightly increased VCAM-1 expression on FA10-4R cells, which indicated that IL-4 used in this experiment was biologically functional and that the concentration and incubating time were also appropriate (Supplementary Fig. S3A and B). Taken together, it seems that regulating the expression of immune-related molecules is not possible by using IL-4 to promote tumor cell growth.
Endogenous IL-4 protects IL-4R–competent tumor cells from apoptosis. Next, we examined whether IL-4 protects tumor cells from apoptosis. Two antiapoptotic genes, Bcl-xL and cFLIP, were detected since their expression was reported to be regulated by IL-4 (19, 21). FA10-4R and FA10-m cells were cultured for 36 h in the presence or absence of 10 ng/mL IL-4. mRNA was extracted, and the relative amount of Bcl-xL and cFLIP genes was determined by real-time PCR. Similar amount of both Bcl-xL and cFLIP was expressed in IL-4–treated and untreated FA10-m cells (Fig. 6A). However, significantly augmented amount of these two genes was detected in IL-4–treated versus IL-4–untreated FA10-4R cells, with 1.8-fold and 2.5-fold increase for Bcl-xL and cFLIP, respectively (Fig. 6A). Similar results were obtained using Western blotting (Fig. 6B). These data indicate that IL-4–mediated resistance to apoptosis might be involved in its promoting effect on tumor growth.
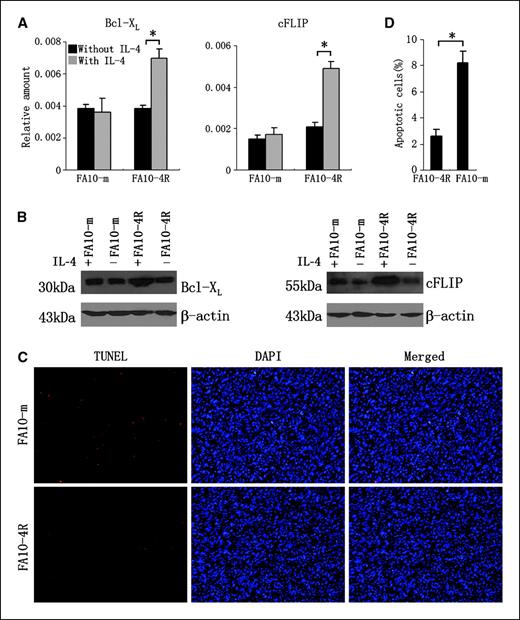
IL-4 protects tumor cells from apoptosis. A, IL-4 treatment augments the mRNA level of antiapoptosis genes. FA10-4R and FA10-m cDNA was synthesized by random primers from total RNA of tumor cells cultured for 36 h in the presence or absence of 10 ng/mL IL-4. The amount of Bcl-xL or cFLIP was determined by real-time PCR. Ratios between the amount of relevant genes and the amount of internal control β-actin. *, P < 0.05. B, IL-4 treatment increases the amount of antiapoptosis protein. FA10-4R and FA10-m cells cultured for 48 h in the presence or absence of IL-4 were lysed and applied to immunoblotting using anti-Bcl-xL or anti-cFLIP antibody. β-Actin was used as control. C, detecting apoptosis by TUNEL assay. FA10-4R and FA10-m tumors, growing at the left and right flanks of BALB/c mice, were isolated 30 d after tumor inoculation and embedded in paraffin. Apoptosis was detected by TUNEL (red). Cell nuclei were counterstained by DAPI (blue). Photos were taken with 200× magnification under a fluorescent microscope. D, percentage of apoptotic cells in tumor sections. The number of apoptotic cells (TUNEL positive) and total cells (DAPI positive) in a 200× microscopic field was counted. Percentages of apoptotic cells were calculated by dividing the number of apoptotic cells in one field with the number of the total cells in the same field. Columns, percentages of apoptotic cells calculated from eight FA10-4R and FA10-m fields; bars, SD. *, P < 0.05.
IL-4 protects tumor cells from apoptosis. A, IL-4 treatment augments the mRNA level of antiapoptosis genes. FA10-4R and FA10-m cDNA was synthesized by random primers from total RNA of tumor cells cultured for 36 h in the presence or absence of 10 ng/mL IL-4. The amount of Bcl-xL or cFLIP was determined by real-time PCR. Ratios between the amount of relevant genes and the amount of internal control β-actin. *, P < 0.05. B, IL-4 treatment increases the amount of antiapoptosis protein. FA10-4R and FA10-m cells cultured for 48 h in the presence or absence of IL-4 were lysed and applied to immunoblotting using anti-Bcl-xL or anti-cFLIP antibody. β-Actin was used as control. C, detecting apoptosis by TUNEL assay. FA10-4R and FA10-m tumors, growing at the left and right flanks of BALB/c mice, were isolated 30 d after tumor inoculation and embedded in paraffin. Apoptosis was detected by TUNEL (red). Cell nuclei were counterstained by DAPI (blue). Photos were taken with 200× magnification under a fluorescent microscope. D, percentage of apoptotic cells in tumor sections. The number of apoptotic cells (TUNEL positive) and total cells (DAPI positive) in a 200× microscopic field was counted. Percentages of apoptotic cells were calculated by dividing the number of apoptotic cells in one field with the number of the total cells in the same field. Columns, percentages of apoptotic cells calculated from eight FA10-4R and FA10-m fields; bars, SD. *, P < 0.05.
To further confirm this result, we investigated in situ apoptosis of fibrosarcomas growing in syngeneic mice by TUNEL assay. As shown in Fig. 6C, markedly increased apoptosis were detected in FA10-m compared with FA10-4R tumor sections. The percentages of cells undergoing apoptosis in FA10-4R and FA10-m tumors were 2.64% and 8.24%, respectively (Fig. 6D). These results indicate endogenous IL-4 has the ability to protect tumor cells from apoptosis in vivo.
Discussion
In the present study, we systemically investigated the relationship between endogenous IL-4 and tumor progression. Noticeably, endogenous IL-4 must be carefully distinguished from exogenous IL-4. Endogenous IL-4 is primarily produced by various host immune cells, including T cells, mast cells, basophils, and sometimes NKT cells, γδ T cells (37). The producing time and dose of endogenous IL-4 are stringently controlled by different regulatory signals. Exogenous IL-4 is forcedly produced by some types of cells, commonly gene-modified tumor cells, by gene transferring of IL-4–expressing vector and is often persistently and copiously produced. Exogenous IL-4 produced by gene-modified tumor cells elicits strong antitumor immune response, which has been shown in various types of tumors by different groups, including ours (38–40). In contrast, the role of endogenous IL-4 during tumor progression is less investigated.
Herein, we showed that endogenous IL-4 has the ability to promote tumor growth in vivo, as evidenced by i.p. administration of IL-4–neutralizing mAb, which significantly delayed the growth of MCA205 fibrosarcoma (Fig. 1). In addition, we also found that endogenous IL-4 promotes chemical carcinogen-induced tumorigenesis, resulting in increased tumor incidences and shortened latency period in IL-4–competent versus IL-4–deficient mice (data to be published). These findings clearly suggest that endogenous IL-4 exerts promoting effects on tumor development.
The finding that endogenous IL-4 promotes tumor growth seems to be easily understood, because IL-4 exerts different detrimental effects on immune cells (30–32), such as inhibiting the differentiation of Th1 cells and cellular immunity, decreasing or even abrogating the cytotoxicity of CD8+ T cells, leading to the accumulation of Th2 type cytokines, and finally causing tumor immunity into an ineffective state. However, the fact that tumor cells often express high amounts of IL-4R gives a hint that IL-4 may directly act on tumor cells during tumor development. This hint becomes more apparent by our observation that in vivo passage in immunocompetent mice selects tumor cells with higher IL-4R expression (Fig. 2A–C).
Nonetheless, clearly discriminating the effects of IL-4 on tumor cells from its effects on immune cells seems to be a little difficult because IL-4 is diffusible and simultaneously acts on various cells in its reachable range. Herein, we resolved this problem by establishing a pair of comparable tumor cells with or without IL-4–responsive ability, thereby demonstrating that endogenous IL-4 can directly act on tumor cells and promote its growth (Fig. 4). However, the effects of endogenous IL-4 on host immune cells cannot be excluded. Actually, the effects of IL-4 on tumor cells and immune cells may operate synergistically to facilitate tumor growth.
The up-regulation of antiapoptotic genes, including Bcl-xL and cFLIP, by IL-4 has been observed by other groups (19, 21). They found that several cancer cells became less sensitive to chemical reagent–induced or FasL-induced apoptosis when culturing in the presence of IL-4. However, until now, only in vitro experiments have been done to investigate the effects of IL-4 on tumor cells. Here, our study provides the clear evidence that endogenous IL-4 is able to promote tumor growth in vivo and only responsiveness to IL-4 of tumor cells is sufficient to accelerate tumor growth.
Dominant-negative approach is often used to investigate the direct effects of cytokines, such as IFN-γ, on tumor cells by overexpressing in tumor cells a truncated form of cytokine receptor without signal transducing ability (41, 42). However, in such case, the native cytokine receptor still exists in tumor cells; it is difficult to determine whether or not the native cytokine receptor works in vivo after transplanting tumor cells into mice. The methods used here, establishing a pair of tumor cells with or without cytokine receptor expression, is obviously more advisable, because it completely excludes the effects of cytokines on receptor-deficient mock tumor cells.
Collectively, this study revealed the complicated interaction between host immune system and tumor cells. Although immune system can detect tumor-associated antigens and mobilize different weapons to attack and eliminate arising neoplasm, in other cases, tumor cells can also use immune cells, such as CD11b+Gr1+ myeloid-derived suppressor cells (43), or immune molecules, such as IL-4, to facilitate their growth. So, intervening or reverting an ineffective immune response would be valuable for tumor therapy.
Disclosure of Potential Conflicts of Interest
No potential conflicts of interest were disclosed.
Note: Supplementary data for this article are available at Cancer Research Online (http://cancerres.aacrjournals.org/).
Z. Li and J. Jiang contributed equally to this work.
Acknowledgments
Grant support: Chinese Academy of Sciences (Z. Qin), National Natural Science Foundation of China grants 30771972 and 30700287, and Ministry of Science and Technology of China grants 863-2006AA02Z4B9, 973-2006CB504304, and 2006CB910901.
The costs of publication of this article were defrayed in part by the payment of page charges. This article must therefore be hereby marked advertisement in accordance with 18 U.S.C. Section 1734 solely to indicate this fact.
We thank Dr. André Gessner for the generous donation of mouse IL-4R expressing plasmid and Professor Thomas Blankenstein and Zene Matsuda for their critical comments and very kind support.