


Abstract
The majority of high-risk neuroblastoma patients are refractory to, or relapse on, current treatment regimens, resulting in 5-year survival rates of less than 50%. This emphasizes the urgent need to identify novel therapeutic targets. Here, we report that high PIM kinase expression is correlated with poor overall survival. Treatment of neuroblastoma cell lines with the pan-PIM inhibitors AZD1208 or PIM-447 suppressed proliferation through inhibition of mTOR signaling. In a panel of neuroblastoma cell lines, we observed a marked binary response to PIM inhibition, suggesting that specific genetic lesions control responses to PIM inhibition. Using a genome-wide CRISPR-Cas9 genetic screen, we identified NF1 loss as the major resistance mechanism to PIM kinase inhibitors. Treatment with AZD1208 impaired the growth of NF1 wild-type xenografts, while NF1 knockout cells were insensitive. Thus, our data indicate that PIM inhibition may be a novel targeted therapy in NF1 wild-type neuroblastoma. Mol Cancer Ther; 17(4); 849–57. ©2018 AACR.
Introduction
Neuroblastoma is a pediatric malignancy originating from precursor cells of the sympathetic nervous system (1). It accounts for 8% to 10% of all childhood cancers and is the most common type of cancer diagnosed in infants (2). Tumor behavior is highly heterogeneous, varying from spontaneous regression to aggressive metastatic disease. Patients with high-risk tumors have a poor prognosis due to refractory or relapsed disease, with 5-year survival rates of less than 50% (3). Treatment options are mainly limited to surgery, radiation, chemotherapy, and stem cell transplantation (3). Unfortunately, compared with more common malignancies, relatively few targeted agents are being evaluated for the treatment of neuroblastoma. The only FDA-approved targeted therapy is a mAb (dinutuximab) targeting the cell surface glycolipid GD2, which is administered in combination with granulocyte macrophage colony-stimulating factor (GM-CSF), IL2, and 13-cis retinoic acid (isotretinoin; ref. 4). It is therefore essential to identify novel targeted therapies for the treatment of neuroblastoma.
PIM serine/threonine kinases (PIM1, -2, and -3) are overexpressed in many hematologic malignancies and several solid cancers (5). Because of a short half-life, the activity of these constitutively active kinases is mainly regulated at a transcriptional level by the JAK/STAT pathway (6–9). Many PIM kinase substrates are commonly regulated by AKT/mTOR signaling, including PRAS40 (10), TSC2 (11), 4EBP1 (12), the proapoptotic protein BAD (13–15), and the cell-cycle–regulating proteins p21CIP1 (16) and p27KIP1 (17). PIM kinases are highly homologous and share a unique hinge region that results in a distinct ATP-binding site (9, 18), which has led to the development of highly specific pan-PIM kinase inhibitors, such as AZD1208 (19) and PIM-447 (20). Furthermore, Pim1-, Pim2-, and Pim3-deficient mice are viable and only display mild phenotypic changes, such as reduced body size, which might indicate a favorable toxicity profile for PIM kinase inhibitors in human patients (21).
Although PIM kinases are, thus far, mostly studied in hematologic malignancies, an increasing number of reports demonstrate a role for these kinases in solid cancers. For instance, PIM1 was recently found to be overexpressed in triple-negative breast cancer, in which high mRNA expression correlated with poor clinical outcome (22, 23). In addition, MYC-positive triple-negative cell lines and patient-derived xenografts were found to be sensitive to PIM inhibitors. Here, we explore PIM kinase inhibition as a potential strategy for the treatment of neuroblastoma.
Materials and Methods
Patient cohort
Data from two independent neuroblastoma microarray datasets were derived from the online tool R2 (http://r2.amc.nl). The Versteeg dataset consisted of 88 samples and has previously been described. The Kocak dataset consisted of 643 samples, of which for 476 samples, follow-up data were available and were therefore used for the analysis. Patient characteristics are described in Supplementary Table S1. Patient studies were conducted in compliance with the Helsinki declaration.
Cell culture, transfection, and lentiviral transduction
HEK293, HT230, SK-N-SH, NB90-4, NB90-6, NB90-9, NB69, SK-N-AS, and SK-N-BE cell lines were cultured in DMEM. LAN5, CLB-MA, GI-ME-N, and KELLY cell lines were cultured in RPMI1640. IMR32 was cultured in Minimum Essential Medium. SH-SY5Y was cultured in DMEM/F12 medium. Medium was supplemented with 8% FCS, 1% glutamine, and 1% penicillin/streptomycin, and cells were grown at 37°C and 5% CO2. Cell lines were available within the Netherlands Cancer Institute (Amsterdam, the Netherlands), were STR profiled when reference STR data were available for the particular cell line, and all cell lines were routinely tested by PCR for mycoplasma contamination and were found negative.
PEI transfection of HEK293 cells was used to produce lentiviral supernatant. Target cells were seeded 1 day before infection. Lentivirus was added to the medium in the presence of 5 μg/mL polybrene. Cells were selected for successful lentiviral integration using 2 μg/mL puromycin. For individual knockout of genes, the following gRNAs were cloned into the lentiCRISPR version 2.1 (LC2.1) vector by Gibson cloning:
gNT 5′-ACGGAGGCTAAGCGTCGCAA -3′
gNF1 #1 5′-TCTTTAGTCGCATTTCTACC-3′
gNF1 #2 5′-ACACTGGAAAAATGTCTTGC-3′
gTSC1 5′-ATGAAAGAGTGCGTACACAC-3′
gDEPDC5 #1 5′-TGTTAATGTCGTAGACCCTA-3′
gDEPDC5 #2 5′- GGAACACTTGAGTCACAGTC-3′
gPTEN 5′-ACCGCCAAATTTAATTGCAG-3′
gSTK11 5′- GAAGGGGAGCTACGCCATCC-3′
CRISPR-Cas9 resistance screen
The genome-wide GECKO version 2 library A, consisting of 65,383 gRNAs in lentiviral vectors, was used to infect KELLY cells with 200-fold coverage. After 48 hours, viral supernatant was replaced by medium containing puromycin to select for infected cells. Forty-eight hours after puromycin selection, cells were harvested, a T0 sample was taken, and the rest of the cells were reseeded and cultured in the absence or presence of drug in two biological replicates for 30 days, followed by genomic DNA isolation using the DNeasy Blood & Tissue Kit (Qiagen). gRNA sequences were amplified using Phusion High Fidelity DNA polymerase (Thermo Fisher Scientific) by performing a two-step PCR amplification: (i) 98°C, 2 minutes; (ii) 98°C, 30 seconds; (iii) 60°C, 30 seconds; (4) 72°C, 1 minutes; (v) to step 2, 20 cycles (PCR1) or 15 cycles (PCR2); (vi) 72°C, 5 minutes; (vii) 4°C. Two microliters of the pooled PCR1 product was used for the subsequent PCR2 reaction. The abundance of each gRNA in the treated versus untreated pools was determined by Illumina next-generation sequencing. Statistical analysis was performed using DESeq version 1.8.3. We considered gRNAs with a log2 fold change ≥5 and a Padj ≤ 0.1 as hits (adjusted for multiple testing using the Benjamini–Hochberg procedure). Because several of the hits were gRNAs targeting negative regulators of AKT/mTOR signaling, we used these gRNAs for subsequent validation experiments. The data of the CRISPR screen can be found in Supplementary Table S2.
Protein lysate preparation and Western blot analysis
Cells were lysed using RIPA buffer containing 150 mmol/L NaCl, 50 mmol/L Tris pH 8.0, 1% NP-40, 0.5% sodium deoxycholate, and 0.1% SDS supplemented with protease inhibitors (Complete, Roche) and phosphatase inhibitor cocktails II and III (Sigma). Samples were equalized by measuring relative protein concentrations using Pierce BCA Protein Assay Kit (Thermo Fisher Scientific). Bolt LDS Sample Buffer (Thermo Fisher Scientific) and 10× Bolt Sample Reducing Agent (Thermo Fisher Scientific) were added, lysates were boiled for 10 minutes, and equal amounts of sample were subjected to SDS gel electrophoresis, followed by Western blotting. Primary antibodies against HSP90 (sc-7947), GAPDH (sc-20357), p-ERK1/2 (sc-7383), ERK1 (sc-93), ERK2 (sc-154), STAT5 (sc-835), and MYC (sc-40) were purchased from Santa Cruz Biotechnology. Antibody against NF1 (A300-140A) was purchased from Bethyl Laboratories. Antibodies against clPARP (#5625), PIM1 (#3247), PIM2 (#4730), PIM3 (#4165), pSTAT3 (#9145), STAT3 (#4904), pSTAT5 (#4322), N-MYC (#9405), p-AKT (#4060), AKT (#2920), p-S6 (#2215), S6 (#2217), p-4EBP1 (#9456), 4EBP1 (#9452), STK11 (#3050), PTEN (#9559), and TSC1 (#4906) were from Cell Signaling Technology. Secondary antibodies were obtained from Bio-Rad Laboratories. AZD1208 and MK2206 were purchased from Selleckchem. Cobimetinib was purchased from ApexBio. PIM-447 was purchased from MedChem Express.
CellTiter-Blue viability assay
Respectively, 625 (GI-ME-N), 800 (HT230), 2,000 (IMR32), 3,000 (NB69), 5,000 (NB90-6, SK-N-SH, SH-SY5Y, SK-N-BE, SK-N-AS, KELLY, NB90-4), 10,000 (NB90-9), and 15,000 (LAN5, CLB-MA) cells per well were seeded in a 96-well plate. After 24 hours, drugs were added to the medium in 2-fold serial dilutions using a HP Direct Digital Dispenser. After 5 days of culture CellTiter-Blue (Promega) was added. The conversion of resazurin into resorufin was measured by using an EnVision Multilabel Reader. Treatment with 10 μmol/L phenyl arsenic oxide, resulting in complete cell death, was used as a baseline for viability. Nonlinear regression analysis in GraphPad Prism v6.0 was used for curve fitting.
RNAi and quantitative RT-PCR
KELLY cells (10,000 cells/well) and SH-SY5Y (4,000 cells/well) were seeded in triplicates in in a 96-well plate. After 24 hours, cells were transfected with Dharmacon siGENOME SMARTPool siRNAs against PIM1 (M-003923-00), PIM2 (M-005359-00), PIM3 (M-032287-02), or nontargeting siRNA Pool #1 (D-001206-13) using DharmaFECT1 (#T-2001; KELLY), or Lipofectamine RNAiMax (#13778075). Phenyl arsenic oxide (10 μmol/L), resulting in complete cell death, was used as a baseline for viability. After 5 days of culture, viability was measured using CellTiter-Blue (Promega) as described above.
To determine the level of knockdown, 5 × 10⁵ KELLY cells per well and 1 × 10⁶ SH-SY5Y cells per well were seeded in a 6-well plate. After 24 hours, cells were transfected as indicated previously. After 48 hours, RNA was isolated using a ISOLATE II RNA Mini Kit (Bioline, # BIO-52073). Subsequent cDNA synthesis was performed using Maxima Universal First Strand cDNA Synthesis Kit (Thermo Fisher Scientific, # K1661).
The 7500 Fast Real-Time PCR System from Applied Biosystems was used to measure mRNA levels. mRNA expression levels were normalized to expression of RPL-13. The following primer sequences were used in the SYBR Green Master Mix:
RPL-13_forward 5′-GAGACAGTTCTGCTGAAGAACTGAA-3′;
RPL-13_reverse 5′-TCCGGACGGGCATGAC-3′;
PIM1_forward 5′-CGACATCAAGGACGAAAACATC-3′;
PIM1_reverse 5′- ACTCTGGAGGGCTATACACTC-3′;
PIM2_forward 5′-TCGAGGCCGAGTATCGACT-3′;
PIM2_reverse 5′-ATTCCGGGGAATCACTTTG-3′;
PIM3_forward 5′-CTGCTCAAGGACACGGTCTACAC-3′;
PIM3_reverse 5′-CCCCACACACCATATCGTAGAGA-3′;
Colony formation assay
Respectively, 20,000 (NB90-4, NB90-6, NB90-9, GI-ME-N, HT230), 40,000 (NB69, SK-N-BE, SK-N-AS, SK-N-SH, KELLY), and 100,000 (IMR32, CLB-MA, LAN5, SH-SY5Y) cells per well were seeded in 6-well plates and cultured both in the absence and presence of drugs as indicated. When untreated cells reached confluency, cells were washed with PBS, fixed with 4% formaldehyde, and stained with 0.1% crystal violet. For SH-SY5Y and SK-N-SH, nontargeting cells were stained at a later time point (when untreated well reached confluence) than NF1 KO cells, as the latter grew significantly faster.
Mouse xenografts
Eight-week-old male/female NMRI nude mice were housed in a specific pathogen-free facility in individually ventilated cages at the Animal Core Facilities of the Netherlands Cancer Institute. All mouse experiments were performed in compliance with protocols approved by the local Animal Ethics Committee, which conform to institutional and national regulatory standards on experimental animal usage. KELLY cells in PBS/Matrigel mixture were subcutaneously implanted into the flanks of mice (1 × 10⁶ cells were used in the 90 mg/kg experiment and 5 × 10⁶ cells were used in the 30 mg/kg experiment). When tumor size reached approximately 80 mm3 (90 mg/kg experiment) or approximately 200 mm3 (30 mg/kg experiment), mice were randomly assigned and treated once daily with 30 or 90 mg/kg AZD1208 by oral gavage. Control group received vehicle (0.5% hydroxypropyl methylcellulose and 0.1% Tween 80). All groups were composed of 8 mice, although not all mice formed tumors. In the 90 mg/kg AZD1208 experiment, the groups consisted, therefore, of 7 (gNT vehicle), 6 (gNT AZD1208), 7 (gNF1 #1 vehicle), 7 (gNF1 #1 AZD1208), 7 (gNF1 #2 vehicle), and 7 (gNF1 #2 AZD1208) mice, respectively. Grubbs' analysis was used to exclude outliers. Tumor volume was measured three times per week with calipers and calculated as tumor volume = (length × width2) × 0.5.
Statistical analysis
Kaplan–Meier survival curves were compared using a log-rank test in GraphPad Prism v6.0. HRs were calculated using both a univariate and multivariate Cox regression analysis in IBM SPSS Statistics version 21. Statistical analysis of PIM expression in MYCN-amplified versus MYCN-nonamplified tumors was performed using two-tailed equal variance Student t tests in GraphPad Prism v6.0. PIM expression levels of each tumor stage were compared with stage IV tumors using a one-way ANOVA test with Dunnett correction for multiple comparisons in GraphPad Prism v6.0. Differences in viability upon PIM knockdown were analyzed using a one-way ANOVA test with Dunnett correction for multiple comparisons in GraphPad Prism v6.0. The mean ± SEM is shown in figures. A P value of less than 0.05 was considered statistically significant and is denoted by *. P ≤ 0.01 is denoted by **, P ≤ 0.001 by ***, and P ≤ 0.0001 by ****.
Results
High PIM expression is associated with poor clinical outcome
To determine whether PIM expression is associated with survival in neuroblastoma patients, we analyzed microarray data from a large cohort (n = 476) of neuroblastoma patients (24). We classified patients using median PIM expression as a cut-off value (Fig. 1A–C). Interestingly, high expression of either PIM1, -2, or -3 was significantly correlated with poor overall survival in this cohort. Because PIM kinases are highly redundant, we hypothesized that patients with low expression of all PIM genes would have a better overall survival than patients with high expression of at least one of the PIMs. This classifier further improved the separation between patients with good and poor overall survival (Fig. 1D). To determine whether high PIM expression is a prognostic biomarker, we calculated HRs using a Cox regression analysis (Table 1). Importantly, high expression of at least one of the three PIM kinases versus low expression of all PIMs was significantly associated with poor overall survival in a multivariate model and is therefore a potential prognostic biomarker.
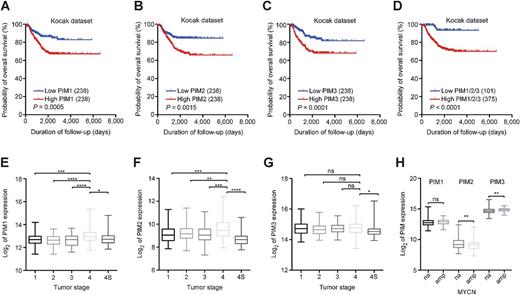
PIM expression is a prognostic biomarker in neuroblastoma. A–D, High PIM mRNA expression correlates with poor overall survival in neuroblastoma. Kaplan–Meier survival curves of the Kocak cohort (476 patients) demonstrate overall patient survival, using median PIM expression as a cut-off value for high versus low expression. High PIM1/2/3 indicates patients with high expression of either PIM1, -2, or -3. P values were calculated using a log-rank test. E–G, PIM1 and -2 expression is highest in stage IV neuroblastoma patients (Kocak cohort). P values were calculated using a one-way ANOVA and Dunnett test. P ≤ 0.05 (*), P ≤ 0.01 (**), P ≤ 0.001 (***), and P ≤ 0.0001 (****). H, PIM expression in MYCN-amplified and nonamplified tumors (Kocak cohort). P values were calculated using an unpaired t test. P ≤ 0.01 (**).
PIM expression is a prognostic biomarker in neuroblastoma. A–D, High PIM mRNA expression correlates with poor overall survival in neuroblastoma. Kaplan–Meier survival curves of the Kocak cohort (476 patients) demonstrate overall patient survival, using median PIM expression as a cut-off value for high versus low expression. High PIM1/2/3 indicates patients with high expression of either PIM1, -2, or -3. P values were calculated using a log-rank test. E–G, PIM1 and -2 expression is highest in stage IV neuroblastoma patients (Kocak cohort). P values were calculated using a one-way ANOVA and Dunnett test. P ≤ 0.05 (*), P ≤ 0.01 (**), P ≤ 0.001 (***), and P ≤ 0.0001 (****). H, PIM expression in MYCN-amplified and nonamplified tumors (Kocak cohort). P values were calculated using an unpaired t test. P ≤ 0.01 (**).
Cox regression survival analysis of the Kocak cohort
| Univariate analysis | Multivariate analysis | |||
|---|---|---|---|---|
| Covariate | HR (95% CI) | P | HR (95% CI) | P |
| MYCN gene amplification | 9.23 (6.05–14.07) | 5.4e−25 | 4.06 (2.48–6.65) | 2.5e−8 |
| Stage III/IV | 9.59 (5.11–18.02) | 2.1e−12 | 3.40 (1.71–6.77) | 0.001 |
| Age > 18 months | 9.79 (5.77–16.61) | 2.7e−17 | 3.63 (1.99–6.65) | 2.8e−5 |
| High PIM1 expression | 2.14 (1.38–3.31) | 0.001 | 1.06 (0.65–1.72) | 0.827 |
| High PIM2 expression | 2.00 (1.29–3.08) | 0.002 | 1.06 (0.65–1.73) | 0.812 |
| High PIM3 expression | 2.31 (1.49–3.59) | 2.0e−4 | 0.89 (0.53–1.50) | 0.666 |
| High PIM1, -2, or -3 expression | 5.29 (2.15–13.03) | 2.9e−4 | 3.05 (1.03–8.97) | 0.043 |
Abbreviation: CI, confidence interval.
We also determined the level of PIM expression across all tumor stages (Fig. 1E–G). PIM1 and -2 expression was significantly higher in stage IV tumors compared with the other stages. Stage IV disease indicates the occurrence of metastasis to distant lymph nodes and organs. Stage IVS represents “special neuroblastoma”: These metastatic tumors often spontaneously regress and therefore have favorable prognosis. We furthermore found statistically significant differential expression of PIM2 and -3 between MYCN-amplified and nonamplified tumors (Fig. 1H). The same trends between PIM expression and outcome were observed in a second cohort of 88 patients (Supplementary Fig. S1; ref. 25), but not all differences reached statistical significance, most likely due to the smaller cohort size.
PIM kinases are a potential therapeutic target in neuroblastoma
To investigate PIM kinases as a potential therapeutic target in neuroblastoma, we first analyzed PIM protein levels in a panel of 14 neuroblastoma cell lines (Fig. 2A). The majority of cell lines expressed high levels of PIM1 and -3 and to a lesser extent PIM2. We observed no differential PIM expression between MYCN-amplified and nonamplified cell lines. Furthermore, several cell lines displayed high phospho-STAT3 levels, one of the upstream regulators of PIM.

PIM kinases are expressed in neuroblastoma and are a potential therapeutic target. A, Neuroblastoma cell lines express PIM kinases. Western blot analysis of lysates generated from 14 neuroblastoma cell lines. B and C, Knockdown of PIM reduces cell line viability. KELLY and SH-SY5Y cell lines were plated in 96-well plates, transfected with a scrambled siRNA (siCTRL) or siRNAs targeting PIM1, -2, or -3, cultured for 5 days, and viability was measured using CellTiter-Blue (n = 3). D, Neuroblastoma cell lines demonstrate differential sensitivity to AZD1208 in a colony formation assay. Cells were plated in 6-well plates and treated with increasing concentrations of AZD1208. Drug-containing medium was refreshed every 3 days. Cells were fixed, stained, and scanned when untreated wells reached confluency (n = 3). E, AZD1208-resistant cell lines demonstrate sustained mTOR signaling upon treatment. Cells were treated with 2 μmol/L AZD1208 for 0, 24, and 48 hours, followed by Western blot analysis (n = 3).
PIM kinases are expressed in neuroblastoma and are a potential therapeutic target. A, Neuroblastoma cell lines express PIM kinases. Western blot analysis of lysates generated from 14 neuroblastoma cell lines. B and C, Knockdown of PIM reduces cell line viability. KELLY and SH-SY5Y cell lines were plated in 96-well plates, transfected with a scrambled siRNA (siCTRL) or siRNAs targeting PIM1, -2, or -3, cultured for 5 days, and viability was measured using CellTiter-Blue (n = 3). D, Neuroblastoma cell lines demonstrate differential sensitivity to AZD1208 in a colony formation assay. Cells were plated in 6-well plates and treated with increasing concentrations of AZD1208. Drug-containing medium was refreshed every 3 days. Cells were fixed, stained, and scanned when untreated wells reached confluency (n = 3). E, AZD1208-resistant cell lines demonstrate sustained mTOR signaling upon treatment. Cells were treated with 2 μmol/L AZD1208 for 0, 24, and 48 hours, followed by Western blot analysis (n = 3).
To determine the dependency of neuroblastoma cells on PIM kinases, we performed siRNA-mediated depletion of PIM1, -2, or -3 in KELLY and SH-SY5Y cell lines (Fig. 2B and C; Supplementary Fig. S2A and S2B). Even though PIM kinases are described to be redundant, suppression of PIM1 was sufficient to reduce the viability of both cell lines. This is in line with findings in triple-negative breast cancer, in which PIM1 knockdown was sufficient to reduce cell viability (22, 23). We next investigated whether high PIM expression can be exploited therapeutically by treating all 14 cell lines with the selective pan-PIM inhibitor AZD1208 in both a short-term CellTiter-Blue cell viability assay (Supplementary Fig. S2C and S2D) and a long-term colony formation assay (Fig. 2D). Interestingly, approximately one third of the cell lines responded to treatment, whereas the other cell lines were resistant. We did not observe a clear correlation between PIM protein levels and PIM inhibitor sensitivity, possibly due to the relative small number of cell lines (Fig. 2A and D). We validated these results by repeating the colony formation assays with another pan-PIM inhibitor (PIM-447) in 3 AZD1208-sensitive and 3 AZD1208-resistant cell lines (Supplementary Fig. S2E and S2F).
To gain insights into the biochemical differences underlying these responses, we treated 3 sensitive and 3 resistant cell lines with 2 μmol/L AZD1208 for 0, 4, 24, and 48 hours and analyzed the activity of downstream components of PIM signaling (Fig. 2E). Only sensitive cell lines demonstrated reduced phosphorylation of p-70, S6, and 4EBP1 upon AZD1208 treatment, while MYC protein levels remained unaffected upon treatment. Again, we observed similar responses upon treatment with PIM-447 (Supplementary Fig. S2G).
CRISPR-Cas9 screen identifies genes whose loss confers PIM inhibitor resistance
The binary response of the neuroblastoma cell lines to the PIM inhibitors suggests the presence of an underlying mutation that confers resistance, which might be used as a biomarker for response. To identify genes whose loss renders cells insensitive to AZD1208 treatment, we performed a loss-of-function genome-wide CRISPR-Cas9 genetic screen (Fig. 3A). We infected the PIM inhibitor–sensitive KELLY cell line with lentivirus containing the GECKO library A (containing 3 gRNAs for each gene), cultured cells in the presence or absence of 2 μmol/L AZD1208 for 30 days, followed by genomic DNA isolation, PCR amplification of the gRNAs, and next-generation sequencing. To assess the efficacy of our screen, we analyzed the abundance of gRNAs targeting nonessential and essential genes in the untreated cells versus time point zero (T0; Supplementary Fig. S3). Whereas the relative abundance of gRNAs targeting nonessential genes remained stable over time, gRNAs targeting essential genes were depleted in the untreated cells compared with T0, thus validating the screen. Next, we analyzed which gRNAs were enriched in the treated versus untreated samples (Supplementary Table S2). Interestingly, within this list of 28 hits, we found a gRNA targeting the RAS-GAP NF1 and gRNAs targeting negative regulators of the AKT/mTOR pathway PTEN, TSC1, DEPDC5, and STK11 to be significantly enriched (Fig. 3B; Supplementary Table S2). We validated these hits by creating polyclonal knockout cell lines, in which we subsequently determined the response to AZD1208 using colony formation assays (Fig. 3C). Whereas KELLY cells infected with a nontargeting gRNA remained sensitive to AZD1208, knockout of either of the hit genes conferred resistance to PIM inhibitor treatment. Knockout was assessed by Western blot analysis if respective antibodies were available (Fig. 3D). Because all hit genes are known to regulate mTOR signaling, we analyzed the activity of S6 and 4EBP1 upon AZD1208 treatment in the context of the particular knockouts (Fig. 3D). Similar to our observations in neuroblastoma cell lines that are intrinsically resistant to PIM inhibitor treatment (Fig. 2D), knockout of the genes identified in the genetic screen resulted in persistent mTOR signaling upon PIM inhibition.
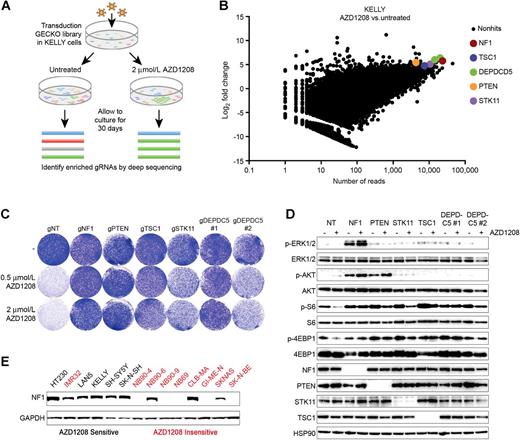
A CRISPR-Cas9 genetic screen identifies mediators of PIM inhibitor resistance. A, Schematic outline of the resistance screen. KELLY cells were infected with the genome-wide GECKO library A and cultured in the presence or absence of 2 μmol/L AZD1208. After 30 days, genomic DNA was isolated, gRNA sequences were PCR amplified, and the abundance of each gRNA in the treated versus untreated condition was determined by next-generation sequencing. B, The screen identifies loss of NF1 and genes regulating AKT/mTOR signaling as potential resistance mechanisms. The x-axis depicts the average number of sequencing reads in the untreated versus treated samples. The y-axis depicts the log2 fold change in abundance of gRNAs in the treated versus untreated population. A log2 fold change of 5 was used as cutoff to select hits. C, CRISPR-Cas9–mediated knockout of NF1, PTEN, TSC1, STK11, or DEPDC5 induces resistance to AZD1208. KELLY cells were plated in 6-well plates and treated with AZD1208. Drug-containing medium was refreshed every 3 days. Cells were fixed, stained, and scanned when untreated wells reached confluency (n = 3). D, CRISPR-Cas9–mediated knockout of NF1, PTEN, TSC1, STK11, or DEPDC5 results in sustained mTOR signaling upon PIM inhibition. KELLY cells were treated with 2 μmol/L AZD1208 for 48 hours, followed by Western blot analysis (n = 3). E, NF1 loss correlates with AZD1208 resistance in a panel of neuroblastoma cell lines. Western blot analysis of lysates generated from 14 neuroblastoma cell lines.
A CRISPR-Cas9 genetic screen identifies mediators of PIM inhibitor resistance. A, Schematic outline of the resistance screen. KELLY cells were infected with the genome-wide GECKO library A and cultured in the presence or absence of 2 μmol/L AZD1208. After 30 days, genomic DNA was isolated, gRNA sequences were PCR amplified, and the abundance of each gRNA in the treated versus untreated condition was determined by next-generation sequencing. B, The screen identifies loss of NF1 and genes regulating AKT/mTOR signaling as potential resistance mechanisms. The x-axis depicts the average number of sequencing reads in the untreated versus treated samples. The y-axis depicts the log2 fold change in abundance of gRNAs in the treated versus untreated population. A log2 fold change of 5 was used as cutoff to select hits. C, CRISPR-Cas9–mediated knockout of NF1, PTEN, TSC1, STK11, or DEPDC5 induces resistance to AZD1208. KELLY cells were plated in 6-well plates and treated with AZD1208. Drug-containing medium was refreshed every 3 days. Cells were fixed, stained, and scanned when untreated wells reached confluency (n = 3). D, CRISPR-Cas9–mediated knockout of NF1, PTEN, TSC1, STK11, or DEPDC5 results in sustained mTOR signaling upon PIM inhibition. KELLY cells were treated with 2 μmol/L AZD1208 for 48 hours, followed by Western blot analysis (n = 3). E, NF1 loss correlates with AZD1208 resistance in a panel of neuroblastoma cell lines. Western blot analysis of lysates generated from 14 neuroblastoma cell lines.
NF1 protein expression is a potential predictive biomarker for PIM inhibitor treatment
NF1 protein is estimated to be lost in approximately 1 of 3 neuroblastoma tumors (26), whereas mutations in PTEN, TSC1, DEPDC5, and STK11 rarely occur or have not been reported in neuroblastoma. Therefore, we analyzed the cell line panel for NF1 protein levels to investigate whether NF1 loss could be a potential biomarker to predict PIM inhibitor resistance (Fig. 3E). Five of 14 cell lines demonstrated complete loss of NF1 and were resistant to AZD1208. Furthermore, the resistant cell line SK-N-AS demonstrated partial loss of NF1, which has previously been reported and, in addition, carries an NRASQ61 mutation (26). The cell lines IMR32, NB90-6, and CLB-MA were resistant to AZD1208 despite being NF1 wild type, which suggests that other genes can also modulate the response to PIM inhibitors. Consistent with a causal role for NF1 in PIM inhibitor resistance, all AZD1208-sensitive cell lines in the panel expressed NF1 protein.
To further assess the effect of NF1 loss on AZD1208 sensitivity, we created NF1 knockout cells using two different gRNAs in KELLY, SH-SY5Y, and SK-N-SH cell lines. These NF1 knockout cells were subsequently treated with AZD1208 or PIM-447 in a colony formation assay (Fig. 4A–D; Supplementary Fig. S4A and S4B). In concordance with the initial results, NF1 loss induced resistance to both AZD1208 and PIM-447. To gain insights into the biochemical response underlying the resistance, we treated control and NF1 knockout cell lines with AZD1208 for 0, 4, 24, and 48 hours (Fig. 4E; Supplementary Fig. S4C and S4D). In line with NF1 being a negative regulator of RAS, we observed strong phosphorylation of downstream ERK and AKT in NF1 knockout cells. Whereas PIM inhibition suppressed phosphorylation of S6 and 4EBP1 in cell lines infected with a nontargeting gRNA, their activity was maintained upon NF1 loss.
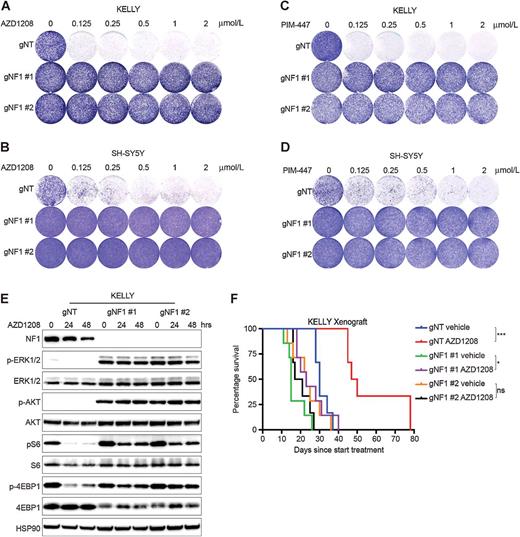
NF1 loss induces PIM inhibitor resistance. A–D, NF1 loss results in resistance to AZD1208 and PIM-447 in a colony formation assay. KELLY and SH-SY5Y cells were plated in 6-well plates and treated with increasing concentrations of AZD1208 or PIM-447. Drug-containing medium was refreshed every 3 days. Cells were fixed, stained, and scanned when untreated wells of each particular cell line reached confluency (n = 3). E, NF1 knockout results in enhanced MAPK and AKT signaling and sustained mTOR signaling upon PIM inhibition. KELLY cell lines were treated with 2 μmol/L AZD1208 for 0, 24, and 48 hours, followed by Western blot analysis (n = 3). F, PIM inhibition suppresses tumor growth of NF1 wild-type KELLY cells in a xenograft model. KELLY cells (1 × 10⁶ cells) were subcutaneously implanted in NMRI mice. Once tumors were established (80 mm3), animals were treated with vehicle or AZD1208 (90 mg/kg).
NF1 loss induces PIM inhibitor resistance. A–D, NF1 loss results in resistance to AZD1208 and PIM-447 in a colony formation assay. KELLY and SH-SY5Y cells were plated in 6-well plates and treated with increasing concentrations of AZD1208 or PIM-447. Drug-containing medium was refreshed every 3 days. Cells were fixed, stained, and scanned when untreated wells of each particular cell line reached confluency (n = 3). E, NF1 knockout results in enhanced MAPK and AKT signaling and sustained mTOR signaling upon PIM inhibition. KELLY cell lines were treated with 2 μmol/L AZD1208 for 0, 24, and 48 hours, followed by Western blot analysis (n = 3). F, PIM inhibition suppresses tumor growth of NF1 wild-type KELLY cells in a xenograft model. KELLY cells (1 × 10⁶ cells) were subcutaneously implanted in NMRI mice. Once tumors were established (80 mm3), animals were treated with vehicle or AZD1208 (90 mg/kg).
Because NF1 knockout cells display increased activation of both MAPK and AKT, we wondered whether the addition of a MEK or AKT inhibitor could alleviate resistance to PIM inhibitors. To assess the potential of this combination strategy, we cotreated control and NF1 knockout KELLY, SH-SY5Y, and SK-N-SH cells with AZD1208, the MEK inhibitor cobimetinib, or the AKT inhibitor MK2206 (Supplementary Fig. S5A–S5C; ref. 27). Interestingly, MEK inhibitor treatment sensitized NF1 knockout cell lines to AZD1208 in KELLY and SH-SY5Y cells. SK-N-SH cells displayed increased sensitivity to cobimetinib monotreatment upon NF1 loss and, therefore, demonstrated no additional benefit of PIM inhibitor treatment. Although AKT inhibition partially alleviated resistance in KELLY cells, it did not restore PIM inhibitor sensitivity in SH-SY5Y or SK-N-SH cell lines, suggesting that MAPK activation is the main driver of resistance upon NF1 loss. We subsequently investigated whether dual PIM/MEK inhibitor treatment could also prevent resistance to PIM inhibition in the “naturally” NF1-deficient cell lines from our cell line panel (Supplementary Fig. S5D–S5F). However, in line with a previous report (28), these NF1-deficient cells were highly sensitive to MEK inhibitor monotreatment, due to a dependency on MAPK signaling, which was not enhanced by AZD1208.
To validate the efficacy of PIM kinase inhibition in neuroblastoma in vivo, we subcutaneously injected control and NF1 knockout KELLY cells into nude mice and treated mice once daily with vehicle, 30 mg/kg AZD1208, or 90 mg/kg AZD1208 (Fig. 4F; Supplementary Fig. S6A–S6D). High-dose AZD1208 did not affect mouse body weight (Supplementary Fig. S6E). Whereas NF1 knockout tumors were found to be insensitive to AZD1208, the survival of mice harboring NF1 wild-type tumors was significantly prolonged upon PIM inhibitor treatment.
Discussion
Even though neuroblastoma is the most common malignancy in infants, the number of treatment options is limited compared with more frequently occurring types of cancer in adults. Because of the low absolute number of patients, there is a lack of financial incentive for pharmaceutical companies to develop compounds that are solely used in neuroblastoma. To overcome this problem, novel therapeutic targets in neuroblastoma should ideally be targetable by drugs that are currently in use or development for more frequent adult malignancies.
There are several recurrent mutations in neuroblastoma that might represent vulnerabilities that can be targeted pharmacologically. For instance, ALK mutations occur in 8% to 12% of all neuroblastoma (29, 30). This observation led to a phase I clinical trial assessing the efficacy of the ALK inhibitor crizotinib in neuroblastoma patients. However, of the 11 patients with ALK-mutant tumors, only 1 patient demonstrated a complete response and 2 patients displayed stable disease upon crizotinib treatment (31). Another frequently occurring aberration is NF1 deficiency. We and others have previously reported the presence of NF1 mutations and the loss of NF1 protein in neuroblastoma (26, 28). This is potentially clinically actionable due to the resulting activation of the RAS–MAPK pathway. Indeed, in childhood neurofibromatosis type I–related plexiform neurofibromas, the MEK inhibitor selumetinib proved to be very effective, with partial responses in 17 of 24 patients (32). Consistent with this, NF1-deficient neuroblastoma cells are more sensitive to MEK inhibition than their wild-type counterparts, providing a rationale to evaluate the clinical efficacy of MEK inhibitors in NF1-deficient neuroblastoma (Eleveld and colleagues, 2015; Woodfield and colleagues, 2016).
However, ALK and NF1 mutations are present in only a small fraction of neuroblastomas. In the current study, we find that PIM kinase inhibitors may elicit clinical benefit in NF1 wild-type tumors. This is of particular relevance, given that our data also indicate that high expression of PIM kinases is associated with poor clinical outcome. Furthermore, high PIM expression remained significantly associated with poor clinical outcome when tumors with low NF1 expression were excluded (Supplementary Fig. S6F). Thus, there is a significant unmet need to find better treatments for such patients.
The long-term benefit of targeted therapies is generally hampered by the development of resistance. In line with this observation, AZD1208 initially suppressed growth of KELLY cells, but did not prevent long-term tumor outgrowth in vivo (Fig. 4F). Additional research is necessary to identify rationally designed drug combinations with PIM inhibitors to prevent the outgrowth of resistant neuroblastoma cells. Current treatment regimens for (especially high risk) neuroblastoma mostly include a combination of chemotherapeutic drugs. Interestingly, it has previously been demonstrated that PIM kinase inhibitors can enhance the efficacy of chemotherapeutic agents in triple-negative breast cancer xenografts (23). Similar observations were made in cell lines derived from different tumor tissues, in which PIM1 expression antagonized chemotherapy-induced apoptosis (33). It is therefore interesting to speculate that the addition of a PIM inhibitor might improve the efficacy of current treatment regimens.
In conclusion, we have identified PIM kinases as a novel therapeutic target in neuroblastoma. Furthermore, NF1 loss can be used as a biomarker to identify patients that do not benefit from PIM inhibitor treatment.
Disclosure of Potential Conflicts of Interest
No potential conflicts of interest were disclosed.
Authors' Contributions
Conception and design: D. Brunen, R. Bernards
Development of methodology: D. Brunen, R.L. Beijersbergen
Acquisition of data (provided animals, acquired and managed patients, provided facilities, etc.): D. Brunen
Analysis and interpretation of data (e.g., statistical analysis, biostatistics, computational analysis): D. Brunen, R.C. de Vries, C. Lieftink, R.L. Beijersbergen, R. Bernards
Writing, review, and/or revision of the manuscript: D. Brunen, R. Bernards
Administrative, technical, or material support (i.e., reporting or organizing data, constructing databases): R.C. de Vries
Study supervision: R. Bernards
Acknowledgments
This study was supported by grants from the Dutch Cancer Society, the Center for Cancer Genomics, and Stand Up to Cancer (SU2C-AACR-DT0912). We thank all members of the Bernards Laboratory for helpful support and discussions. We thank the intervention unit of The Netherlands Cancer Institute for assistance with the xenograft experiments. We thank Dr. R. Versteeg for making the R2 tool publicly available.
The costs of publication of this article were defrayed in part by the payment of page charges. This article must therefore be hereby marked advertisement in accordance with 18 U.S.C. Section 1734 solely to indicate this fact.