
Abstract
Wearable devices can be found as numerous types of health devices ranging from monitoring hazardous environments to detecting physiological signals. Its utilities have also shown encouraging improvements toward personalized healthcare. Thus, many kinds of wearable health devices (WHD) have been reported and developed. Those reports highlight their efficiency in monitoring harmful environmental factors and various diseases for diagnostic and treatment purposes. This paper proposes a watch-type of dual-mode WHD that can perform gaseous phase detection to monitor dangerous environmental situations such as bad air quality and aqueous phase detection to measure physiological signals from human sweat or blood. The proposed system was fabricated on a printed circuit board and its size is 3 cm × 3 cm which is suitable as a wearable device. It also consumes very low power and has capabilities of wired/wireless charging and wired/wireless communication. Furthermore, customized windows and Android applications have been developed to visualize obtained data in a user's computer or smartphone. The system was tested both electrically and chemically and showed promising results as the WHD.
Highlights
Practical realization of a low-cost and battery-powered wearable health device
Dual mode sensing capability for gaseous and aqueous phase sensing
Small form factor of 3 cm x 3 cm with lowest circuit complexity
Wide current measurement range for amperometric screen printed sensor (±100 μA)
User friendly windows and android applications
Export citation and abstract BibTeX RIS

This is an open access article distributed under the terms of the Creative Commons Attribution 4.0 License (CC BY, http://creativecommons.org/licenses/by/4.0/), which permits unrestricted reuse of the work in any medium, provided the original work is properly cited.
Wearable health devices (WHDs) are getting an intensive spotlight among researchers for better monitoring of patient's health status for self-health tracking that can provide real-time medical data to clinicians for an earlier diagnosis, and guidance of treatment in a timely manner. Consequently, according to Verified Market Research, the global WHD market size was valued at USD 13.8 Billion in 2020 and is projected to reach USD 37.4 Billion by 2028. Compound Annual Growth Rate (CAGR) of 13.1% from 2021 to 2028.
1
Many companies have developed wearables and smartphone applications to provide a wide range of healthcare services. This trend is expected to accelerate.
2
For establishing WHDs, a miniaturization of electronic devices is the key to design more reliable and adaptable wearables devices and conducting measurements to obtain real time data from the patients. As of now, many papers have been published to demonstrate the WHD with various purposes for different groups of people.
3–30
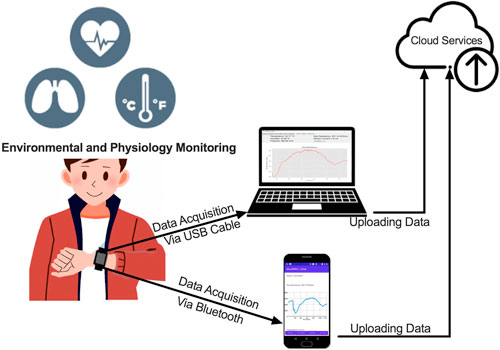
The WHD can be divided into two groups by its sensing targets. The first group is to monitor hazardous environments around the users like bad air quality that can cause health issues by utilizing gaseous phase sensors. Meanwhile, the other group performs measurements to detect and analyze a sample produced from human fluid by implementing aqueous phase sensors to track physiological symptoms. Recently, air pollution (indoor and outdoor) has become a serious threat to humans. Nowadays, real-time monitoring of multiple air pollutants, for example, volatile organic compounds (VOCs), 
 CO, etc is essential to maintain healthy conditions.
5–10
For example, Palomeque-Mangut, et al. have developed WHD that can measure outdoor air quality and send the data to the user through Bluetooth Low Energy (BLE) which is small-sized, light-weighted, and belt-worn, with a user-friendly interface.
11
The other research groups have reported a WHD that can detect toxic gases such as
CO, etc is essential to maintain healthy conditions.
5–10
For example, Palomeque-Mangut, et al. have developed WHD that can measure outdoor air quality and send the data to the user through Bluetooth Low Energy (BLE) which is small-sized, light-weighted, and belt-worn, with a user-friendly interface.
11
The other research groups have reported a WHD that can detect toxic gases such as 

 and
and  by implementing electrochemical gas sensor arrays. The developed WHD supports multiple electrochemical measurement modes to provide orthogonal data to in-module sensor array algorithms for better prediction accuracy.
13–16
Nevertheless, the importance of measuring a signal from the body itself cannot be underestimated as the WHD. Many researchers have reported multiple types of WHD to detect biomarkers for physiological signal monitoring such as
by implementing electrochemical gas sensor arrays. The developed WHD supports multiple electrochemical measurement modes to provide orthogonal data to in-module sensor array algorithms for better prediction accuracy.
13–16
Nevertheless, the importance of measuring a signal from the body itself cannot be underestimated as the WHD. Many researchers have reported multiple types of WHD to detect biomarkers for physiological signal monitoring such as  glucose, uric acid, lactic acid, and metabolites, etc.
19–27
One research group, Tipparaju et al. have developed a watch-type of wearable transcutaneous
glucose, uric acid, lactic acid, and metabolites, etc.
19–27
One research group, Tipparaju et al. have developed a watch-type of wearable transcutaneous  monitoring device that utilizes an infrared sensor. It can be widely used in the remote assessment of pulmonary gas exchange efficiency for patients with respiratory diseases, like COVID-19, sleep apnea, and chronic obstructive pulmonary disease.
19
Another research group, Katseli, et al. recently released a smartphone addressable electrochemical ring (e-ring) for nonenzymatic self-monitoring of glucose in sweat. It is a wearable glucose monitoring device in the form of an e-ring fabricated by a 3D printer and resistant to mechanical bending for noninvasive glucose detection in sweat.
20
To adopt high edge techniques, some papers utilized artificial intelligence based deep learning models in a wearable platform along with cloud computing, to improve the accuracy of diagnosis.
28–31
For instance, a deep learning prediction model based on a recurrent neural network and restricted Boltzmann machine is proposed for superior prediction accuracy in a wearable continuous glucose monitoring to provide future glucose levels of patients.
30
monitoring device that utilizes an infrared sensor. It can be widely used in the remote assessment of pulmonary gas exchange efficiency for patients with respiratory diseases, like COVID-19, sleep apnea, and chronic obstructive pulmonary disease.
19
Another research group, Katseli, et al. recently released a smartphone addressable electrochemical ring (e-ring) for nonenzymatic self-monitoring of glucose in sweat. It is a wearable glucose monitoring device in the form of an e-ring fabricated by a 3D printer and resistant to mechanical bending for noninvasive glucose detection in sweat.
20
To adopt high edge techniques, some papers utilized artificial intelligence based deep learning models in a wearable platform along with cloud computing, to improve the accuracy of diagnosis.
28–31
For instance, a deep learning prediction model based on a recurrent neural network and restricted Boltzmann machine is proposed for superior prediction accuracy in a wearable continuous glucose monitoring to provide future glucose levels of patients.
30
However, some of the essential features are missing in the previously addressed papers such as wireless communication, small size to be considered as wearable, rechargeable capability, or user-friendly interface. Moreover, none of the systems has been reported that can perform dual-mode measurements that can conduct both gaseous phase and aqueous phase measurements together in a single WHD. We believe monitoring both environmental factors and signals of symptoms produced by patients is essential to diagnose patients' accurate condition, additionally, to attract various users of different ages, regions, and situations. Thus, we propose a watch-type of dual-mode WHD that can measure air quality around the user in real-time and perform aqueous phase detection from human fluid in a single WHD. The device can send the data to the user through wired/wireless communication. It also has functions of wireless charging as well as wired charging with a size of 3 cm × 3 cm. The proposed system can detect VOC, temperature, humidity, and signals produced from the body with any amperometric screen printed electrode sensor (SPES) with customized user-friendly windows/Android application.
System Design
Hardware design
Figure 1 shows a block diagram of the proposed system. The hardware of the system includes four sections which are processor, sensors, communication, and power management. To control the system and analyze the SPES output, "CY8C5888LTI-LP097" (Cypress Semiconductor, CA, USA) is implemented as a microcontroller unit (MCU) that has a small form factor, low power consumption, and low cost. The selected MCU provides a combination of a central processing unit with flexibly configurable blocks of analog subsystem like transimpedance amplifier (TIA) to interpret current inputs, digital subsystem, routing, general-purpose input/output pins, and universal Serial Bus (USB) protocol. As sensors, the device utilizes "BME680" (Robert Bosch, Gerlingen, Germany) as gaseous sensor to measure the quality of the air. The selected sensor can detect variety of parameters like VOC, temperature, pressure, and humidity in a single chip with ultra-low power consumption, low cost, quick response time, and small form factor. For the aqueous phase measurement, our versatile system can adopt and analyze any amperometric SPES for numerous purposes, which has an output current range of −100 μA to + 100 μA in a resolution of 0.05 μA. Meanwhile, to support wireless communication, the BLE module "SPBTLE-1S" (STMicroelectronics, Geneva, CH) that has an integrated onboard chip antenna is employed for a small form factor and low power. This BLE module consumes 15 mA in maximum transmission mode with + 4 dBm transmit power and it only consumes 500 nA in standby mode. Either a rechargeable lithium-ion polymer (LiPo) battery or USB can be utilized to power up the device. The designed system consumes a maximum power of 33 mA, which indicates that with a 350 mAh capacity rechargeable battery, the device can be operated for nearly 11 h with a single charge. The battery can be charged via wired or Qi wireless charging pad. For wired charging, 5 pin micro-USB can be used and to realize it, "MCP73831" (Microchip, AZ, USA) has been adopted. It includes a linear charge management controller with a high accuracy preset voltage regulation, automatic power-down, and thermal regulation. To establish wireless charging, "BQ51013BRHLR" (Texas Instrument, TX, USA) wireless charging IC pairs with "760308101303" wireless charging coil (Wurth Elektronik, Niedernhall, Germany) have been utilized as receiver, AC to DC conversion and regulation, dynamic rectifier control for improved load transient response, thermal shutdown, and providing 5 W to the device.
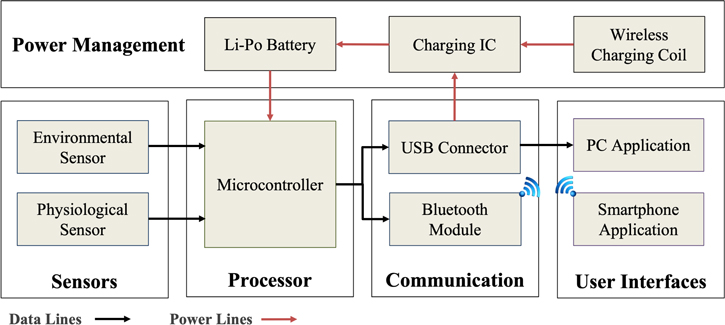
Figure 1. Block diagram of the proposed system.
Download figure:
Standard image High-resolution imageSoftware design
Firmware
The firmware is written in the embedded C programming language and is compiled using PSoC Creator 4.4 compiler released by Cypress semiconductors. The proposed device includes two sensors, "BME680" and amperometric SPES. The "BME680" is utilizing Inter-Integrated Circuit (I2C) communication protocol to send measured data to the MCU. Whereas, to interpret an output current of the SPES, an amperometry method is embodied by employing internal MCU blocks.
Figure 2 illustrates a block diagram of the firmware for the amperometry.
32
For establishing the amperometry circuit, internal blocks of the MCU are utilized like 8-bit digital to analog converter (DAC), operational amplifier (op-amp), TIA, and 12-bit analog to digital converter (ADC) as shown in Fig. 2. The SPES consists of 3 electrodes; counter electrode (CE), reference electrode (RE), and working electrode (WE). To provide the constant voltage to the RE of the SPES, a potentiostat is embodied by a DAC and an op-amp which passes a current through the CE until the potential of RE reaches the same potential as the DAC. A positive input of the op-amp is connected to the DAC while negative input of the op-amp is connected to the RE. The output of the op-amp is connected to the CE to establish the potentiostat. For measurements with negative voltage or current conditions using a single ended power supply, a virtual ground concept is adopted by taking advantage of the op-amp's characteristic that the potential difference between two input terminals of the op-amp is zero, and no current is flowing into the input terminal of the op-amp. Therefore, 2.048 V is provided into the negative input of an ADC and positive pin of a TIA to make a virtual ground at 2.048 V, using the internal DAC. Thus, the potential range between WE and RE can be achieved as ± 2.048 V with 1 mV resolution. To interpret the output of the SPES which is current, the TIA is used that includes an op-amp and a feedback resistor ( ) whose value is set as 20 KΩ to convert a current signal to the voltage. The converted voltage from TIA is fed into a differential ADC to digitize the difference between the two varying voltage levels. Obtained voltage from the ADC (
 ) is used to calculate the value of sensor output current following equation,
1
where
) is used to calculate the value of sensor output current following equation,
1
where  is the output current of the SPES,
  is the reference voltage of the TIA and the ADC, and
  is the feedback resistor of TIA.

The utilized ADC can interpret voltage within a range of ± 2 V with 1 mV resolution so that the proposed WHD can detect a 50 nA current difference generated from the SPES. To utilize the windows application, MCU's internal USB peripherical interface has been utilized to establish communication between the device and personal computer (PC). Meanwhile, for wireless communication, the BLE module interacts with the MCU using universal Asynchronous Receiver Transmitter (UART) port. The flowchart from Fig. 3 demonstrates the flow of the firmware. The system will be initialized once the power is on, and all the sensors and communication ports will be ready after the initialization. Based on the command received from the user through USB or BLE, the system will conduct corresponding functions.
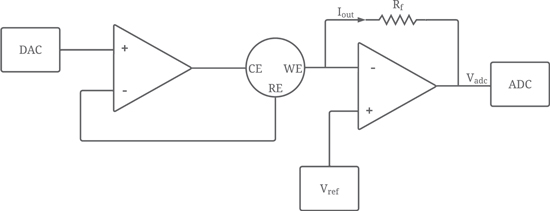
Figure 2. Block diagram of the firmware for the amperometry.
Download figure:
Standard image High-resolution image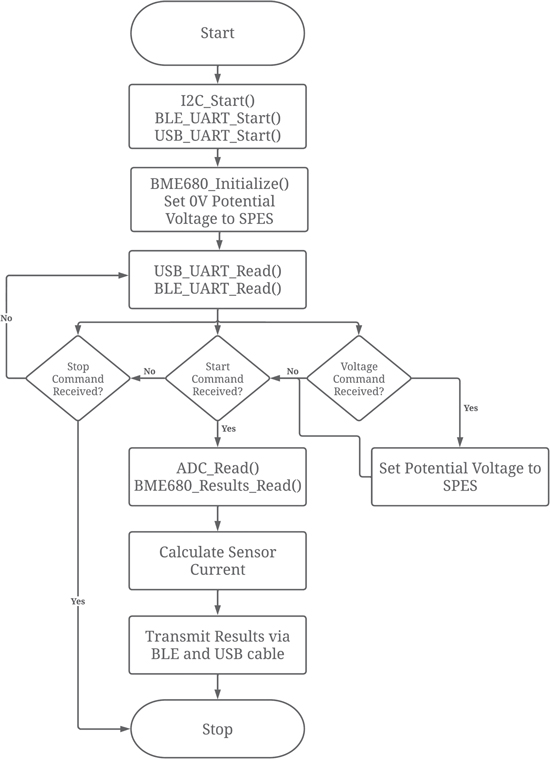
Figure 3. Flowchart of the firmware.
Download figure:
Standard image High-resolution imageWindows application
The windows application is written with Python 3.11. Once the device is connected to the PC, the application searches the device and establishes a connection channel between the device and the PC. The application can save, and export obtained data from the device, as well as control the device and display the data in a graphical format. Figure 4 shows the main window of the developed application.
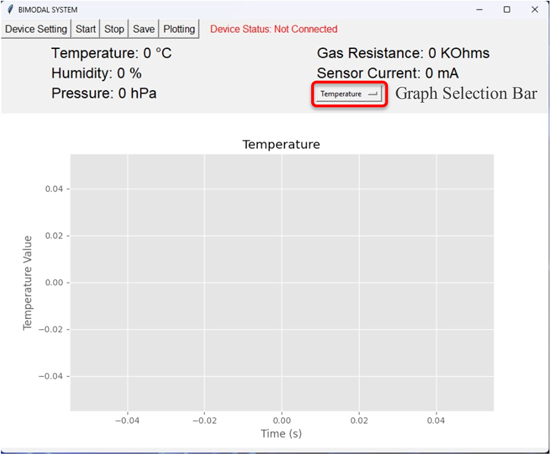
Figure 4. Snapshot of the windows application.
Download figure:
Standard image High-resolution imageAndroid application
An Android application is developed using the Android Studio Arctic Fox 2020.3.1 Patch 4 version. The source codes are written in JAVA and layouts are developed using Extensible Markup Language (XML). Figure 5 demonstrates a flowchart of the Android application.
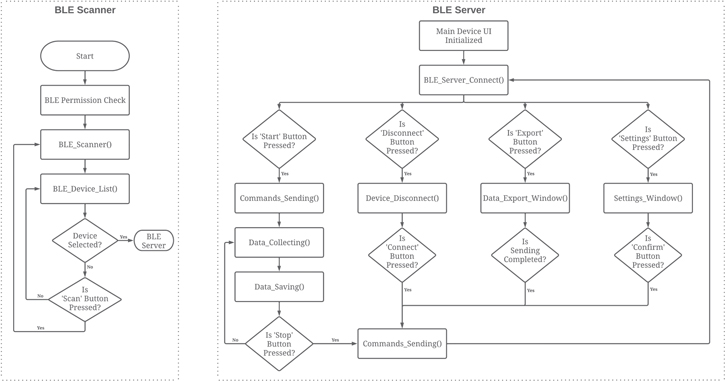
Figure 5. Flowchart of Android application.
Download figure:
Standard image High-resolution imageThe developed Android application can be split into two parts, a scanner, and a server. The scanner part is to scan nearby BLE devices, while the server part handles a BLE communication between the device and the Android application. The server part is responsible for executing functions like plotting, saving, exporting the data, and device setting. Figure 6 illustrates the main display of the developed Android application and setting window. As shown in Fig. 6a, the main window shows the real time data in a graphical format. User can choose the device settings such as a selecting the value of reference potential voltage for the SPES and a data collection mode as depicted in Fig. 6b. The saved data can be uploaded to any cloud services.
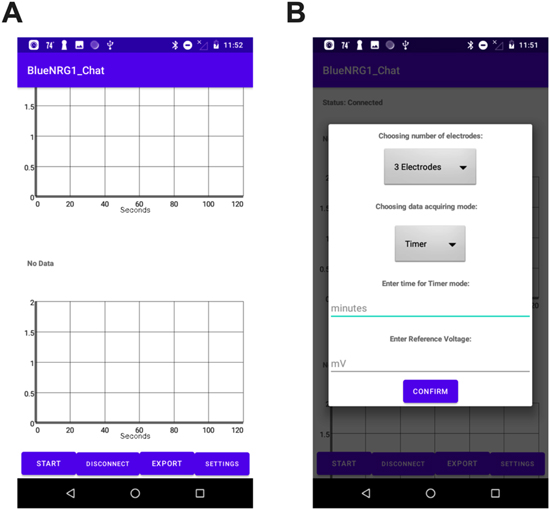
Figure 6. Snapshot of the Android application (a) Main window; (b) Setting window.
Download figure:
Standard image High-resolution imageMeasurement and Discussion
The designed system on printed circuit boards (PCBs) is shown in Fig. 7 and its size is 3 cm × 3 cm. The figure also illustrates the device in a watch-type case and put on a wrist to demonstrate the concept of the proposed device. The top PCB includes a BLE module, USB, battery connector, wired and wireless charging modules, and "BME680" while MCU and SPES connector are implemented on the bottom PCB.
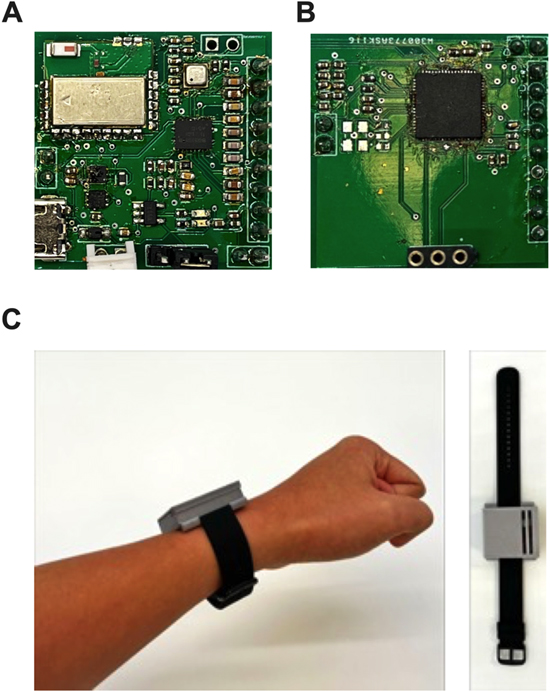
Figure 7. Photo of the proposed design fabricated in Printed Circuit Board (PCB) (a) Top PCB; (b) Bottom PCB; (c) the proposed system in a watch-type wristband.
Download figure:
Standard image High-resolution imageElectrical testing
To validate the system, electrical testing has been performed by using a Source Measure Unit (SMU) as an electrical equivalent model of the SPES. During the experiment, the SMU was set in a sweeping mode where the current was varied from 0 μA to 100 μA with 1 μA resolution and 1 second of delay per step. If the SMU reaches a level of 100 μA, it automatically switches off and pulls −10 μA from the device. An error rate of the system can be calculated with equation,
2
where  is the measured current from the system and
  is the expected current value.

The system can detect and plot the current from 0 to + 100 μA accurately with less than 1% error rate as depicted in Fig. 8. Since the ADC is set to perform in a differential mode and the current measurement range mirrored around the reference point 0 μA, if the device can accurately measure from 0 μA to + 100 μA, it indicates that this device is also able to measure from −100 μA to 0 μA.
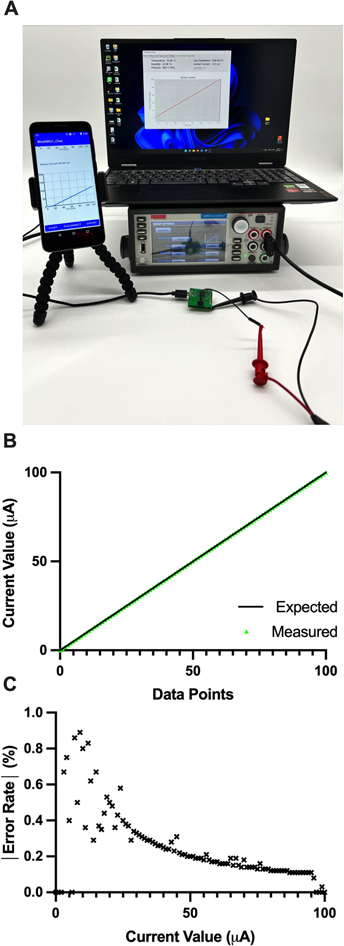
Figure 8. Photo of test results with source measurement unit (a) Test setup; (b) Measured versus expected results; (c) Error rates.
Download figure:
Standard image High-resolution imageChemical testing
The chemical tests have been conducted with a VOC which is one of the hazardous environmental gases and glucose as an example of physiological signal detection. Figure 9 illustrates the test setups of the VOC test and the glucose test, respectively.
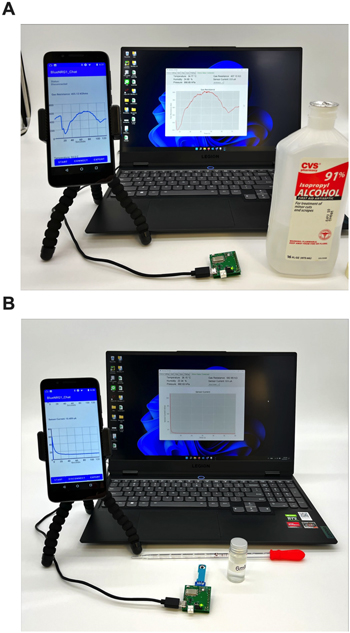
Figure 9. Photo of test setup (a) VOC; (b) Glucose.
Download figure:
Standard image High-resolution imageVOC test
To test the proposed system with VOC, samples of 91% Isopropyl Alcohol (CVS Pharmacy, TX, USA), air freshener, and breath VOC have been utilized. In case of Isopropyl Alcohol and air freshener, the lid of the bottle is opened and closed alternatively to stimulate more or less VOC gas concentration in the room, whereas in case of breath VOC, human breath is blown towards the sensing device. The concentration of VOC is higher in Isopropyl Alcohol, moderate in air freshener, and low in breath VOC. The BME680 sensor is expected to respond accordingly by varying its gas resistance values. The changes in the gas resistance values are plotted in both windows and Android applications in real-time. As shown in Fig. 10, corresponding to the gas emission, values of the sensor gas resistance have been changed. The BME680 gas resistance decreases in the presence of VOC indicating a bad air quality. During the experiments, it is observed that the gas resistance ranged between 500 KΩ to 550 KΩ in normal air. As illustrated in Fig. 10c, the gas resistance dropped to ∼100 KΩ, when exposed to high concentrations of Isopropyl Alcohol. Whereas the gas resistance dropped to ∼320 KΩ in the presence of moderate concentration of VOC in air freshener as depicted in Fig. 10d. During the test with breath VOC in Fig. 10e, the gas resistance showed a drop to ∼440 KΩ by detecting a lower concentration of VOC in breath. This demonstrates that the designed WHD can detect various types of VOCs at different concentrations.
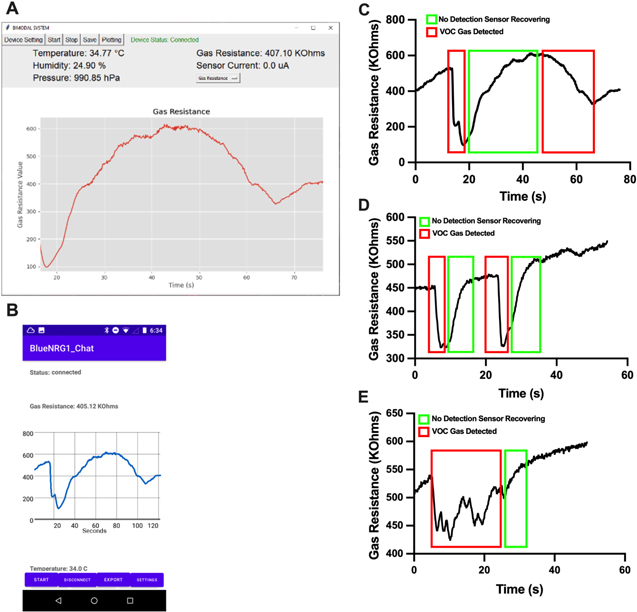
Figure 10. Snapshot of the VOC test results (a) Windows application; (b) Android application; (c) Gas resistance values over time for test with isopropyl alcohol; (d) Gas resistance values over time for test with air freshener; (e) Gas resistance values over time for test with breath VOC.
Download figure:
Standard image High-resolution imageGlucose test
A 0.1 M Tris-HNO3 pH 7.0 buffer solution was prepared using a Tris-base (99.9%), nitric acid (0.1 M HNO3 (0.1 N), Titripur®), and deionized water. The enzymes glucose oxidase (GOD) and horseradish peroxidase (HRP) are required to make a glucose solution. 32 Hence, a 12 mM glucose solution was prepared using a buffer solution and D-(+)-Glucose (≥99.5%). All the chemicals were purchased at Sigma-Aldrich (MA, USA). As a SPES, DRP-C11L (Metrohm, FL, USA) with carbon for working and counter electrodes while Ag/AgCl for reference electrode were utilized. Since O2 is always presented in the glucose solution and a carbon ink of the WE include a ferrocyanide, chemical reactions occur between the DRP-C11L sensor and the glucose solution as represented in Eqs. 3 and 4


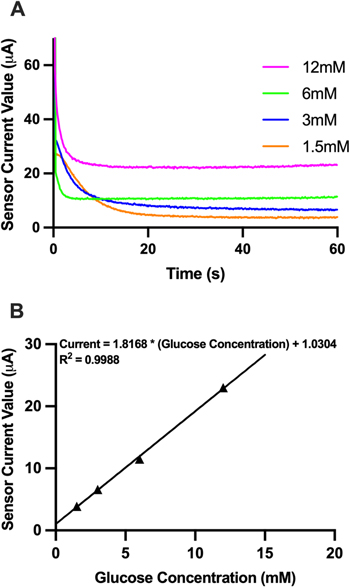
The 12 mM glucose solution was used to prepare other concentration glucose solutions such as 6 mM, 3 mM, and 1.5 mM by diluting the 12 mM solution with the deionized water. For the experiments, the SPES is connected to the device by using a SPES connector and a voltage potential of RE was set as 1.0 V, and 40 μl of a glucose solution with different concentrations were introduced to the SPES using a micropipette. The experiments were conducted for 60 seconds. After 20 seconds, the currents produced from the SPES settled and were recorded to determine a calibration curve and equation as depicted in Fig. 11. With a high R2 value of 0.9988, the calibration is proved to be a good model for approximating other concentrations of glucose solutions. The glucose level in human body ranges between 2.6 mM to 21.1 mM. Generally, a glucose level below 2.6 mM is treated as low, levels between 2.6 mM to 8.2 mM is considered as normal, and a glucose concentration higher than 8.2 mM till 21.1 mM is termed as diabetic. 35 The glucose levels between 2.6 mM to 21.1 mM yields current values in the range 5.7 μA to 39.4 μA as per the trend line stated in Fig. 11. Since the designed WHD can be used with any amperometric SPES having current measurement range from −100 μA to + 100 μA, it can detect glucose level in body that corresponds to diabetes.
Figure 11. Glucose test result (a) Amperometric measurement for solutions with different glucose concentrations; (b) Calibration curve.
Download figure:
Standard image High-resolution image
Comparison with state-of-the-art works
In this section, a comparison between the proposed WHD and other existing WHDs is presented as listed in Table I. All other existing WHDs can perform single mode detection (either gaseous or aqueous), in contrast to which, the proposed WHD accomplished dual-mode sensing capability for the first time including both monitoring hazardous environments and detecting physiological signals in a single device. In addition, it demonstrates a practical realization of a low-cost, low-power wearable readout device for battery-powered applications. The WHD exhibits a small form factor compared to existing literatures with the lowest circuit complexity, a relatively better measurement accuracy, and a processing speed. The features like wide current measurement range for amperometric SPES, wireless charging capability, and user-friendly windows and Android applications have been implemented in the proposed system. As a result, the proposed device has an impact to be used as a WHD in applications like comprehensive electrochemical monitoring and point-of-care systems.
Table I. Comparison of proposed WHD with state-of-the-art works.
| References | Detection modality | Device type/Size (mm2) | Target analytes | Additional parameters | Microcont-roller | Conn-ectivity | Voltage range (V) | Current range (μA) | Error rate | Power |
|---|---|---|---|---|---|---|---|---|---|---|
| This work | Aqueous, Gaseous | Wrist worn (30 × 30) | VOC, CO, Glucose | T, H, P | CY8C5888LTI-LP097 | BLE | 3.7 | ± 100 | 0.9988 R2 (Aqueous) | 33 mA |
| < 1.5% (Gaseous) | ||||||||||
| 3 | Gaseous | Smart clothing | CO, O2, CH2O, H2S | T, HR, A | SAMD21G18A | BLE | 3.3 | NA | 10% | 3.54 mW |
| 6 | Gaseous | Wrist worn | VOC, O3 | T, H, A | BM15_AN | BLE | — | NA | 10 ppb | — |
| 9 | Gaseous | Wrist worn (50 × 42) | SO2, NO2, CO | T, H, P, S | NRF51822 | BLE | — | NA | — | 15.8 mA |
| 11 | Gaseous | Not specified (39 x 33) | CO, NO, NO2, O3, PM2.5, PM10 | T, H | PIC32MM0256GPM048 | BLE | 3.7 | NA | 17.7% | 130 mA |
| 12 | Gaseous | Wrist worn | CO2 | None | — | None | 3.3 | NA | — | — |
| 33 | Gaseous | Wrist worn | VOC, O3, NOx, COx | T, H, UV | STM32f4 | BLE | 3 − 5 | NA | — | 250 mA |
| 34 | Gaseous | Not specified | CO2 | T, H | PIC18F26J50 | Xigbee | 3.7 | NA | 3.4% | 69 mA |
| 32 | Aqueous | Portable (48 × 37) | Glucose, Uric acid | None | CY8C5888LTI-LP097 | BLE | ± 2 | ± 100 | 1% | — |
| 22 | Aqueous | Patch type (24 × 35) | Glucose | None | CC2640 | BLE | 3.3 | 0 − 2 | — | 8 mA |
| 23 | Aqueous | Portable (108.9 × 24.1) | Glucose, Vitamin C, Lead | None | CY8CKIT-059 | None | ± 2 | ± 100 | 0.98 R2 | — |
| 24 | Aqueous | Not specified (34 × 25) | PfHRP2 | None | ATmega32U4 | None | — | ± 500 | 1.8% | 250 mW |
| 25 | Aqueous | Wrist worn | Glucose | None | ATmega328p | None | 1.8 | ± 0.6 | 3.3% | — |
| 26 | Aqueous | Patch type (51 × 51) | Glucose | None | STM32f103 | None | 7.4 | 0 − 2000 | 0.9432 R2 | — |
| 27 | Aqueous | Patch type (15 × 15) | Glucose, lactate, Na+, K+ | T | MS02 (custom chip) | BLE | — | — | 0.999 R2 | — |
* T - Temperature, H - Humidity, P - Pressure, S - Sound level, HR - Heart rate, A - Activity level, UV - Ultraviolet, NA- Not applicable.
Conclusions
A dual-mode WHD has been proposed and evaluated in this work. It can detect both hazardous environmental gases and physiological signals from the human fluid like glucose, by utilizing amperometry SPES in a single device. The device can analyze an amperometric SPES range from − 100 μA to + 100 μA with a less than 1% of error rate. The customized and user-friendly windows and Android applications have been developed to control the device and display the measurement data. The proposed system can send the data through BLE or USB to the user based on the user's preference. The Android application has a function to upload the collected results to any cloud services such as Google Drive or One Drive. Furthermore, the device consumes very low power and area which are critical factors for a WHD. It has wired and wireless charging capabilities to recharge the device with ease. Furthermore, the chemical tests were conducted to validate performances of the device. The results show that the proposed watch type dual-mode WHD can perform as intended. The overall system performances are listed in Table II. To summarize, the proposed dual-mode WHD has a great potential to be implemented for a real-time health monitoring.
Table II. System performance summary.
| Criteria | Value |
|---|---|
| Power Consumption | 33 mA @ 3.7 V |
| Battery Capacity | 350 mAh |
| ADC Resolutions | 12-bits |
| Measurement Range (SPES Sensor) | − 100 μA to +100 μA |
| Measurement Resolution | 0.05 μA |
| Aqueous Sensing Error Rate | < 1.0% |
| Gaseous Sensing Error Rate | ∼ 1.5% |
| Wired Communication Latency | ∼150 ms |
| Wireless Communication Latency | ∼170 ms |
| Size | 3 cm × 3 cm |