
Abstract
In this work, MnO2-SnO2 nanocomposite based below lower exposure limit (0.5–2.0 vol%) sensing device for liquefied petroleum gas (LPG) is reported. The synthesized material is highly crystalline with an average crystallite size of 16.786 nm, confirmed by the X-ray diffraction pattern. Williamson-Hall plot shows that the induced strain of 2.627 × 10⁻⁴, present in the nanocomposite, lies between the induced strains of both of its constituents. The XRD pattern of nanocomposite contains the cubic phase of MnO2 and the tetragonal phase of SnO2. Tauc plot shows the optical energy band gap of MnO2, SnO2, and MnO2-SnO2 of 3.407 eV, 3.037 eV, and 3.202 eV respectively. The surface morphological investigation shows the brush-like structure which enhances sensor performance by providing activation sites. The energy dispersive X-ray (EDS) spectrum found that materials are highly pure because other peaks are not observed. The functional group analysis by using FTIR found to be Sn–O and Mn–O both vibration bands existed. The highest sensor response was found to be 2.42 for 2.0 vol% whereas for a lower concentration of 0.5 vol% the sensor response was observed to be 1.44. The fast response and recovery of this sensing device were found to17.30 and 23.25 s respectively for 0.5 vol% of LPG.
Export citation and abstract BibTeX RIS

This is an open access article distributed under the terms of the Creative Commons Attribution 4.0 License (CC BY, http://creativecommons.org/licenses/by/4.0/), which permits unrestricted reuse of the work in any medium, provided the original work is properly cited.
At present time atmospheric pollution is a very serious problem for the whole world. 1,2 So, the development of a quick responsive, highly selective, and the stable sensor is the most urgent requirement that should consume less power, trace a small amount of gas, and operate at low temperatures. 3–5 Numerous types of nanostructured nanomaterials are used to detect the various type of gases such as metal oxide, conducting polymers, 4,6,7 carbon nanotubes, graphene oxide, and metal-organic framework, etc. 8–10 Liquefied petroleum gas (LPG) is a highly explosive gas that is widely used in domestic and industries and it is very harmful to the human being as well as the environment. 11 One of the combustible and dangerous gases frequently utilized in homes and businesses is LPG. Therefore, we must create an LPG sensor that responds rapidly, is extremely discriminating, and operates at low temperatures. LPG is a mixture of hydrocarbons and the composition of gases consists of. 12 The lowest explosion limit (LEL) of propane and butane is calibrated as 2.2% and 1.8% in air through the various agencies. 13 The threshold limit value (TLV) of LPG is 1000 ppm averaged over an 8 h work shift. The LPG is increasingly used not only in the domestic sector but also in the transport sector as fuel and most fire accidents are due to leakage of gas. 14 Therefore, it is pivotal to detect it in an early stage to avoid any unfortunate accidents. Various types of nanostructured such as metal oxide, conducting polymers, carbon nanotubes, and graphene oxide-based LPG sensors have been reported previously. 15,16
The metal oxide semiconductors (MOS) are a promising candidate for the detection of LPG gas because it is low-cost and easy to fabricate. 17 Various studies have been reported on the MOS-based LPG sensor, for example, S. Choudhary et al. reported that ZnO nanorods-based LPG sensor operated at 120 °C–200 °C operating temperature. 18 The ZnO nanorods were prepared by the colloidal method and the sensitivity was found as 49% at 100 ppm. Whereas the response and recovery time was found to be 39 and 49 s respectively. Another R. D. Ladhe et al. reported the Bi2S3/PbS (p–n heterojunction) based LPG sensor. In this work, the sensor response was found as 71% at 1000 ppm with 170 s and 300 s response and recovery times, respectively. 19 Another, U. T. Nakate et al. stated the Au sensitized SnO2 thin film for the detection of LPG. Au-sensitized SnO2 film showed a response time of the 60 s and sensor response of 57% at 780 ppm of LPG at 325 °C operating temperature. 20 Among these T. Holder et al. have developed Bi2SiO5/MWCNT nanocomposite via the wet chemical method and detection. 21 Another, R. N. Bulankhe et al., stated the Ppy/TiO2 heterojunction-based LPG sensor operated at low temperature. 22 The maximum gas sensor was found to be 55% at 1040 ppm and the response/recovery time was 112/131 s respectively. On the basis of literature, most LPG sensors have some addresses such as high operating temperature, low sensitivity, long response, and recovery time. So, it is necessary requirement for the development of an extremely sensitive and quick responsive LPG sensor that operated at room temperature.
SnO2 is a wide band (3.6 eV) n-type semiconductor and promising material for the detection of various types of gases. 23–26 M. A. Han et al. reported the effects of porosity and particle size on the gas sensing properties of SnO2 films and it was concluded the porosity increase the sensor response also increases. 27 Another MnO2 widely studied in the field of photocatalytic, supercapacitor, and batteries such as C. H. Tran et al. 28 reported the theoretical and practical approach of MnO2 supercapacitor electrode. S. L. Chiam et al. 29 reported the review on MnO2-based photocatalytic degradation of organic dyes. Very few studies have been reported on the MnO2-based LPG sensor, K. R. Nemade et al. reported MnO2 immobilized graphene nanocomposite for LPG detection. 30 In the present work, we investigate the MnO2–SnO2 nanocomposite for LPG detection at room temperature for below LEL (0.5–2.0 vol%). First time in this study the MnO2–SnO2-based LPG sensors are reported. The MnO2/SnO2 nanocomposite was synthesized by a simple sol-gel method. The maximum sensor response was found as 2.42 for 2.0 vol% LPG at room temperature, whereas at a lower concentration 0.5 vol% sensor response was found as 1.44.
Materials and Method
Required chemicals
Tin chloride dihydrate (SnCl2·2H2O; Mw = 225.65 g l−1) and Manganese chloride dihydrate (MnCl2·2H2O; Mw = 161.87 g l−1) are used as metal precursors, distilled water, and ethanol as a solvent. For the precipitation of the solution sodium hydroxide (NaOH; Mw = 39.997 g l−1) was used. All the required chemicals are purchased from fisher scientific Pvt. Ltd. India and used without additional purification.
Sol-gel synthesis of MnO2-SnO2 nanocomposite
The MnO2-SnO2 nanocomposite was synthesized by a simple sol-gel process. Initially, 0.5 M of SnCl2·2H2O and 0.5 M of MnCl2·2H2O were dissolved in 30 ml distilled water or 30 ml ethanol solution in separate beakers and magnetic starring for 30 min at room temperature. Then the solution of MnCl2·2H2O was added slowly to SnCl2·2H2O solution with continuous vigorous stirring. After that, the aqueous solution of NaOH (0.5 M) was added dropwise to maintain pH 7. Then precipitate was found and kept at ambient temperature for 24 h for aging. The precipitated solution was centrifuged and washed with distilled water followed by ethanol alternatively three times. After that, the precipitate was dried at 70 °C in the oven for 5 h and obtained fine powder. Further, this powder was annealed at 500 °C for 2 h in the furnace.
LPG sensing device fabrication and measurement
The sensing film of MnO2-SnO2 nanocomposite is fabricated by spin coating techniques on the glass substrate (1 × 1 cm2 dimension). Initially, the glass substrate was cleaned with distilled water, ethanol, and acetone by ultrasonication. After that, the glass substrate was dried at 60 °C for 10 min and a homogenous solution of MnO2-SnO2 nanocomposite was dropped on the substrate and spin coating at 1500 rpm for the 60 s. Then it was dried at 60 °C for 10 min and this process was followed three times for acquiring desired thickness and annealed at 350 °C for 1 h. The copper electrode is deposited on the sensing film by silver paste. The gas sensing setup has already been discussed in previously published work. 13,31 The gas sensing setup consists of an inlet and outlet knob and the sensing device is connected through the 6517B electrometer. A hygrometer is kept inside the chamber to measure relative humidity. The LPG cylinder is connected to a mass flow controller to measure the concentration of LPG. The end of the electrometer is connected to the computer system and measures the electrical signal (current and resistance).
The sensor response of a gas sensor is an important parameter that can be defined by the ratio of current in presence of gas toair, whereas the sensitivity can be estimated by the slope of sensor response curve as given by Eqs1 and 2. 32


The response time of a gas sensor is defined as the sensor reaching maximum change in current and becoming constant after the exposure of LPG, the 90% time taken in this process is called response time. Whereas, 90% time required by the sensor to come back to its primary stage is called recovery time.
Characterizations
The characterization of the synthesized material was performed for the analysis of properties such as X-ray Diffraction (XRD; Advanced D8 Eco Bruker) for structural analysis, Dynamic Light Scattering (DLS; Nanozetasizer NSZ90 Malvern) for particle size distribution, surface morphology by Electron Scanning Electron Microscopy (SEM; JSM 6490 LV), Fourier Transform Infrared Spectroscopy (FTIR; Thermo Nicolate 6700) for functional group analysis and optical properties by UV-visible spectroscopy (Thermoscientific Evolution 201).
Results and Discussion
X-ray diffraction
In the XRD pattern of MnO2, the diffraction peaks at the 2θ angles of 18.530°, 36.215°, 43.665°, 48.059°, 58.366°, 63.748°, 67.281°, 75.427°, 76.196°, 80.810°, and 83.665° correspond to the Braggs planes of (111), (311), (400), (331), (511), (440), (531), (533), (622), (444), and (711) as shown in Fig. 1a. From Fig. 1b, in the XRD pattern of SnO2, many peaks are found at the 2θ angles of 26.535°, 33.663°, 37.764°, 51.620°, 54.775°, 57.883°, 61.903°, 64.739°, 65.876°, 71.322°, 78.594°, and 83.704°, which corresponds to the Braggs plane of (110), (101), (200), (211), (200), (002), (310), (112), (301), (302), (321), and (222). The MnO2-SnO2 nanocomposite was analyzed by X-ray diffraction for confirming the crystal nature and the XRD pattern as shown in Fig. 1c. From the XRD analysis, it can be seen that the material is highly crystalline. In the XRD pattern of MnO2-SnO2, a combination of MnO2 and SnO2 peaks are found and well matched with standard JCDPDS#44–0141 (Cubic MnO2) and JCPDS#21–1250 (Tetragonal SnO2). 33,34 The XRD peaks at the 2θ angles of 18.630°, 26.526°, 33.835°, 37.861°, 51.726°, 54.678°, 57.890°, 61.857°, 64.786°, 65.919°, 71.343°, 78.751°, and 83.789° represent the Bragg planes of (111), (110), (101), (001), (211), (411), (220), (310), (112), (203), (013), (321) and (222) respectively. The crystallite size (D) and the induced strain of all samples were calculated by the Williamson-Hall plot. 35

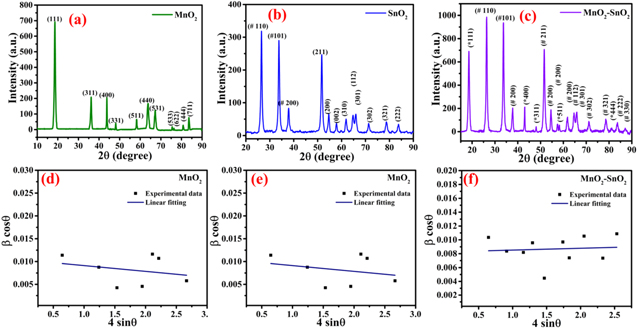
Figure 1. X-ray diffraction pattern of (a) MnO2 (b) SnO2 (c) MnO2-SnO2, Williamson-Hall plot for (d) MnO2 (e) SnO2 (f) MnO2-SnO2 nanocomposite.
Download figure:
Standard image High-resolution imageWhere k is the Scherrer constant, λ is the wavelength of the X-ray source (Cu Kα; α = 0.15406 nm), β is the full width and half maxima (FWHM), ε is the induced strain, and θ is the Braggs angle. From the Williamson-Hall plot, the crystallite size and induced strain were calculated. The crystallite size was calculated by the intercept of the linear fitting of the graph plotted between 4×Sinθ and β×Cosθ along the x and y-axis, respectively whereas the induced strain was calculated by the slope of the graph. The observed crystallite size for the samples was found to be 13.306 nm, 13.344 nm, and 16.786 nm for the samples SnO2, MnO2, and MnO2–SnO2 as shown in Figs. 1d–1f respectively. The induced strain of the samples SnO2, MnO2, and MnO2–SnO2 was found to be 5.499 × 10⁻⁴, 1.270 × 10⁻³, and 2.627 × 10⁻⁴. The lattice constant and volume can be calculated using the following relations:  andV =
  for cubic structure MnO2 whereas
  and V =
  for tetragonal structure (SnO2). The interplanar distance of pure MnO2 and SnO2 were found to be 4.784 Å and 3.356 Å, respectively corresponding to (111) and (110) diffraction planes.
36
In the MnO2-SnO2 composite the interplanar distance of MnO2 and SnO2 were found to be 4.771 Å and 3.358 Å structures. The dislocation density calculates using the formula:
for tetragonal structure (SnO2). The interplanar distance of pure MnO2 and SnO2 were found to be 4.784 Å and 3.356 Å, respectively corresponding to (111) and (110) diffraction planes.
36
In the MnO2-SnO2 composite the interplanar distance of MnO2 and SnO2 were found to be 4.771 Å and 3.358 Å structures. The dislocation density calculates using the formula:  (nm−2), the calculated structural parameters are depicted in Table I.
Table I. Structural parameters of MnO2, SnO2, and MnO2-SnO2 nanocomposite.
| Parameters | MnO2 | SnO2 | MnO2-SnO2 composites | |
|---|---|---|---|---|
| MnO2 | SnO2 | |||
 (Å) (Å) | 8.286 | 4.746 | 8.284 | 4.748 |
| b (Å) | 8.286 | 4.746 | 8.284 | 4.748 |
| c (Å) | 8.286 | 3.212 | 8.284 | 3.188 |
| Volume (Å)3 | 568.898 | 72.348 | 568.486 | 71.880 |
| d (Å) | 4.784 | 3.356 | 4.771 | 3.358 |
| Dislocation density (δ) × 10−3 (nm−2) | 5.616 | 5.648 | 3.54 | |
| Lattice strain (ε) × 10−3 | 1.27 | 0.549 | 0.262 | |
Scanning electron microscopy
The surface morphological investigations of all samples were carried out by using scanning electron microscopy. From Fig. 2a, SEM images of MnO2 exhibited bunch-like coagulated nanostructures. SEM image of the SnO2 nanomaterial shows the bunch of the small spheres collected such as shown in Fig. 2c. Fig. 2d the SEM image of MnO2-SnO2 depicts the bunches of the nanoparticles at the scale of 5 μm with the resolution of ×3000, whereas Fig. 2e is presented at the scale of 2 μm. Fig. 2f shows the comprehensive morphologies of the SnO2 nano spheres and nanorods with brush-like aggregates with hemispherical ends projecting out. From the SEM images, it can also be observed that the particles were agglomerated. The agglomeration effect depends on the size of the particles such as particle's size moving towards the nanoscale, the agglomeration gets increased. The EDS spectra of the MnO2 and SnO2 are presented in Figs. 2g and 2h respectively, show the presence of all elements according to their content. The presence of the Pt element is due to the coating in process of imaging. In Fig. 2i, the energy dispersive X-ray (EDS) spectrum of MnO2-SnO2 shows that the sample contains the Mn, Sn, and O elements, and no other peaks are observed, which suggests the clear formation of the pure MnO2-SnO2 material. EDS spectrum has shown the presence of atomic weight percent of Sn with 7.55%, Mn with 6.37%, and O with 86.08%.
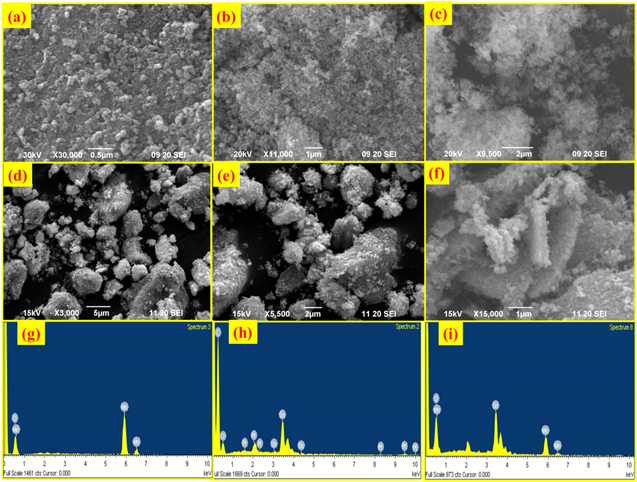
Figure 2. SEM micrographs of MnO2 at scales of (a) 0.5 μm (b) 1 μm, SEM micrographs of SnO2 at scale of (c) 2 μm, SEM micrographs of MnO2-SnO2 at scale of (d) 5 μm (e) 2 μm (f) 1 μm, Energy dispersive spectrum of (g) MnO2 (h) SnO2 (i) MnO2-SnO2.
Download figure:
Standard image High-resolution imageUV-visible spectroscopy analysis
The UV-visible absorption technique is very useful to analyze the optical properties of any material. For analysis of the optical properties of the material UV-visible absorbance spectrum was recorded from 250–900 nm as shown in Figs. 3a–3c. The optical bandgap of the as-prepared material was calculated by the Tauc's plot such as given in the relation Eq. 4. 37

Where K is the constant, v is transition frequency, and n defines the nature of transition such as for n = 1/2 and 3/2 corresponds to the direct allowed and direct forbidden transition, whereas n = 2 and 3 corresponds to the indirect allowed and indirect forbidden transition respectively. Here, a transition is direct allowed. The observed direct optical band gaps of MnO2 and SnO2 were found to be 3.407 eV and 3.037 eV respectively, whereas for MnO2–SnO2 nanocomposite, the band gap was found to be 3.202 eV. The observed band bap of the nanocomposite lies in the mid of both of its constituents, which signifies the band bending near the band edges.

Figure 3. UV-visible absorbance spectrum of (a) MnO2 (b) SnO2 (c) MnO2–SnO2 with Tauc's plot (inset), FTIR spectrum of (d) MnO2 (e) SnO2 (f) MnO2–SnO2.
Download figure:
Standard image High-resolution imageFTIR analysis
For confirming the functional groups associated with the as-prepared material, FTIR spectroscopy was used in the range of 4000–400 cm−1 as shown in Figs. 3d–3f. From Fig. 3d, it can be observed that the stretching vibration of the Mn–O mode occurred at the wavenumber of 528.11 cm−1, whereas Sn–O stretching vibration (Fig. 3e) was found at 615.53 cm−1. In the FTIR spectrum of MnO2–SnO2, the peak at the wavenumber of 3403.74 cm−1 represents the -OH stretching vibrations which is due to atmospheric humidity adsorbed on the surface of the nanocomposite. 26 Another peak at the wavenumber of 1627.62 cm−1 attributed to the C=O due to atmospheric CO2 molecules. The peak at the wavenumber of 1155.15 cm−1 represents the existence of some hydrates in the material. The peaks at the wavenumber of 615.18 and 528.39 cm−1 are accredited to the vibration stretching of the Sn–O, and Mn–O vibrations respectively.
Sensing Performance Analysis of the Device
The comparative LPG sensing of MnO2, SnO2, and MnO2-SnO2 nanocomposite
The LPG sensor works on the surface adsorption/desorption phenomenon in which the LPG interacts with the sensing surface. For the measurement of LPG sensing the device is fabricated by the drop cast method. The change in current/resistance was measured by Keithley electrometer 6517B. The sensing setup used was reported in previous work. 13 Generally, LPG consists of propane and butane and show a reducing nature which donates electron after the interaction. Before the measurement of LPG, the sensing device keeps in the ambient atmosphere for 24 for proper saturation.
Initially, the comparative LPG sensing of MnO2, SnO2, and MnO2–SnO2 nanocomposite film was performed at room temperature (32 °C and 60%RH) for 0.5 and 2.0 vol%, respectively. The LPG characteristics curve of MnO2, SnO2, and MnO2–SnO2 nanocomposite for 0.5 and 2.0 vol% LPG are shown in Figs. 4a–4c. The sensor response of MnO2, SnO2, and MnO2–SnO2 nanocomposite was calculated by using Eq. 1 for 0.5 and 2.0 vol% respectively, and the histogram is shown in Fig. 4d. For lower concentrations 0.5 vol%, the sensor responses of MnO2, SnO2, and MnO2–SnO2 were found to 1.058, 1.095, and 1.44 respectively whereas for higher concentrations these were found to be 1.321, 1.380, and 2.420 respectively. The LPG sensing behaviour of MnO2–SnO2 nanocomposite was found better in comparison to pure SnO2 and MnO2.
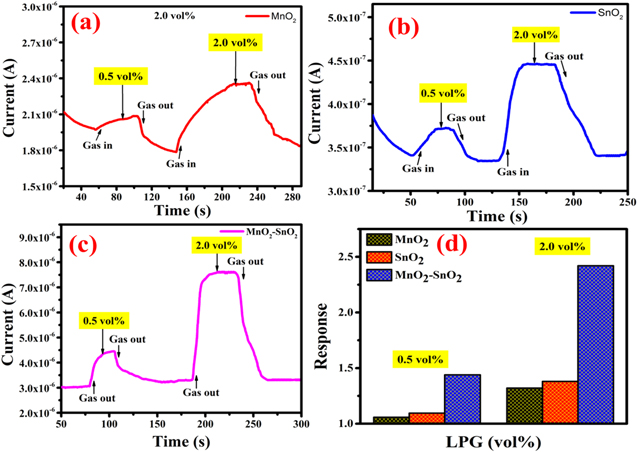
Figure 4. LPG sensing with time for 0.5 vol% and 2.0 vol%; (a) pure MnO2, (b) pure SnO2, (c) MnO2–SnO2 nanocomposite, and (d) Sensor response curve.
Download figure:
Standard image High-resolution imageLPG sensing of MnO2–SnO2 nanocomposite sensing film
Further, the LPG sensing characteristics of MnO2–SnO2 nanocomposites performed at RT for below LEL 0.5, 1.0, 1.5, and 2.0 vol% with time as shown in Fig. 5a. Initially, the current of sensing film in the air was saturated at 3.069 μm whereas in 0.5 vol% LPG the current suddenly increased around 4.45 μm. Because of this, LPG is a reducing gas and after the interaction current increases. The sensor response for each cycle is calculated by using Eq. 1 and plots the graph between sensor response and LPG concentration. For the lower concentration of 0.5 vol% of LPG, the sensing curve depict in Fig. 5b, in which the sensor response was found to be 1.44. Similar to other concentrations the sensor response was calculated. The maximum sensor response of MnO2–SnO2 nanocomposite film was found to be 2.42 for 2.0 vol%. The sensor response curve with LPG concentration is represented in Fig. 5c. The slope of linear fit data gave the values of sensitivity which is 0.646 sensor response/vol% of the sensing device. Additionally, the R2 factor was found to be 0.99% which suggests that the device is properly working below LEL.
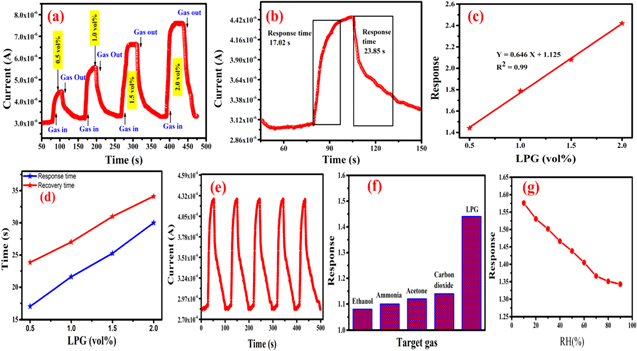
Figure 5. (a) Gas sensing characteristics with respect to time (b) Transit LPG sensing with time for 0.5 vol% (c) Sensor response with concentration of LPG (d) Response and recovery times curve with LPG concentration (e) Repeatability curve at 0.5 vol% of LPG, (f) Selectivity of the sensing device and (g) Effect of humidity on LPG sensing performance.
Download figure:
Standard image High-resolution imageThe response and recovery time were calculated and mentioned in Table II. For the lowest concentration 0.5 vol%, the response and recovery time calculated as shown in Fig. 5b are found to be 17.02 and 23.85 s respectively. The comparative work reported on nanostructured-based LPG sensors are presented in Table III. The repeatability of MnO2–SnO2 sensing film was performed after 4 weeks for 0.5 vol% of LPG and found to 98.36% repeatable with the same result. The reproducibility curve of LPG sensing is represented by five consecutive cycles of LPG sensing as shown in Fig. 5e. The sensing film was found to have a 1.64% error because the atmospheric humidity will affect the sensing film. Another, the selectivity of a sensor is also a vital parameter that represents the ability of the sensing device for a particular gas.
Table II. LPG sensing device parameters.
| LPG (vol%) | Sensor response | Response time (s) | Recovery time (s) |
|---|---|---|---|
| 0.5 | 1.44 | 17.02 | 23.85 |
| 1.0 | 1.79 | 21.62 | 27.01 |
| 1.5 | 2.08 | 25.26 | 30.98 |
| 2.0 | 2.42 | 30.03 | 34.12 |
Table III. The different types of nanostructured materials-based LPG sensors.
| Materials | Synthesis method | LPG | Opt. tamp. | Response (%) | Res./Rec. Time (s) | References |
|---|---|---|---|---|---|---|
| Bi2SiO5/MWCNT | Hydrothermal | 1500 ppm | RT | 77.71 | 21/37 | 21 |
| PPy/Nb2O5 | Polymerization | 800 ppm | RT | 38.13 | 75/98 | 38 |
| Sm3+−doped LaAlO3 | Combustion technique | 1000 ppm | RT | 87 | 127.2/205.2 | 39 |
| n-CdO/p-PbS | Wet chemical | 1176 ppm | RT | 51.10 | 148/142 | 40 |
| MgO–CeO2 | Hydrothermal | 900 ppm | RT | 32 | 32 | 41 |
| PVA/SnO2 | Spin coating | 100 ppm | RT | 79 | 25/30 | 42 |
| ZnGa2O4/Graphene | Hydrothermal | 1000 ppm | RT | 56 | 32/45 | 43 |
| MnO2-SnO2 | Sol-gel | 0.5 vol% | RT | 44 | 17.02/23.85 | Present work |
| 2.0 vol% | RT | 142 | 30.03/34.12 |
In this work, selectivity of the MnO2–SnO2 nanocomposite sensing film was performed using various gases such as ethanol, acetone, ammonia, and CO2 for the same concentration (0.5 vol%) and operating temperature. The selectivity histogram is shown in Fig. 5f. The sensor response of sensing film in presence of ethanol, ammonia, acetone, CO2, and LPG was found as 1.08, 1.10 1.12, 1.13, and 1.44 respectively. The MnO2–SnO2 nanocomposite sensing film is highly sensitive to LPG in comparison to other gases.
The effect of humidity on the RT-operated gas sensor is an important issue because according to climate the humidity will be changed so the detection of LPG in presence of rhumidity was carried out. 44,45 For this, relative humidity inside the chamber was increased from 10% to 90% using humidifier (K2SO4 solution). 46 Fig. 5g shows the response curve of MnO2–SnO2 thin film for 0.5 vol% of LPG in presence of relative humidity (10%–90%). At the lower humidity range (10%–30%) the sensor response is high and in the mid-range (30%–60%) minute changes are observed, whereas in the higher humidity range (60%–90%) the sensor response is very low. Because at higher humidity the physisorption is saturated and found low sensor response. Hence, the MnO2–SnO2 nanocomposite sensing film is good for the detection of LPG in the mid-range.
LPG sensing mechanism of MnO2-SnO2 nanocomposite
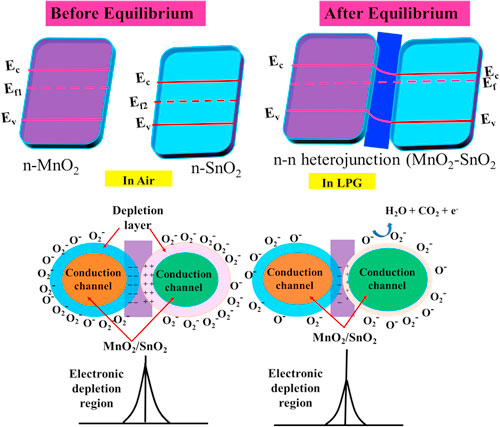
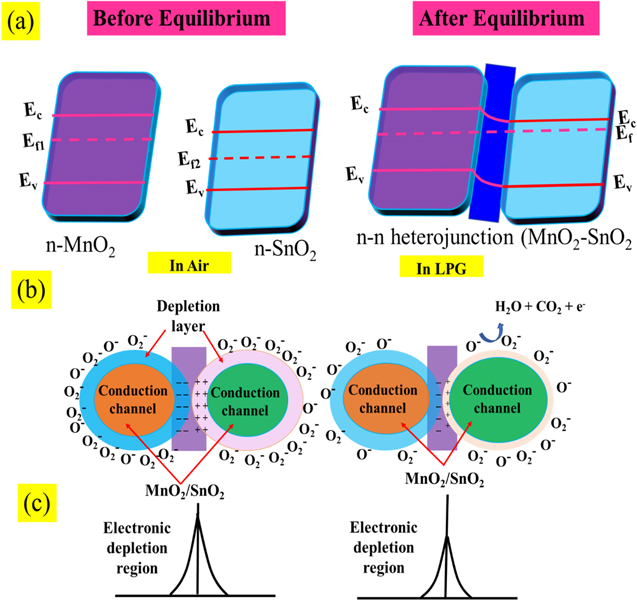
Mostly, the LPG sensing mechanism of metal oxide semiconducting materials is described by the adsorption/desorption surface phenomena. 47 Due to the adsorption/desorption of analytes, the resistance or current of sensing film may be increased or decreased depending upon the type (n or p) of materials and target gas (reducing or oxidizing). 48,49 In the present study, MnO2 and SnO2 are n-type semiconductors and formed n–n heterojunction. From UV spectrum, we have calculated the bandgap of SnO2 and MnO2 as 3.03 and 3.40 eV respectively. The low bandgap materials (SnO2) have more electron density in comparison to high bandgap materials (MnO2). From the conduction of low bandgap materials, the electrons move towards the conduction band of high bandgap materials, whereas the holes are migrated to the opposite. Due to the movement of electrons and holes, the band is shifted to its own position and the Fermi level is equilibrated and creating an electronic depletion layer at the interface of both semiconductors. Fig. 6a shows the band bending diagram before and after equilibrium of Fermi level and formation of n–n heterojunction. This junction is responsible for the adsorption/desorption of oxygen air and LPG. The sensing mechanism of MnO2–SnO2 nanocomposite thin film is shown in Fig. 6b. Earlier to exposure of LPG, environmental oxygen become adsorbed on the surface of the sensing film, electrons are trapped from the conduction band and oxygen species (O2 −, O−, and O2−) are formed, which can be explained as the following reactions (Eqns. 5, 6 and 7): 50,51


Figure 6. Schematic band bending diagram of MnO2–SnO2 nanocomposite and LPG sensing mechanism.
Download figure:
Standard image High-resolution image
Due to the formation of oxygen ions on the surface of sensing film, the electronic depletion layer is formed which creates a depletion region and acts as a potential barrier. So, the current of sensing film was decreased and saturation after the adsorption of oxygen molecules. After that, the LPG was exposed inside the chamber, it interacted with chemisorbed oxygen species and formed an intermediate complex (CnH2n:O) with releasing the electrons. Chemical reactions can be represented by Eqs. 8 and 9.


where n = 3 and 4. This intermediate complex is highly unstable and interacts with oxygen species (O−) and releases CO2 and H2O contents in the end product through the dehydrogenation mechanism. The electron density in the conduction band is increased, so the current is increased in presence of LPG as shown in Fig. 6a. When the concentration of LPG increases then the reaction rate increases, further as a result, the current has increased and becomes constant.
Conclusions
The MnO2–SnO2 nanocomposite was synthesized by the cost-effective sol-gel method and the sensing film was fabricated by the drop cast method. The XRD analysis confirmed the existence of MnO2 (cubic) and SnO2 (tetragonal) phases and the average crystallite size was found as 16.204 nm. The SEM analysis showed the bush-like aggregates in which nanospheres of SnO2 were found decorated on the nanorod-like surface. The direct optical band was found to be 4.08 eV from UV-visible spectroscopy and the functional group Mn–O and Sn–O are coexisting in the sample. The LPG sensing was carried out at room temperature towards 0.5–2.0 vol%, for the lower concentration of 0.5 vol% of LPG the sensor response was found to be 1.44 with response time 17.02 s and recovery time 23.85 s. Whereas at 2.0 vol%, the sensor response was 2.42 with 30.03 s/34.12 s response and recovery time, respectively. So, the MnO2–SnO2 nanocomposite is good for below LEL (0.5–2.0 vol%) concentration of LPG.
Acknowledgments
Mr. Ajeet Singh is thankful to the Council of Scientific & Industrial Research and University Grant Commission (CSIR-UGC), Government of India for financial support in the form of Senior Research Fellowship (F. No16–9(June 2017)/2018 NET/CSIR). Mr. Arpit Verma acknowledges to Uttar Pradesh Council of Science and Technology, Lucknow for financial assistance in the form of Project Ref: CST/D-2290. Authors are also thankful to USIC, Babasaheb Bhimrao Ambedkar University Lucknow for providing characterization facilities.