
Abstract
Herein, we offer the study on the conductive polymer of polypyrrole and iron oxide (Fe2O3@PPy) nanocomposites, which are prepared via a simple chemical oxidation method for energy storage applications. The synthesized nanocomposites are confirmed by the physico-chemical properties through Fourier Transform Infra-red Spectroscopy (FTIR), X-ray Diffraction (XRD), Scanning Electron Microscopy (SEM), Transmission Electron Microscopy (TEM) and X-ray Photoelectron Spectroscopy (XPS) results along with Electrochemical Impedance Spectroscopy (EIS), Cyclic Voltammetry (CV), Galvanostatic Charge–Discharge (GCD) and stability analyses. The surface morphological studies of SEM and high TEM images substantiated the formation of Fe2O3@PPy nanocomposite via the polymerization process. The prepared Fe2O3@PPy nanocomposites deliver at a specific capacity of 395.45 C g−1 at 5 mV s−1 scan rate. Moreover, Fe2O3@PPy nanocomposite shows outstanding cycling stability of capacity 94.3% even after 10000 cycles of charge-discharge at the highest current density value of 10 A g−1. The remarkable electrochemical energy storage manner of as-synthesized Fe2O3@PPy nanocomposite is considered a potential electrode for supercapacitor application. The higher electrochemical performance of this Fe2O3@PPy nanocomposite it's suitable for numerous applications like batteries, sensors, photocatalysts, solar cells and commercial requirements.
Export citation and abstract BibTeX RIS

This is an open access article distributed under the terms of the Creative Commons Attribution 4.0 License (CC BY, http://creativecommons.org/licenses/by/4.0/), which permits unrestricted reuse of the work in any medium, provided the original work is properly cited.
Traditionally, electrochemical energy (charge) storage devices are having large cycle life and high power density such as supercapacitors and rechargeable batteries. 1–3 These devices deal with a fascinating in addition to technologically pertinent conciliation as regards high energy density than the conventional capacitors and higher power density than the batteries for the purpose of electrical adhesion applications. 4–6 In recent decades, polythiophene, polyaniline, polypyrrole and their by-products have revealed excessive potential fashionable technological applications in the name of organic conducting polymers. In the ease of synthesis, chemically tunable properties, light weight and good environmental stability create them beneficial in electromechanical, optoelectronic as well as electronic devices. 7–9 Polypyrrole is widely used as one of the conducting polymers in sensor applications for the reason of their selectivity towards various target gases, high sensitivity and room temperature maneuver. 10–12 Moreover, the pyrrole (monomer) can be definitely water soluble and oxidized. 10,11 On the other hand, some of the hitches by means of polypyrrole are their limited mechanical strength, lack of specificity and solubility. 13,14 In recent times, metal-oxide of inorganic semiconductors, such as ZnO, 15 SnO2, 16 WO3, 17 and Fe2O3 18 etc, has been comprehensively considered for gas sensor development as their detecting capability of numerous toxic gases in different conditions. 19
Fe2O3 has been established and selected as an attractive anode material because of its case of fabrication, low toxicity, low cost and high theoretical capacity. 20 On the other hand, iron oxide continuously agonizes since deprived cycle ability is produced by radical volume alteration in the course of the integration and disintegration process of lithium-ion. Numerous methodologies have been anticipated to increase rate and energy capacity, for instance, nanomaterials devising Fe2O3 from enhanced nanostructure to form hybrid nanostructure like nanotubes, 21 branches nanostructure, 22 nanoflakes, 23 carbon nanotubes embed the active materials in a moderating medium, 24 graphene 25 and carbon fibers/conducting polymers 26 etc. More than a few hybrid nanostructures of carbon/Fe2O3 have been considered in addition to improvements in the rate of charge and discharge characteristics.
Nanocomposites and Nanostructures are the most important dualistic main determinations that have been occupied so as to discourse the several complications related to pure Fe2O3 27 and PPy. 28 Combining the properties of the inorganic nano Fe2O3 and organic PPy will support to the peer group of the novel course of materials by means of enriched properties besides that can overcome the disadvantages approaching. Since the distinct equivalents in addition to that improve the chemical and physical properties of materials. 29,30 Hence, there are limited publications on iron oxide/polymer composite for supercapacitor applications. Recently, Raj et al. prepared the Fe2O3-decorated N-doped CNT porous composites derived from tubular polypyrrole for high-performance supercapacitor applications. The nanocomposite electrode material showed 264 F g−1 of specific capacitance with 84% of cyclic performance. Similarly, Chen et al. synthesized the tetsubo-like α-Fe2O3/C nanoarrays on carbon cloth as negative electrodes for high-performance energy storage applications. The novel electrode delivered the highest specific capacitance of 430.8 F g−1 with 73.2% of cyclic retention. Mallouki. M et al. introduced the electrochemical charge storage behavior of polypyrrole–Fe2O3 nanocomposites for supercapacitor applications. The superior nanocomposite electrode material delivered a good specific capacitance of 210 F g−1 along with 80% of stability performance. The importance of the existing work is to formulate exceptional electrode materials using an instantaneous combination of high power supply, better cycling stability and large specific capacitance. In this esteem, PPy/Fe2O3 nanocomposite electrode is established in a 3 M KOH solution for characterizing the supercapacitor properties. The outcomes were found to demonstrate that PPy/Fe2O3 nanocomposite contributed better supercapacitor properties than the individual PPy and Fe2O3. The novelty of the research work, is to enhance the electrical conductivity of the Fe2O3@PPy nanocomposite to attain higher electrochemical performance (specific capacity, rate capability and cycle performance) for energy storage applications.
Table I. Chemical concentration of PPy, Fe2O3 and Fe2O3/PPy nanocomposite.
| S. No | Materials | Concentration |
|---|---|---|
| 1 | Polypyrrole | Pyrrole: 1 M |
| H2SO4: 1 M | ||
| K2Cr2O7: 0.5 M | ||
| 2 | Fe2O3 | FeCl36H2O:0.1 M |
| NH3OH (1 M) Adjusted | ||
| PH value | ||
| Up to 11 | ||
| 3 | PPY/Fe2O3 | Pyrrole: 1 M |
| H2: 1 M | ||
| K2Cr2O7: 0.5 M | ||
| Fe2O3: 1g |
Table II. Surface area and pore size analysis of Fe2O3 and Fe2O3/PPy nanocomposite.
| S. No | Name of the samples | Specific area(m2g−1) | Pore volume (cc g−1) | Pore size (nm) |
|---|---|---|---|---|
| 1 | Fe2O3 | 18.066 | 0.081 | 1.927 |
| 2 | Fe2O3/PPy | 141.493 | 0.347 | 10.447 |
Table III. Comparison results of previously published articles.
| S. No | Materials | Potential (V) | Specific capacitance (Fg−1) | Stability (%) | Count of cycles | References |
|---|---|---|---|---|---|---|
| 1 | PPy@Fe2O3(180 °C) | −8 to 0.0 | 560 | 97.3 | 20000 | 31 |
| 2 | Fe2O3 NTS@PPY/CC | 0.0 to 2.0 | 237 | 80 | 10000 | 32 |
| 3 | Fe2O3/N-CNT | 0.0 to 0.6 | 264 | 84 | 10000 | 33 |
| 4 | PPy@Fe2O3@SSy | 0.0 to 0.8 | 667.8 | 87.5 | 10000 | 34 |
| 5 | α Fe2O3/C | −1.0 to 0.0 | 430.8 & 391.8 | 73.2 | 4000 | 35 |
| 6 | α Fe2O3 (Fe2O3−Vo) | −1 to 0 | 862.12 | 75.45 | 2500 | 36 |
| 7 | PPY/Fe2O3 | −1 to 0.5 | 210 and 190 | 80 | 1000 | 37 |
| 8 | Fe2O3/CNT | −1 to 0 | 300 | 90 | 1000 | |
| 9 | Fe2O3/AC Composites | −1 to 0.0 | 215 | 89.3 | 1000 | 38 |
| 10 | Fe2O3/GA | −0.8 to 0.8 | 81.3 and 67.5 | — | — | 39 |
| 11 | LCNFs/PPY | 0.0 to 1.0 | 213.7 | 70 | 1000 | 40 |
| 12 | α Fe2O3/rGO | −1 to 0.2 | 174 | 75 | 11000 | 41 |
| 13 | α Fe2O3/MnO3O4 | −0.2 to 1.0 | 205 | 89.1 | 2000 | 42 |
| 14 | PPY/(H Gel/As) | 0.0 to 0.8 | 75 | 98 | 5000 | 43 |
| 15 | PPY/Rgo/Fe2o3 | −0.4 to 0.4 | 102.2 | 81.3 | 200 | 44 |
| 16 | Fe2O3/NCWS/CFS | 0.0 to 2.0 | 102.4 and 125.7 | 81.2 | 2000 | 45 |
| 17 | α Fe2O3@MPC-Chit | −0.8 to 0.0 | 380 | 90 | 2000 | 46 |
| 18 | Fe2O3/CNT | 0.0 to 0.8 | 16 | — | 1000 | 47 |
| 19 | Fe2O3@CF | 1 to 1.8 | 93,5 | 91.3 | 5000 | 48 |
| 20 | CNT@Fe2O3 | −1 to 0 | 300 | 70 | 1000 | |
| 21 | Fe2O3@Ag | −1 to 0 | 123 | 72 | 2000 | 49 |
| 22 | ϒ Fe2O3@Ag | −1 to 0.0 | 220.2 | 90.7 | 8000 | 50 |
| 23 | PPY@ Fe2O3 | 0.0 to 0.4 | 395.45 | 98 | 10000 | Our work |
Materials and Method
Preparation of polypyrrole
6.7 ml pyrrole (monomer) added dropwise slowly with 100 ml distilled water on the magnetic stirrer with continuous rotation for one hour. After that, the 9.8 ml H2SO4 was added dropwise slowly with a continuous rotating magnetic stirrer for one hour. Then 20 ml distilled water with added slowly to 2.8 g of K2Cr2O7 with a continuous rotation using with magnetic stirrer up to reach the saturated state. Hence K2Cr2O7 solution with slowly added to the pyrrole solution. The stirring process was held continuously overnight (24 h). These whole processes are carried out within the ice path and its atmosphere. Finally, the resultant polypyrrole centrifuged methods after 24 h on the magnetic stirrer and Oven at 80 °C for 12 h.
Preparation of Fe2O3
The FeCl3.6H2O is diluted in 200 ml distilled water and stirred for 30 min at 80 °C. After that, NH3OH was added dropwise slowly reaching the pH value up to 11 and thus the solution was stirred for 2 h at 80 °C. These whole processes are carried out within the ice path and its atmosphere. The resultant dried for 12 h at 80 °C in a hot air oven after the centrifuge method to obtain the Fe2O3.
Preparation of PPy+Fe2O3 nanocomposite
One gram of Fe2O3 is added to the mixture of 100 ml distilled water and add dropwise 9.8 ml H2SO4 within the solution. Hence continuous stirrer 10 min after that addition of 6.7 ml (monomer) of pyrrole adds to the solution and continuous stirrer in one hour. K2Cr2O7 (2.8 g) in 20 ml distilled water dilute and stirrer under ice path set up for one hour leads to Fe2O3+PPy to get 3.2 g of yield. (Fig. 1 shows the Overall Schematic Diagram for PPy/Fe2O3 nanocomposites Sample Preparation). Table I. Shows the chemical concentration of Ppy, Fe2O3 and Ppy@Fe2O3 nanocomposites.
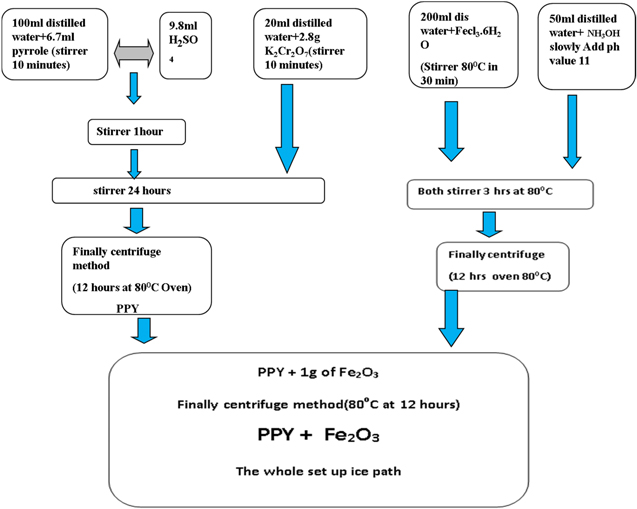
Figure 1. Schematic Diagram for Fe2O3@PPy nanocomposites.
Download figure:
Standard image High-resolution imageCharacterization techniques
The crystal nature, morphological and elemental properties of the as-prepared samples are explored through X-ray diffraction (XRD, Rigaku D/Max Ultima III), Fourier transform Infra-red spectroscopy (FTIR, SHIMADZU, IRTRACER 100), Field emission-scanning electron microscopy (JSM-7500F), Transmission electron microscopy (TEM, Hitachi H-600) and Energy dispersive X-ray spectroscopy analysis (JSM-7500F). Further, the chemical composition of the as-prepared sample was assessed through X-ray Photoelectron spectroscopy (XPS, ESCA 3400 spectrometer). All electrochemical characterization like CV, GCD and EIS has been carried out using with SP-150, Biologic Science Instruments, and France). The working electrode slurry paste was prepared through 80:10:10 of active material: carbon black: PVDP are mixed with NMP solution. The as-prepared slurry was pasted on Ni-Foam (1*3 cm2) and an dried in electric oven. Herein, 3 M KOH electrolyte was used to analyze the electrochemical performance of the as-prepared working electrode. The measurements were recorded for their respective conditions. The specific capacitance was evaluated from CV and GCD curves for several current densities according to the following Eqs. 1 and 2,


Herein,  is the integral area of the CV curve, s is the scan rate (V s−1), i is the current (A), Δt is the discharging time (sec), m is the loading mass (g) on the electrode surface, and ΔV is the applied potential window (V).
Physico-Chemical Characterization Techniques
FTIR analysis
Figure 2 depicts the elemental vibrational modes of PPy, Fe2O3, and PPy/Fe2O3 nanocomposites studied using FTIR spectroscopy. The peaks of the monomer component of PPy were detected at 792 cm−1 and 926 cm−1, and these peaks are associated with the C–H wagging. The distinctive function peak at 1049 cm−1 is due to C–H in plane deformation vibration, whereas the usual peak seen at 1114 cm−1 is related to C–H out-of-plane deformations. N–C and C–H stretching vibrations occurred at 1305 and 1204 cm−1, respectively.
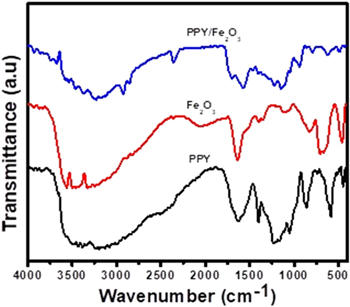
Figure 2. FTIR spectra of pure PPy, pure Fe2O3 and Fe2O3@PPy nanocomposite.
Download figure:
Standard image High-resolution imageThe stretching vibration of the pyrrole ring and the monomer (pyrrole) ring are sensed at 1474 cm−1 and 1559 cm−1, respectively. The N–H stretching and C–N stretching vibrations are responsible for the peaks at 3117 cm−1 and 1684 cm−1. The observation of all distinctive peaks confirms the synthesis of PPy by its components. The Fe–O vibration modes are responsible for the peaks in the Fe2O3 spectra at 1023 cm−1 and 679 cm−1. Peaks in O–H bending vibrations were found at 1416 cm-1 and 567 cm−1. In the spectrum of Fe2O3@PPy (Fig. 2), the peak at 3436 cm−1 is due to the −OH group, while the three characteristic peaks of PPy shifted near higher wave numbers specify the interactions between PPy and Fe2O3. Peaks at 554 and 680 cm−1 in the PPy/Fe2O3 nanocomposite spectrum are attributable to Fe–O bond stretching, confirming the existence of Fe2O3 in the nanocomposite. The exclusion of peaks 620 cm−1, 792 cm−1, 1049 cm−1, and 1305 cm−1 for polypyrrol and 790 cm−1, and 1689 cm−1 for Fe2O3 in the Fe2O3@PPy spectrum, as well as the presence of some new peaks such as 930 cm−1, 1116 cm−1, 1563 cm−1, and 2925 cm−1, confirms the formation of chemical composition to establish a Fe2O3@PPy nanocomposites.
X-ray diffraction studies
X-ray diffraction study majorly used for analyzing the amorphous 51 and crystalline structure of the prepared samples to confirm its diffraction performance for the pure PPy, Fe2O3 and Fe2O3@PPy composites towards the complex formation confirmation. Figure 3 shows the XRD profile for prepared pure PPy, Fe2O3, and Fe2O3@PPy nanocomposites. The diffraction (2θ) peak broadly identified between 10°–30° has previously been reported as nearly 2θ between 20°–28° by A. Kassim et al. and resembles the characteristic peak of pure PPy. 52 Which is clearly confirms the pure polypyrrol (Fig. 3a) in the nature of amorphous without any further crystalline peaks. Figure 3b shows the some crystalline peaks for pure Fe2O3, As per the observation of the JCPDS data Card no. 13–534, the diffraction peaks are shifted from the original value of Fe2O3 such as (102), (110), (113), (024) and (116) planes of Fe2O3 at 2θ = 27.98°, 38.54°, 41.40°, 47.72°, and 57.81° respectively.
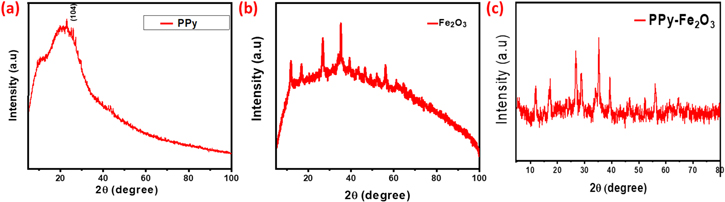
Figure 3. X-Ray Diffraction patterns for the pure (a) PPy, (b)Fe2O3 and (c) Fe2O3@PPy nanocomposites.
Download figure:
Standard image High-resolution imageThe appearance of the broad peak occurred in Fig. 3c for the diffraction of PPy/Fe2O3 nanocomposites. Thus similar to pure PPy without any Fe2O3 crystalline peaks, which means the Fe2O3 completely mixed with polymer and that the absences of crystalline peaks in Fe2O3@PPy nanocomposites confirm the complex formation between the PPy and Fe2O3.
Scanning electron microscopy (SEM) and EDAX analysis
Figures 4 and 5 show scanning electron micrographs and EDAX images of PPy, Fe2O3, and Fe2O3@PPy nanocomposite films at different magnification. Figure 4 depicts the structure of a polypyrrole thin film (a). The PPy film has a high porosity and a homogenous granular spherical shape. Figure 4 depicts a well-defined linked hexagonal nanocrystalline morphology of Fe2O3 (b). Every Fe2O3 nanoparticle is totally covered by PPy in the SEM micrograph of the Fe2O3@PPy hybrid nanocomposite [Fig. 4c]. Because of the availability of diffusion channels within the polymeric network, the introduction of Fe2O3 nanoparticles into the polymeric network provides some porosity and is favorable for electrochemical applications. This is because conduction happens more easily in porous structures, increasing the charge-discharge between the anode and the cathode.

Figure 4. (a)–(c) Scanning electron micrographs of PPy (a1-a3), Fe2O3 (b1-b3) and Fe2O3@PPy (c1-c3). Figure (d). The sum spectrum of Energy dispersive X-ray (EDX) and elemental surface trace for Fe2O3@PPy nanocomposite.
Download figure:
Standard image High-resolution imageThe uniform surface morphology of Fe2O3@PPy through the scanning electron microscope with an energy dispersive X-ray (EDAX) profile given in Fig. 4 for prepared nanocomposites (Fe2O3@PPy). The traced elements are dispersed as 58% (C K), 28% (O K), 7% (N K) and 7% (Fe K) in prepared Fe2O3@PPy composites sample. Significant volume of carbon was perceived for PPy/Fe2O3 as homogenously distributed throughout the entire surface of Fe2O3@PPy. 53 The detector region of interest (ROI) observed as follows 11 (Carbon), 10 (Oxygen), and 6 (Nitrogen and Iron), which is confirm the presence of PPy and Fe2O3 in a uniform manner on the surface to create a porous nature of structural morphology to enhance the electrical properties.
TEM analysis
Figures 5a–5d shows the trace of the Transmission Electron Microscope image for PPy/Fe2O3 nanocomposites. It is perceived that the black shade of Fe2O3 nanocomposites is captured into the light shade space of PPy surfaces with a regular diameter of 100–200 nm. It is confirmation of the nanocomposites in the range of nanoscale besides confirm the binding energies for the formation of Fe2O3@PPy nanocomposites. The different magnification of TEM micrographs for Fe2O3@PPy nanocomposites shows with a the clear shape and little aggregation. Simultaneously, TEM also exhibited that Fe2O3@PPy occurred in the range of nanometer scale with the sample was in the nature of crystalline. The presence of Fe2O3 trapped particles observed with the black shades and the TEM images indicate the presence of polymer chain with the light shade.
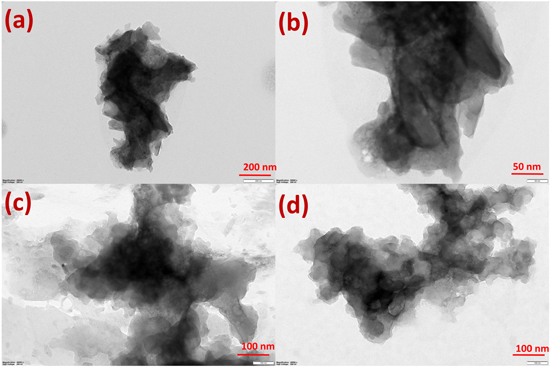
Figure 5. TEM images of Fe2O3@PPy nanocomposite.
Download figure:
Standard image High-resolution imageXPS analysis
The XPS is used to determine the valence states of Fe2O3@PPy, the evident of XPS spectrum given in Fig. 6. The high resolution Fe 2p spectrum shows two core peaks at 700 eV (Fe 2p) and 720 eV (Fe 2p) with a separation of 20 eV in addition with two peaks, which is significantly approximating that of earlier report of Fe2O3. 54,55 The higher resolution peak of C 1s observed at 290 eV. The peak for Fe de-convoluted into four subpeaks at 695, 705, and 720 eV, consistent to sp2 graphitic lattice (C–C and C=C), in addition with the functional group of O–C=O, C=O, and C–O. 56 The functional group of Fe–O–H, C=O, O–Fe and H–O–H high resolution for O 1s spectrum observed as shifting from 530.4 eV to 540 eV. 57,58
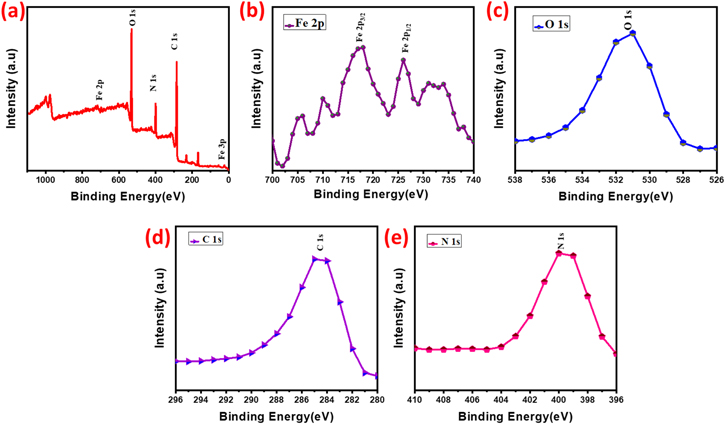
Figure 6. The spectrum of XPS for the nanocomposite of Fe2O3@PPy.
Download figure:
Standard image High-resolution imageXPS is used to analyse the surface chemical nanocomposites as well as to reveal the presence of Fe2O3@PPy nanocomposite. The full range spectrum of Fe2O3@PPy, as shown in Fig. 6, reveals the presence of five major elements: C, O, N, S, and Fe, with atomic masses of 61.7%, 23.5%, 11.7%, 2.8%, and 0.3% respectively. The 1.5 c/s of resolution is N 1 s scan indicates the presence of nitrogen namely pyrrolic N (400.1 eV, 11.7%) from PPy. 59 Herein, this nitrogen can act as a catalytic active cite in the oxygen reduction reaction. 60 Obviously, the chemical bonds of nitrogen in PPy have been reformed into other types of nitrogen subsequently high temperature treatment and hydrothermal reaction. The Fe 2p spectrum in Fig. 7 shows three peaks in 695 eV, 705 eV and 720 eV, corresponding to Fe 2p3/2, Fe 2p1/2, and Fe 2p which can be used for qualitatively signifying the ionic states of iron. 61 The peak at around 720 eV is consistent with the characteristic peak of Fe3+, proving the presence of Fe3+. 62 The primary oxygen containing clusters are O2−, implying that the presence of ferric is Fe2O3 rather than FeOH. The presence of the OH− class on the surface of Fe2O3@PPy is determined by the dominant peak of hydroxyls at 540 eV, which is consistent with the results of FTIR analysis. 63
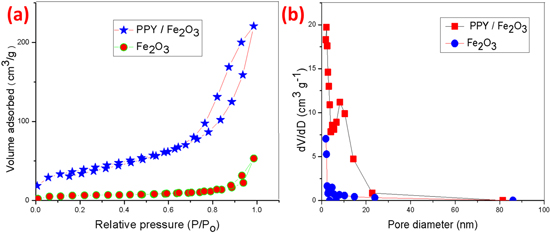
Figure 7. Surface area and pore size analysis of the nanocomposite of Fe2O3@PPy.
Download figure:
Standard image High-resolution imageBET analysis
Brunauer–Emmett–Teller's (BET) theory aims to explain the physical adsorption of gas molecules on a solid and serves as the basis for an important analysis technique for the measurement of the specific area of materials. The surface area is one of the most important quantities for characterizing novel porous materials. The BET analysis is the standard method for determining surface areas from nitrogen adsorption isotherms and was originally derived for multilayer gas adsorption onto a flat surface. Table II. shows the surface area and pore size of the Fe2O3 and Fe2O3@Ppy nanocomposites.
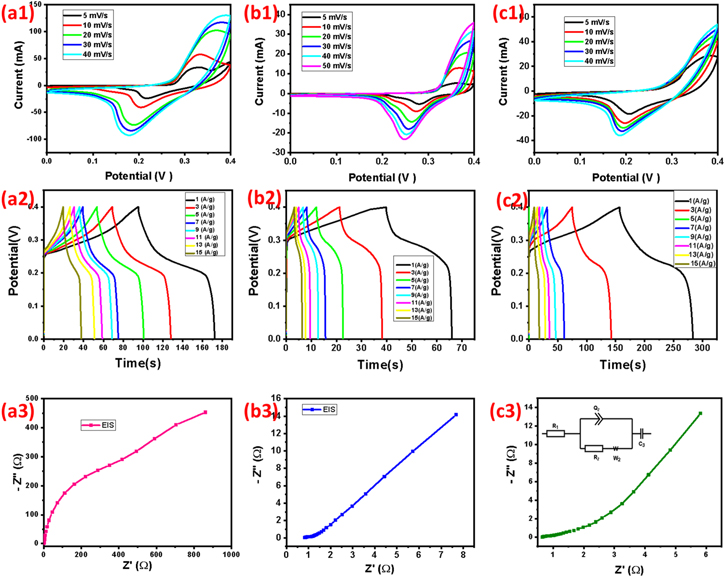
Figures 8. (a1–c1). Cyclic voltammetry performance of PPy, Fe2O3, Fe2O3@PPy nanocomposites, (b2-c2) Galvanostatic charge–discharge curve for PPy, Fe2O3, and Fe2O3@PPy nanocomposites, (a3-c3) Nyquist plot for PPy, Fe2O3 and Fe2O3@PPy nanocomposites.
Download figure:
Standard image High-resolution imageThe surface area and pore diameter of the nanomaterial were characterized by nitrogen (N2) adsorption and desorption isotherms at 77.3 K using a Quantachrome NOVA Station A. The nitrogen adsorption/desorption isotherms measurements were performed to identify the surface area and pore diameter distribution of the prepared materials. The BET surface of Fe2O3, relative pressure increases up to 0.8 (p/po) at volume remains constant then the relative pressure increases and also volume adsorbed increases. In the BET surface composite of Fe2O3/PPY, relative pressure increases up to 1.0 (p/po) and volume adsorbed increases. The BET pore diameter of Fe2O3, volume decreases at the same time pore diameter is constant the pore diameter increases volume remains constant. The BET pore diameter composite of Fe2O3/PPY volume decreases particular value then again increases, then volume decreases pore diameter increase as shown in Fig. 7.
Electrochemical Characterization
Electrochemical impedance spectroscopy (EIS) analysis
The electrochemical impedance spectroscopy (EIS) study has been acquainted as one of the major methods for analytical the electrical and ionic conductivity of the vital recital of supercapacitors. 64,65 The EIS spectra are closely parallel in technique with by a point at lower frequency and an arc at higher frequency range, accompanying represent of the extensive time of an electrochemical stability of the composites material. At actual higher frequencies, the interrupt at real axis (Z') and imaginary axis (Z'') are signifies a collective resistance of solution resistance of electrolyte medium, characteristic resistance of substrate further more contact resistance at the electroactive material/current collector interface which mean electrode resistance (Re). 66 Figure 9 shows the Nyquist plot for (a) pure PPy, (b) Fe2O3 and (c) Fe2O3@PPy nanocomposite were swiped at 1 Hz to 1 MHz and subsequent derivation of real and imaginary part of resistance recorded from 0 ohm to 940 ohm for pure PPy, 0 ohm to 8 ohm for pure Fe2O3 and 0 ohm 6 ohm for Fe2O3@PPy. The evident of the lower resistance of 2 ohm for PPy, 1 ohm for Fe2O3 and, 0.5 ohm for Fe2O3@PPy, which is mentioned as the Fe2O3@PPy based nano composites support to the electrode performance in the course of the of electrochemical supercapacitor function and that the consistent report will be deliberated in Figs. 8a3–8c3. Inset, the figure shows the equivalent circuit model of the Fe2O3/PPy nanocomposite. From this circuit model, the Fe2O3@PPy nanocomposites show a lesser solution (0.5 Ω) and charge-transfer (0.31 Ω) resistance.
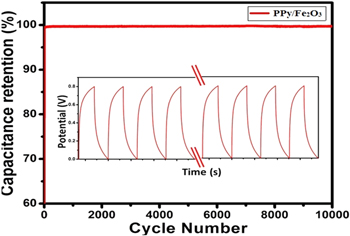
Figure 9. Cyclic performance of Fe2O3@PPy electrode material at a constant current density of 10 A g−1.
Download figure:
Standard image High-resolution image
Cyclic voltammetry (CV) analysis
The Cyclic Voltammetry curves of PPy, Fe2O3 and Fe2O3@PPy nanocomposite carried out at various scan rates in 3 M aqueous KOH electrolyte. In Fig. 7, the CV curves at minor scan rate from 5, 10, 20, 30, and 40 mV s−1 exhibit a pair of redox peak profiles specifying the pseudocapacitive behavior and high reversibility. CV curves are leads to be quasi rectangular curve even at highest scan rate at 40 mV s−1 is indicating an effective redox charge storage behaviour of Fe2O3@PPy nanocomposites. The pure PPy current density is starting as 25, 50, 100, 112.5, and 125 mA for the scan rate of potential range 5, 10, 20, 30, and 40 mV s−1 respectively. The pure Fe2O3 current density is starting from 2.5, 10, 20, 26 and 32 mA for the scan rate of potential 5, 10, 20, 30, and 40 mV s−1 respectively. The nanocomposite Fe2O3@PPy current density is occurring as follow 29, 40, 48, 50, and 56 mA, respectively. Depictive of the shape of oxidation and reduction curves of CVs at higher scan rate 40 mV s−1 is remaining due to the most possible contact between the electrolyte and electrode is greatly condensed with the cumulative scan rate. The as-prepared Fe2O3@PPy nanocomposites shows the highest capacity of 395.45 C g−1 at 5 mV s−1. This remarkable electrochemical results of Fe2O3@PPy due to provide the huge electroactive sites in the electrolyte medium. Table III. Shows the comparison results of the previously published research articles.
Galvanostatic charge–discharge (GCD) analysis
Figure 7 shows the galvanostatic charge–discharge curvatures at 0–0.4 V sweep rate, in addition that the galvanostatic charge discharge curves of current density of obtained 1, 3, 5, 7, 9, 11, 13 and 15 A g−1 for pure PPy (Fig. 7a), pure Fe2O3 (Fig. 7b) and Fe2O3@PPy (Fig. 7c) nanocomposite, respectively. The as-prepared all nanomaterials are shown the non-linear charging and discharging profile, which is confirm the higher significance of pseudocapacitance behavior. However, the Fe2O3@PPy nanocomposite displays an ideal quadrilateral form, the pure PPy has an ovate form, which can be credited to the circumstance that PPy has higher conductive and internal resistance, and the Fe2O3 in the nanocomposite of PPy/Fe2O3 enable the interfacial for electron transport. 67
Electrochemical stability analysis
An extensive cycling life is an essential prerequisite for electrochemical supercapacitors. The cycling life investigation over 10,000 cycles for the Fe2O3@PPy nanostructure electrode was characterized using GCD test at higher current density of 10 A g−1 for 10,000 cycles as shown in Fig. 9. Hence, the Fe2O3@PPy nanostructure electrode is retaining of 98% after 10,000 cycles for long-term stability analysis.
The results achieved in this present effort direct for simplistic synthesis and optimization of Fe2O3@PPy nanocomposite constituents for the purpose of supercapacitor electrode material for energy storage applications.
Conclusions
In summary, we hosted the Fe2O3@PPy nanocomposites for high-performance supercapacitor applications through simple chemical oxidation techniques. The highly stable Fe2O3@PPy nanocomposite electrode materials showed the greatest specific capacity of 395.45 C g−1 at 5 mV s−1. This remarkable electrochemical result of Fe2O3@PPy is due to provide the huge electroactive sites in the electrolyte medium. Moreover, this nanocomposite delivered the 98% capacitance retention after 10000 times of charging and discharging cycles. The results achieved in this present effort lead for simplistic synthesis and optimization of polypyrrol and Fe2O3 oxide based nanocomposite constituents to offer the higher electroactive sites. Based on the electrochemical results, we proposed the as-prepared Fe2O3@PPy nanocomposite considered as potential material for energy storage applications in the numerous fields of electronic circuits, transportation and grid energy storage system.