
Abstract
Growing long and high-density arrays of semiconducting single-walled carbon nanotubes is the key to building high-performance electronics. From the growth process perspective, the density and length of carbon nanotubes are determined by their nucleation probability from individual catalysts, subsequent growth rates, and growth lifetime. Here, we study the effects of additive oxygen-containing species on the growth process at the individual nanotube level during alcohol chemical vapor deposition. When tracing the growth process by isotope labeling techniques, the growth rates are slowed down upon the addition of CO2 due to carbon removal from catalysts. This simultaneously leads to a noticeable extension of the growth lifetime, which has the overall effect of lengthening the nanotube arrays. According to the relationship between the timing of CO2 supply and the growth initiation time of each nanotube, we surprisingly find that the oxidants also trigger the growth initiation, leading to the improvement of nanotube density. As all these effects of the additive oxidants can be explained by the tuning of the supersaturation level of carbon on catalysts, our results suggest the importance of choosing the appropriate balance of carbon sources and oxidants for the simultaneous control of density and length of carbon nanotube arrays.
Export citation and abstract BibTeX RIS

This is an open access article distributed under the terms of the Creative Commons Attribution 4.0 License (CC BY, http://creativecommons.org/licenses/by/4.0/), which permits unrestricted reuse of the work in any medium, provided the original work is properly cited.
Single-walled carbon nanotubes (SWCNTs) can be an ideal channel material in high-performance transistors owing to their intrinsically ultrathin body and high carrier velocity. 1–3 To exploit the full potential of SWCNTs, their electronic type and the inter-tube pitch must be uniformly controlled over a large area; 4 if SWCNT arrays are grown by chemical vapor deposition (CVD) from spatially patterned catalysts, 5 the chirality, nucleation density, and length of aligned nanotubes hold the key to their practical use. 6–8 The direct growth of long and dense nanotube arrays requires further understanding of the mechanisms that determine the kinetics, lifetime, and nucleation of SWCNT growth.
Futaba et al. reported the general rules for growing long nanotube forests from various carbon sources and growth enhancers, i.e., oxygen-containing gas species (oxidants). 9 Growth enhancers, such as oxygen, water, CO2, and hydrogen, remove the carbon coating that deactivates the catalyst. 10–12 The heights of thick nanotube forests can be broken down into the growth rate and lifetime by monitoring the growth process. 13–16 Previous studies found that the growth rate typically peaks at a moderate concentration of oxidants when hydrocarbon species are used as a carbon source, 13,17 and the growth lifetime is prolonged at the same time, resulting in the maximized height of nanotube forests. The growth kinetics of such nanotube forests are easily observed; however, it only provides information on nanotube ensembles, and the growth behavior is greatly affected by inter-tube interactions within bundles. 18 Isolated forms of SWCNTs are thus required to study intrinsic growth mechanisms and achieve a superior electrostatic control of transistors in terms of device performance. 19
Although tracing the growth process of individual SWCNTs has been technically challenging, recent progress in optical microscopy 20 and isotope labeling 21 allows for in situ or ex situ monitoring at an individual nanotube level under practical growth conditions. Investigation of the effect of oxidants on the growth process of each isolated SWCNT could lead to unexplored insights into the nucleation, growth rates, and lifetime. For instance, the apparent growth rates obtained for nanotube ensembles are affected by the number of active catalysts that change with time, especially at the beginning and end of the CVD process. 20,22 Since the microscopic study using ex situ electron microscopy revealed that carbon coating readily forming on catalysts upon carbon feeding is removed by water vapor supply, 23 we expect such an oxidant effect on the catalyst activity to be clearly captured by studying individual nanotubes.
Even when the focus is limited to steady growth after the nanotube nucleation, choosing appropriate quantities of carbon sources and oxidants is essential to control the kinetics and its selectivity among different types of nanotube chirality. 24 Alcohols such as ethanol have been widely used as carbon feedstocks because they provide a moderate balance of the two types of gas species. 25,26 Ding et al. further mixed methanol and ethanol for the selective growth of semiconducting SWCNTs 27 and the growth of long nanotube arrays. 28 The balance should be optimized for better control of products based on the comprehensive understanding of oxidant effects on the growth process.
Here, we investigate the effects of CO2 as an oxidant on the growth process at a single nanotube level using isotope labeling techniques. By measuring the incubation time of nanotube growth, i.e., how long it takes for a catalyst to initiate the nanotube growth upon carbon feeding, the role of oxidants in achieving high-density nanotube arrays is discussed. When focusing on the lengths of grown nanotubes, we find the opposing effects of CO2 concerning growth rates and lifetime. We can also explain the lengthening of nanotube arrays with the additive CO2 through the quantitative measurements of these effects for individual nanotubes. The above-mentioned CO2 effects can be understood in terms of the carbon supersaturation on catalysts, and the efficiencies as an oxidant are quantitively compared with water vapor, leaving a wide choice for tuning the nanotube growth depending on applications.
Experimental
We grow SWCNTs on r-cut single-crystal quartz substrates (Hoffman Materials Inc.). Iron catalysts with a nominal thickness of 0.2 nm are evaporated in lithographically patterned stripes at 500 μm spacing. We use a quartz tube with an inner diameter of 26 mm, and the substrates are placed 20 cm away from the upstream edge of the furnace. After the annealing in the air to remove organic residue at 750 °C, the catalysts are reduced in an Ar that contains 3% H2 at 800 °C for 10 min at 40 kPa, immediately followed by the supply of carbon precursors at reduced pressure. In all the CVD process, 5 sccm ethanol is supplied as a carbon source together with Ar/H2 typically at 50 sccm as a buffer gas, and the total pressure during the nanotube growth is controlled at 1.3–1.4 kPa. When oxidant gases such as CO2 and water are supplied, the total flow rate of the buffer gas and oxidants is fixed at 50 sccm. Note that a computer software (National Instruments, LabVIEW) is used to control the mass flow controllers, which enables complicated gas supply patterns with a response time of typically less than 1 s (Fig. S11 (available online at stacks.iop.org/JSS/11/071002/mmedia)). During the growth of SWCNTs, pulses of 13C-enriched ethanol (Cambridge Isotope Laboratories, Inc., 1,2–13C2, 99%) mixed at specific ratios to 12C ethanol (with the natural abundance) are supplied to embed digitally coded isotope labels in SWCNTs. Three types of labels (0, 1, and #) are defined according to discrete fractions (33, 67, and 100%) of 13C. Labels 0 and 1 serve as binary codes, while a label # works as a delimiter. The grown SWCNT arrays are transferred via thin films of poly(methyl methacrylate) onto Si substrates with 100 nm-thick thermal oxide for Raman spectroscopy measurements. Prior to the transfer process, metal markers are patterned on Si substrates using e-beam lithography and sputtering to locate specific nanotubes. In the case of non-isotope labeling experiments, 12C ethanol is supplied at a constant flow rate for a certain growth duration. Scanning electron microscopy (SEM) is also used with the acceleration voltage of 1 kV to characterize such nanotubes on quartz substrates without transfer.
Raman spectroscopy is performed to characterize SWCNTs with isotope labels. 21 The position and types of isotope labels are identified using a Raman spectrometer (Renishaw, inVia), which are used to reconstruct the time evolution of individual nanotube lengths, including incubation time, lifetime, and growth rates. An excitation wavelength of 532 nm is used because the strong power is available to achieve efficient measurements and because it is resonant to SWCNTs with various chirality grown under the present growth conditions. Each Raman spectrum is acquired for 10 s with an estimated power density of ∼3 × 10⁵ W cm−2.
Results and Discussion
We use the isotope labeling technique to track the change in the growth behavior of individual nanotubes upon the supply of oxidants in the middle of the alcohol CVD process. CO2 is chosen as a representative oxidant in this study because CO2 can be uniformly fed in a wide range of the reactor without depletion, 12 and the flow rate control is easy compared with water. For comparison, we conduct an alcohol CVD for 24 min without additional oxidant supply (hereafter called normal CVD), as well as alcohol CVD processes where CO2 is added at different flow rates to ethanol 6 min after the ethanol supply starts. Figures 1a and 1b show typical SEM images of SWCNT arrays on quartz grown without and with the addition of CO2 (5 sccm), respectively. Note that the partial pressure of CO2 with the flow rate of 5 sccm corresponds to ∼120 Pa. As the catalysts are deposited only on 3 μm wide stripes at 500 μm spacing, the lower nanotube density at the bottom of SEM images reflects their finite length. From SEM observation, CO2 addition seems to result in longer SWCNTs.

Figure 1. Tracing growth modulation by the supply of additive CO2. (a), (b) SEM images of SWCNT arrays on quartz grown from ethanol only (a) and with additive CO2 (5 sccm) (b). Horizontal thick lines near the top are the catalyst stripes. Multiple images are stitched together. (c) Time evolution of the length of a typical nanotube. (d) Flow rate setting for 13C ethanol and CO2, while the total flow rate of ethanol is kept at 5 sccm. Panels (c) and (d) share the x-axis. (e) Raman mapping image showing the G-mode intensity IG and its peak frequency ωG that serves as labels to trace the growth process. The white arrow indicates the SWCNT shown in (c). (f)–(h) Growth rates plotted against the growth incubation time tinc for each nanotube grown without oxidant (f), with 5 sccm CO2 (g), and with 15 sccm CO2 (h). Right panels in (f)–(h) show the distributions of growth rates. All scale bars are 50 μm.
Download figure:
Standard image High-resolution imageTo further obtain insights into the long SWCNTs grown with the CO2 addition, we trace the growth process of each nanotube. Figure 1c shows the time evolution of a typical SWCNT length, which is reconstructed from the sequence of three kinds of isotope labels (Fig. 1d) embedded in the nanotube indicated by the white arrow in the Raman mapping image (Fig. 1e). This particular nanotube initiates the growth with near-zero incubation time tinc and elongates at a roughly constant growth rate until the sudden termination at ∼13 min. Interestingly, the growth continues upon the supply of CO2 without showing a remarkable change in the growth rate.
We collect the growth rates, incubation time, and growth lifetime from ∼100 nanotubes for three different growth conditions and plot the growth rates against the corresponding incubation time in Figs. 1d–1f. Note that only the nanotubes whose lengths exceed certain levels can be counted because the nanotube density is too high near the catalyst stripes to trace the isotope labels along nanotubes. It is not easy to discern the effect of 5 sccm CO2 at a glance in Figs. 1d and 1e, as the growth rate distributions (shown on the right side) are nearly identical. When the amount of added CO2 is increased to 15 sccm, we find the noticeable decrease in the growth rates and the increase in the growth initiation frequency later than 6 min. Since previous works on nanotube ensembles (e.g., forests) have not intensively studied the influence of CO2 (or other oxidants) on the latter aspect, we first turn our attention to the growth initiation.
To elucidate the effect of CO2 on the nucleation of nanotubes, we take a closer look at the incubation time of SWCNT growth. Figures 2a and 2b show histograms of the growth incubation time for the CVD without CO2 and with 5 sccm CO2, respectively. We find an overall trend of a smaller number of nanotubes starting to grow with time in Fig. 2a, likely reflecting the decreasing number of fresh catalysts. While 57% of nanotubes start growing later than 6 min in the normal CVD process, the corresponding percentage in the CO2-assisted CVD process increases to 66%, As the conditions for the first 6 min should be identical in both CVD processes, it seems that more SWCNTs can grow in the presence of additive CO2.
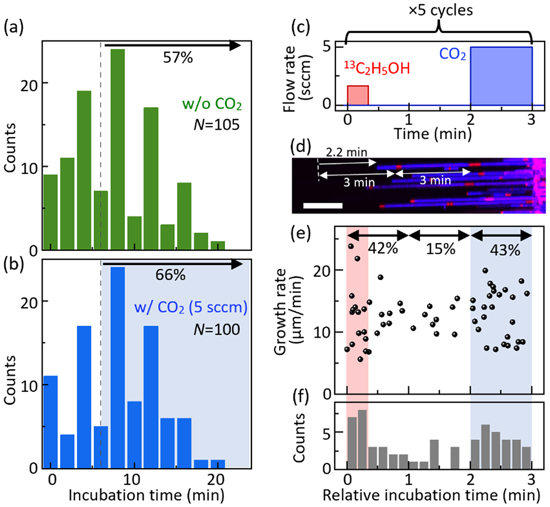
Figure 2. Triggering the nucleation of nanotube growth by CO2 addition. (a), (b) Histograms of growth incubation time for each nanotube grown without oxidant (a) and with 5 sccm CO2 as an oxidant (b). The percentage of nanotubes that initiate the growth at >6 min is shown. (c) Flow rate setting of 13C ethanol and CO2 for another isotope labeling experiment to elucidate the CO2 effect on the growth incubation. (d) Raman mapping image of SWCNT arrays, where blue and red correspond to the nanotube parts grown from 12C and the mixture of 12C and 13C, respectively. The growth incubation time at the top is estimated from the length from isotope labels to the tube tip to be 2.2 min. Scale bar is 20 μm. (e) Growth rates plotted against the growth incubation time of each nanotube. (f) Histogram of the relative incubation time of nanotube growth.
Download figure:
Standard image High-resolution imageAlthough Fig. 2b suggests that CO2 triggers the CNT growth, the difference from Fig. 2a could be attributed to experiment-to-experiment variation. To exclude this possibility, we conduct another experiment and extract the effect of CO2 for triggering the nanotube growth within a single CVD process. As shown in Fig. 2c, we embed isotope labels at 0 min for 20 s, followed by the CO2 supply between 2–3 min. This three-minute cycle is repeated five times continuously so that we can avoid the effect of more nanotubes growing at the early stage of the CVD process (see Fig. 2a), allowing for an unbiased comparison between 1–2 min (without CO2) and 2–3 min (with CO2). Figure 2d shows a Raman mapping image of the grown SWCNT arrays, where blue and red represent the Raman intensity of 12CNTs and the isotope labels, respectively. As the growth rate of each nanotube is nearly constant until the sudden termination, we can estimate the relative timing of the growth initiation by measuring the growth rate and the distance between the tube tip and the nearest isotope label (Fig. 2d). In Fig. 2e, we plot the growth rates against the relative incubation time of nanotubes. Although the average growth rates of nanotubes with tinc ≤ 20 s, 20 < tinc ≤ 120 s, and 120 < tinc ≤ 180 s are almost the same (12.4–13.0 μm min−1), the dispersions are more significant for the nanotubes that initiate the growth with the oxidants supply (Fig. S4), probably reflecting the activation of a wide variety of catalyst nanoparticles. When focusing on the nucleation frequency, adding 5 sccm CO2 enhances the growth initiation by nearly three times, in good agreement with the results in Fig. 2b.
It is noteworthy that we also observe the growth trigger effect at the timing of supplying 13C ethanol, which contains more water impurity (∼4.3%) than 12C ethanol (<10 ppm). In Figs. 2a and 2b, the incubation time distribution has sharp peaks at 4, 8, and 12 min, which are synchronized with the timing of the 100% introduction of 13C ethanol as the delimiter labels # (see Fig. 1d). Judging from the above discussion on CO2 effects, we can attribute this effect associated with the labels # to impurities in the 13C ethanol reagent and air leakage into pipes for the 13C supply (see Fig. S1), which play a similar role to CO2. Since 13C ethanol is introduced for only 10 s after the pause of 50 s, we expect that during this time, the concentration of oxygen leaked in the pipe for 13C ethanol vapor increases. When CO2 is added during the isotope labeling experiment, the 13C-induced peaks in the incubation time distribution become less significant than in the case without CO2 (Fig. S2). The nanotube growth is also triggered when introducing the isotope label in Fig. 2e, often leaving isotope labels at the tube tip as seen in Fig. 2d. Despite this confusing side effect of mixing different ethanol reagents, the experiment shown in Figs. 2c–2f successfully decouples the effect of 13C ethanol and quantitatively extracts the effect of CO2 on the growth initiation.
One might expect that CO2 pushes up the carbon supersaturation on the catalyst to the level needed for cap lift-off, as the supersaturation is required to initiate the nanotube nucleation. 29 In contrast, we have observed the shrinkage of nanotubes at their root under CO2 supply without other carbon sources (Fig. S6), which indicates that CO2 instead reduces the carbon concentration on catalysts. Furthermore, our experiments show that the catalysts for nanotubes do not incorporate carbon atoms of CO2 molecules (Fig. S9). We thus suspect that CO2 assists the reactivation of such in-active catalysts by removing the carbon shell wrapping catalysts, which was previously observed using electron microscopy and spectroscopy. 23 Another possible mechanism of the growth triggered is that the reduced adhesion energy of carbon atoms on catalyst particles partially oxidized by CO2 enhances cap lift-off. 30
The effect of additional CO2 to trigger SWCNT growth should result in higher-density arrays of nanotubes. In Figs. 1a and 1b, however, the increase in the nanotube density is not significant because misaligned nanotubes may prohibit the aligned growth of other nanotubes near the catalyst regions when the number of catalysts is large. 31 To observe the CO2 effect more clearly, we reduce the nominal thickness of iron catalysts from 0.2 to 0.1 nm and conduct 12C ethanol-based CVD for 30 min with three different growth conditions, as shown in Figs. 3a–3c. In addition, isotope labels are not included in this experiment to avoid the influence of 13C ethanol on the nucleation of nanotubes.

Figure 3. Nanotube density increase with different patterns of CO2 supply. (a)–(c) Flow rate setting of CO2 (upper) and ethanol (lower) without isotope labeling in three different CVD processes. (d)–(f) Corresponding SEM images of SWCNT arrays. Scale bars: 50 μm. The nominal thickness of iron catalysts in (d)–(f) is reduced to 0.1 nm to see the effect of CO2 clearly.
Download figure:
Standard image High-resolution imageFigure 3d shows a typical SEM image of nanotubes grown from ethanol without additive CO2, and the number density of nanotubes is 0.16 tubes μm−1. In the second growth condition, 5 sccm CO2 is supplied to the same amount of ethanol. As shown in Fig. 3e, the nanotube density is increased to 0.40 tubes μm−1 as expected from the incubation time distributions in Figs. 2b and 2f. Interestingly, when CO2 is supplied in repetitive pulses, the density is even higher (0.67 tubes μm−1) than the case with the constant flow rate (Fig. 3e), although the total supply of CO2 is reduced by six-fold. The increased density with the periodic CO2 supply implies that each catalyst has a different sweet spot of the carbon concentration for SWCNT nucleation. If the effective supply rate of carbon is too large, some catalysts are encapsulated with carbon shells, and if the effective supply rate is too small, the carbon supersaturation of some other catalysts is not high enough to induce the cap lift-off.
A similar density increase has actually been reported in a "periodic" CVD approach, where carbon feeding is periodically turned off to achieve high-density arrays. 31,32 Unlike the previous study where randomly aligned nanotubes prevent the following growth of aligned nanotubes if the formers are not removed by water vapor exposure, 31 it seems that misaligned nanotubes do not hinder the subsequent growth of other nanotubes for the case in Fig. 3d. Rather, in our study, the density of misaligned nanotubes in the catalyst region is also increased by the additive CO2. Further increase in nanotube density is thus expected by intelligently modulating the supply of gas species: namely, periodically adding CO2 to trigger the growth and pausing the supply of ethanol to shrink misaligned nanotubes.
Since growing long nanotubes holds the key to obtaining spatially homogenous nanotube arrays grown from patterned catalyst regions, we also study the lifetime of nanotube growth with and without additive CO2 in the ethanol CVD process. As ethanol intrinsically provides oxidant species through thermal decomposition, 24,25 unlike the ethylene-based CVD process, 12 it is not always apparent whether and how additive oxidants affect the growth lifetime.
In Figs. 4a and 4b, the growth lifetime of each nanotube in Fig. 1 is plotted against the growth incubation time. We see an overall trend of a longer lifetime in the CO2-assisted CVD process. Since ethanol is supplied only for 24 min, the lifetime of some SWCNTs is underestimated by the 24 min limit (the gray region). To cancel out the difference in the incubation time distributions, Figs. 4c and 4d count the growth lifetime of the nanotubes that initiate the growth in the first 6 min. Compared with the average lifetime of 9.0 min in the normal CVD, that with the addition of 5 sccm CO2 is noticeably extended to 13.5 min. The extended lifetime can also be attributed to the removal of excessive carbon on catalysts 33 since catalysts are often found to be encapsulated by a carbon layer after CVD processes. 34 The incubation time-independent nanotube diameter (Fig. S3d) also supports the carbon encapsulation, rather than Ostwald ripening, as a major possible mechanism of growth termination in our growth conditions. Maintaining a moderate carbon concentration on the catalyst through the supply of oxidants is thus beneficial in raising the density of nanotube arrays and increasing their length. Similar tuning of the balance between carbon sources and oxidants for the growth of millimeter-long nanotubes has been realized in the CVD that mixed methanol and ethanol with an optimized ratio. 28

Figure 4. Effect of CO2 on growth lifetime. (a), (b) Growth lifetime plotted against incubation time without (a) and with additive CO2 (b). Filled diamonds and open squares represent the lifetime of the nanotubes whose isotope labels are fully traced and the lifetime estimated from the length and average growth rate, respectively. No plot exists in the gray and yellow regions due to the limited growth time and an insufficient number of isotope labels, respectively. (c), (d) Histograms of the growth lifetime without (c) and with additive CO2 (d) for nanotubes that start the growth at <6 min, that is, before the CO2 supply starts.
Download figure:
Standard image High-resolution imageSo far, we have discussed the positive effects of additive CO2 in terms of growth initiation and lifetime. If these effects are indeed derived from the reduced concentration of carbon on the catalyst, the growth rate γ, which is proportional to the degree of supersaturation, 24 should accordingly be suppressed. Then, nanotube lengths, i.e., the product of the growth rate and lifetime, could be shortened or lengthened upon the addition of oxidants depending on the quantitative degree of these opposing effects.
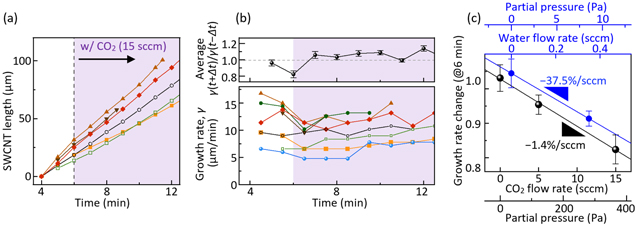
Here we focus on the CVD with the addition of 15 sccm CO2, where the growth rate change can be easily captured. Figure 5a shows the time evolution of lengths for typical nanotubes that grow across 6 min when the CO2 supply starts. The majority of SWCNTs go through the growth deceleration upon the CO2 addition, likely due to the lowered supersaturation of carbon as expected. Note that the structure of nanotubes (chirality, defects, etc.) is not affected by the supply of CO2, as shown in Fig. S3, and the growth rate change is not associated with such changes. It is also noteworthy that the growth rates of the SWCNTs plotted with open marks are not influenced by CO2 addition because the susceptibility to oxidants varies greatly from catalyst to catalyst. 24 To see the change in γ more clearly, the time dependence of γ is plotted for each nanotube in the lower panel of Fig. 5b. The upper panel shows the average rate of change in γ at each timing for all nanotubes. While the rate of change is slightly larger than 1 most of the time, it goes through deceleration by 18% only at t = 6 min due to the CO2 addition.
Figure 5. Effect of oxidants on growth rates. (a) Time evolution of the lengths of typical nanotubes that start the growth before introducing CO2 at 6 min (b) Lower panel: growth rate evolution of individual nanotubes whose tinc < 6 min. Upper panel: the average rate of change in the growth rates γ(t) of all SWCNTs growing at each timing t. Error bars represent the standard error. (c) Average γ(t+Δt)/γ(t−Δt) at t = 6 min plotted as a function of the flow rates of CO2 and water. In these cases, Δt = 0.5 min.
Download figure:
Standard image High-resolution image
For a more comprehensive understanding of the oxidant effect on the nanotube growth rates, we plotted the growth acceleration/deceleration upon the addition of CO2 and water vapor with a different flow rate in Fig. 5c. An apparent slowdown of γ by 4.6% is observed under the addition of 5 sccm CO2. From the linear fit of the three points of the experiments, we obtain the slope of −1.4% per one sccm (−0.056% per one Pa) of CO2. We also perform a similar experiment for water at a flow rate of 0.35 sccm (see Fig. S5), which results in the growth slowing down by 9.5%, in good agreement with our recently proposed kinetic model that predicts the deceleration to be 11.2%. 24 As the experiments with additive water yield the slope of −37.5% per one sccm (−1.54% per one Pa), water vapor works as an oxidant ∼27 times stronger than CO2. The monotonic slowdown of growth rates with the additive oxidants in this study may seem inconsistent with the previous studies, 13,17 where the growth rates peaked at a moderate level of oxidants. This is probably because unlike hydrocarbon such as ethylene, ethanol originally contains more oxidants than required to maximize the growth rate.
The activity of CO2 and water as oxidants can be compared in a different manner without supplying carbon sources. Our previous study observed the catalytic shrinkage of nanotubes under water vapor during the interruption of ethanol supply. While the average shrinkage rate was 1.05 μm min−1 in water vapor at 7 Pa, 35 the present study reveals the shrinkage rate in CO2 at ∼120 Pa to be 0.48 μm min−1 (see Fig. S6). The comparison of these shrinkage rates indicates that the efficiencies as oxidants are ∼37 times different, in reasonable agreement with the growth deceleration. In addition, the efficiency ratios of water to CO2 determined in this study roughly agree quantitatively with that in the previous study (e.g., ∼30 at 950 °C) on the iron-catalyzed gasification of carbon with water and CO2. 36 It can be then inferred from the carbon gasification experiments that the efficiency of H2 in removing carbon from catalysts is about an order of magnitude smaller than that of CO2.
Judging from the CO2 effect of slowing down the growth rates, both the growth trigger and extended lifetime with the additive CO2 can be attributed to the prevention of catalysts from encapsulation by carbon shells. When comparing the opposing effects of additive CO2 on lifetime extension and growth slowdown (see also Fig. S10), the former effect on nanotube length is much more significant at the flow rate of 5 sccm, resulting in extended lengths of nanotube arrays. Length enhancement by the additive CO2 can be further confirmed by extending the CVD time to 50 min (Fig. S7). Therefore, by balancing the carbon sources and oxidants in the gas phase and thereby keeping the carbon concentration on the catalyst at an appropriate level, CNT length, the product of growth rates and lifetime, can be maximized.
Conclusions
We have studied the roles of CO2 and related oxidants in the growth process of individual aligned carbon nanotubes, where the effect of mutual interaction within nanotube bundles is excluded. The CO2 effects can be categorized into growth initiation, growth rate, and growth lifetime. The growth rate of each nanotube is slightly slowed down because the oxidants remove carbon atoms from the catalyst, reducing the supersaturation level. On the other hand, the additive oxidants prolong the growth lifetime through inhibition of carbon coating on the catalyst, which was repeatedly reported in previous studies on nanotube ensembles. Since the latter effect is more significant, the nanotube lengths are increased. In addition, we have found that the additive CO2 facilitates the growth initiation by a factor of ∼3, resulting in the improved density of nanotube arrays. The addition of oxidants to alcohols, which provide a fixed ratio of carbon sources and oxidants, is thus beneficial from multiple points of view. In order to grow dense and long nanotubes, the appropriate concentration of carbon on catalysts should be maintained by controlling the balance and absolute amounts of carbon sources and oxidants, which also hold the key to kinetic selectivity for chirality control.
Acknowledgments
Part of this work was supported by JSPS (KAKENHI JP20H00220, JP20K15137, JP22H01411). A part of this work was conducted at Takeda Sentanchi Supercleanroom, The University of Tokyo, supported by "Nanotechnology Platform Program" of the Ministry of Education, Culture, Sports, Science and Technology (MEXT), Japan, Grant JPMXP09F21UT0047.