
Abstract
Carbon dots (CDs) has been widely applied in LED diodes, sensing and bioimaging. However, the fluorescence property of CDs is limited because of the solid-state aggregation-caused quenching (ACQ). Metal-organic frameworks (MOFs), due to their high surface area, porosity and tunable pore size, are considered suitable hosts to inhibit the ACQ of CDs. Herein, the Zr-MOFs (UiO-66-(OH)2) is chosen as a host to encapsulate CDs. The dual-emitting CDs@MOFs system is constructed, which overcomes the problem of solid-state aggregation-caused quenching of carbon dots to gain the blue-emitting CDs@UiO-66-(OH)2. With the volume of CDs increased, the fluorescence of CDs@UiO-66-(OH)2 has changed simultaneously. When the volume reaches 3 ml, CDs@UiO-66-(OH)2 begin to cause fluorescence quenching. The correlated color temperatures (CCT) of CDs@UiO-66-(OH)2 are transformed from cold light to warm light. That can be further researched in electroluminescent diodes, ion-sensor, environmental monitoring, biological imaging and developments in other related biochemical fields.

Export citation and abstract BibTeX RIS

This is an open access article distributed under the terms of the Creative Commons Attribution 4.0 License (CC BY, http://creativecommons.org/licenses/by/4.0/), which permits unrestricted reuse of the work in any medium, provided the original work is properly cited.
Carbon dots is a new type of carbon nanomaterial, with a size below 10 nm, composed of dispersed spheroid particles with many functional groups around the particles. 1–3 Contrast that with fluorescent dyes and rare earth elements, carbon dots have the merits of the low toxic, low cost, excellent luminous performance and great biocompatibility, 4–10 so carbon dots have been researched extensively. In recent years, due to the particular structural characteristics of carbon dots (CDs), it is widely used in many fields, such as bacterial sensing, 1 metal ion detecting, 9,11–16 cell imaging, 17,18 drug releasing 17 and so on. And based on these fields, the excellent luminous performance of CDs has raised concern. It is vital to construct the appropriate fluorescence luminescent of carbon dots. But the solid-state aggregation-caused quenching of CDs 10,19 is the main problem to fabricate new materials. To avoid the occurrence of quenching, it is crucial to find suitable materials for the encapsulation of CDs.
In the last few years, porous materials are diffusely used for host materials to encapsulate guest molecules. The commonly used guest molecules at the present stage are organic dyes, 20–23 carbon dots, 24–26 rare earth metal ion, 27–30 etc. Porous materials, like metal-organic framework (MOFs) materials, have aroused great concern due to the merits of large specific surface area and porosity, tunable pore size, and luminescent property. 31–35 Metal-organic framework materials are self-assembled by metal ions and organic ligands. 36,37 It is extensively applied to catalysis, 38 drug delivery, 39 gas storage and separation, 40 chemical sensing, 41,42 microwave absorbers 43,44 and so on. Because of the luminescent property of MOFs, it is easy to construct the dual-emitting system of CDs@MOFs. Interestingly, MOFs as a host can effectively restrain the solid-state ACQ of CDs. Meanwhile, the volume of CDs also affects the luminescence of CDs@MOFs.
In recent years, Dong et al. 45 reported the synthesis of Eu-MOFs/N, S-CDs by the one-pot method. Eu-MOFs/N, S-CDs can be used as fluorescence ratio sensors for the detection of water in organic solvents. In addition, Guo et al. 46 synthesized CDs@Eu-MOFs. CDs@Eu-MOFs can be used for detecting Hg2+ in an aqueous environment. Due to the Hg2+ can be changed the fluorescence intensity of CDs, so blue-emitting CDs and red-emitting Eu-MOFs can serve as sensing section and reference section, respectively. Xie et al. 47 researched the synthesis of CDs@ZIF-8, which could be used as the fluorescence probe for sensitive detection of dopamine. Wang et al. 48 synthesized CNDs@ZIF-8 by calcining ZIF-8 crystal. CNDs were obtained by decomposing 2-methylimidazole and CNDs@ZIF-8 had the same crystal structure of ZIF-8. By adjusting the calcination time, CNDs@ZIF-8 can be got white light emission. Simultaneously, it can be used as a temperature sensor.
Herein, Zirconium-based MOF in especial UiO-66-(OH)2 is an excellent choice for host material on account of high thermal stability, chemical stability and luminescent properties. In addition, −OH modified UiO-66 can be added the binding sites to enrich target materials (guest). Thus, CDs as the guest is dispersed on the surface of Zr-MOF, which is a feasible method to solve the ACQ problem of carbon dots. 49,50 Meanwhile, the dual-emitting CDs@MOFs system is constructed by the yellow emitting CDs and blue-emitting Zr-MOFs. The luminescence of the composites can be adjusted by changing the volume of the carbon dots. Visibly, with the volume of carbon dots increased to 1 ml, the fluorescence of CDs@UiO-66-(OH)2 is blue shifted. When the volume is increased to more than 1 ml, the fluorescence of CDs@UiO-66-(OH)2 is the redshift. Until the volume of CDs is reached 3 ml, the fluorescence of the material will appear blue shift due to the ACQ of CDs. Hence, the construction of CDs@UiO-66-(OH)2 is significant, which is worth researching from the design and preparation to the luminescence properties. Finally, we can further study the development of electroluminescent diodes, ion sensors, environmental monitoring, biological imaging and other related biochemical fields.
Experimental
Materials
Zirconium chloride (ZrCl4) and 2,5-dihydroxyterephthalic acid were purchased from Aladdin. N, N-dimethylformamide (DMF), absolute ethanol (EtOH), o-phenylenediamine and hydrochloric acid were purchased from Sinopharm Chemical Reagent Co., Ltd. All reagents were analytical grade and can be used without further purification. Deionized water was laboratory-made.
Instrumentation
The powder X-ray diffraction (PXRD) was measured by a Bruker D8A25 (air atmosphere) X-ray powder diffractometer made in Germany with a scan range from 4° to 40°. The Fourier transform infrared spectroscopy (FT-IR) was obtained by Nicolet-iS 50 made in the USA. The zeta potentials were measured by nanoparticle size and potential analyzer (Zetasizer Nano ZS90). The specific surface area (BET) was obtained by QDS-MP-30 made in the USA. The degassing temperature of UiO-66-(OH)2 and CDs@UiO-66-(OH)2 was 100 °C. Then the N2 adsorption-desorption isotherms and pore volume information of samples were obtained. The surface topographic characteristics and element content and distribution analysis of samples were acquired by field emission scanning electron microscope (FESEM) (Zeiss Sigma550) and Energy-dispersive X-ray spectrometry (EDS) (Bruker). The fluorescence spectrums were measured by F-320 fluorescence spectrophotometer. The quantum yield and luminescence decay curves (fluorescent lifetime) of UiO-66-(OH)2 and CDs@UiO-66-(OH)2 were obtained by the stable/transient fluorescence spectrometer (Fluo Time300).
Synthesis of CDs
The synthesis of carbon dots (CDs) was referred to the previous literature 51 and improved on synthetic methods. Carbon dots were synthesized by the hydrothermal method using the bottom-up theory. 0.8 g o-phenylenediamine was ultrasound dissolved in 10 ml water. Then the resulting solution was pouring into the Teflon-lined reactor and put into a drying oven at 200 °C for 3 h. And the deep yellow solution was obtained. Then the deep yellow solution was filtered using a microporous membrane with an aperture of 0.22 μm to remove significant particle substances. The solution was dialyzed in a dialysis bag for 24 h. After dialyzing, the bright yellow solution was acquired for future experiments.
Synthesis of UiO-66-(OH)2
The synthesis of UiO-66-(OH)2 was referred to as the ratio in the previous literature. 52 In this experiment, UiO-66-(OH)2 was synthesized by the microwave method. Zirconium chloride (ZrCl4) (0.25 g, 0.54 mmol) and 2,5-dihydroxyterephthalic acid (0.149 g, 0.75 mmol) were ultrasonic dispersion in 5 ml and 10 ml N, N-dimethylformamide (DMF), respectively. And then, 1 ml HCl was added into DMF solution of ZrCl4. The resulting mixed solution was reacted in an MCR-3 atmospheric microwave chemical reactor at 100 °C for 2 h. The resulting sample was washed with DMF and absolute ethanol three times and dried at 80 °C for 12 h.
Synthesis of CDs@UiO-66-(OH)2 composite
Carbon dots solutions with different volume ratios were prepared.
Synthesis of UiO-66-(OH)2−0.1: Taking 0.1 ml CDs to 100 ml volumetric flask to prepare CDs solution. 100 mg UiO-66-(OH)2 was putting 100 ml of CDs solution at 37 °C for 24 h. Then the product was ultrasonic washed several times until filtrate was colorless to removing unencapsulated CDs from the sample surface. Finally, the product was dried at 80 °C for 12 h.
The synthesis of UiO-66-(OH)2−0.5, UiO-66-(OH)2−1, UiO-66-(OH)2−1.5, UiO-66-(OH)2−2, UiO-66-(OH)2−3 and UiO-66-(OH)2−3.5 were similar to the above experimental method and just changing the adding volume of the carbon dots.
Results and Discussion
Characterization of CDs@UiO-66-(OH)2
The synthesis roadmaps of CDs, UiO-66-(OH)2 and CDs@UiO-66-(OH)2 (The following test options UiO-66-(OH)2−2) are shown in Scheme

Scheme 1. The synthetic process diagram of UiO-66-(OH)2 and CDs@UiO-66-(OH)2.
Download figure:
Standard image High-resolution image
Figure 1. PXRD pattern of synthetic UiO-66-(OH)2 and CDs@UiO-66-(OH)2.
Download figure:
Standard image High-resolution image
Figure 2. FT-IR spectra of CDs, UiO-66-(OH)2 and CDs@UiO-66-(OH)2.
Download figure:
Standard image High-resolution image
Figure 3. (a) Zeta potential of CDs, UiO-66-(OH)2 and CDs@UiO-66-(OH)2; (b-c) The N2 adsorption-desorption isotherm of UiO-66-(OH)2 and CDs@UiO-66-(OH)2; (d) The pore size distribution of UiO-66-(OH)2 and CDs@UiO-66-(OH)2.
Download figure:
Standard image High-resolution image
Figure 4. TGA data of UiO-66-(OH)2 and CDs@UiO-66-(OH)2.
Download figure:
Standard image High-resolution image
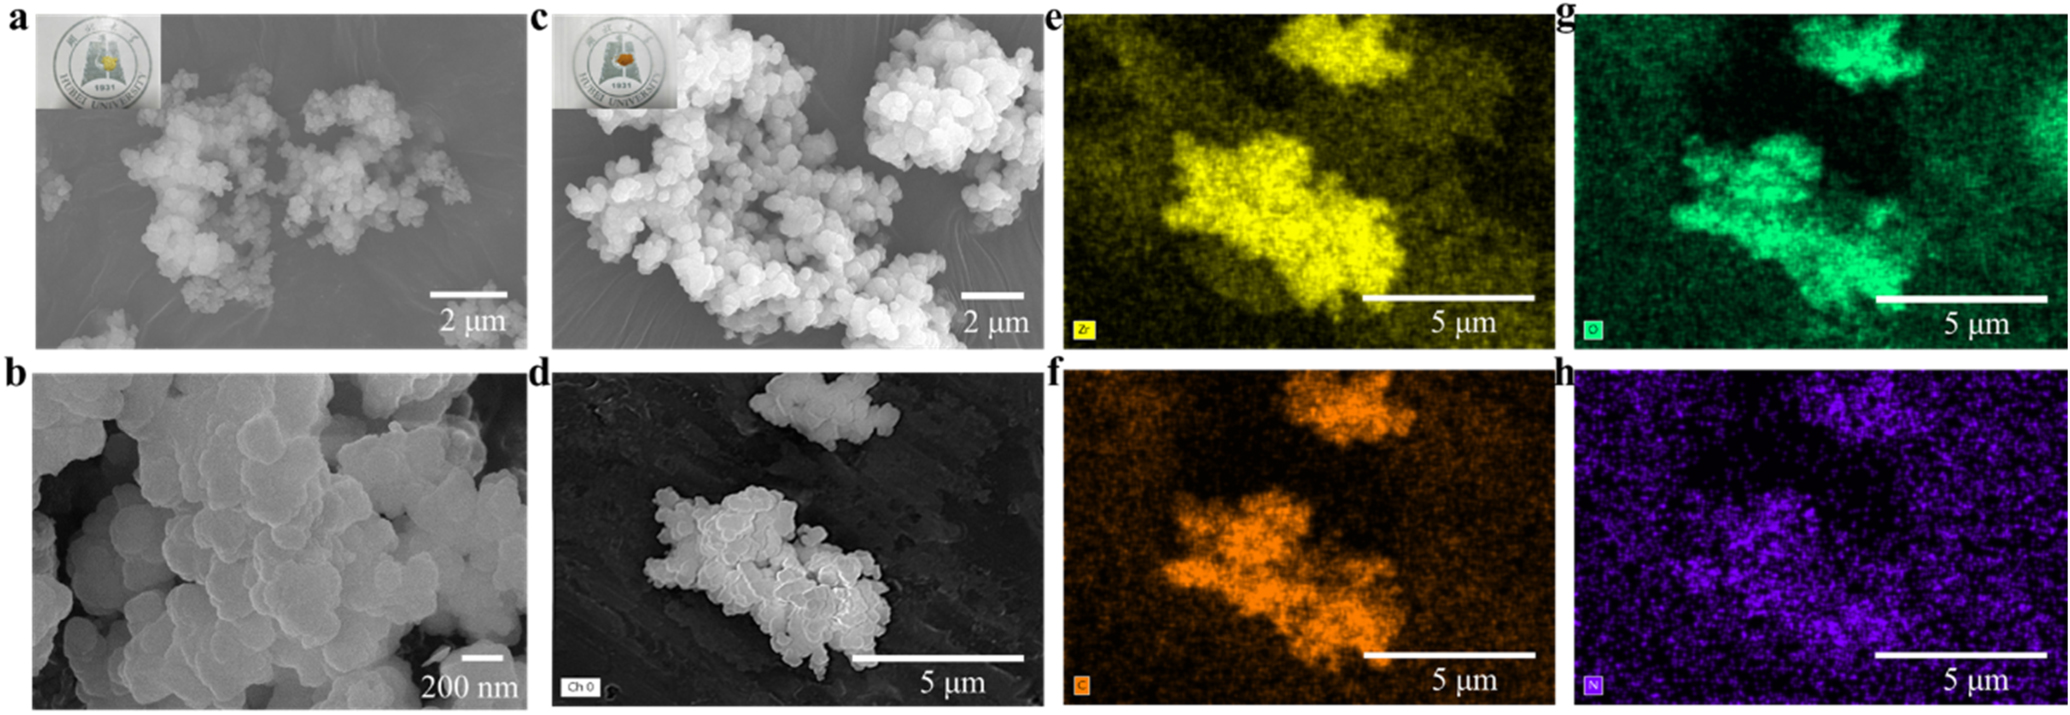
Figure 5. (a) The FESEM of UiO-66-(OH)2 (The inserted picture is UiO-66-(OH)2 powder); (b)–(c) The FESEM of CDs@UiO-66-(OH)2 (The inserted image is CDs@UiO-66-(OH)2 powder); (d)–(h) The SEM-EDS mapping of the distribution of Zr, C, O, N in the CDs@UiO-66-(OH)2.
Download figure:
Standard image High-resolution imageTable I. SEM-EDS result.
| Material | C (at%) | Zr (at%) | O (at%) | N (at%) |
|---|---|---|---|---|
| UiO-66-(OH)2 | 53.81 | 24.47 | 21.72 | / |
| CDs | 27.57 | / | / | 72.43 |
| CDs@UiO-66-(OH)2 | 32.06 | 33.38 | 30.72 | 3.84 |
The fluorescent properties of CDs@UiO-66-(OH)2
For the purpose of exploring the fluorescent properties of CDs@UiO-66-(OH)2, a series of tests are done. With regard to the luminescence of MOFs, much literature had done a great deal of research. As shown in Fig. 6a, the emission spectrum of carbon dots is measured at different states. It is distinctly that solid-state CDs is no obvious emission peak at 365 nm excitation wavelength, which is confirmed the solid-state aggregation-caused quenching of CDs. Inversely, the liquid state CDs have an emission peak at 565 nm when the excitation wavelength is 365 nm. The inset pictures are the irradiation at natural light (left) and 365 nm UV–light (right) of liquid state CDs. Conspicuously, CDs have yellow fluorescence when exposed to ultraviolet light at 365 nm, consistent with the tested emission curve. As exhibited in Fig. 6b, the emission spectrums of UiO-66-(OH)2 and CDs are excited at 365 nm. The maximum emission wavelength of UiO-66-(OH)2 and CDs is at 475 nm and 565 nm, respectively. The inserted graph is used CIE 1931 chromaticity diagram to constructed. It is observed that the fluorescence color of UiO-66-(OH)2 is blue and the fluorescence color of CDs is yellow at the CIE chromaticity diagram. Because of the solid-state fluorescence aggregation quenching of CDs, it is useful to effectively restrain the fluorescence quenching of CDs that utilize the advantages of MOFs, such as large specific surface area and porosity. Subsequently, it is explored the fluorescence property of UiO-66-(OH)2 is doped with different volumes of CDs solution. The PL spectrum of CDs@UiO-66-(OH)2 composite materials is shown in Fig. 7a. With the volume of CDs solution increased, the PL intensity of CDs@UiO-66-(OH)2 is decreased. Simultaneously, when the CDs volumes are 0.1 ml, 0.5 ml and 1 ml, the emission peak of UiO-66-(OH)2 is blue shift slightly. The reason for this phenomenon may be the interaction of CDs and UiO-66-(OH)2. Because the external of UiO-66-(OH)2 existed −OH group and the −NH2 group of CDs is on the surface. −OH and −NH2 is easy to form supramolecular interaction, which may be generated by hydrogen bond 26 that may bring about PL intensity and emission peak changed. Immediately, when the volume of CDs reaches 2 ml, the emission peak is redshift. The chromaticity coordinates of UiO-66-(OH)2–2 is (0.29, 0.36), which is very closed to white light emission (0.33, 0.33) 20,23 (The Commission International ed'Eclairage (CIE) coordinates). When the volume of CDs is sequentially increased, the emission peak of UiO-66-(OH)2–3 and UiO-66-(OH)2–3.5 is also a blue shift. But the emission blue color is shallower than UiO-66-(OH)2–0.1. The reason for the blue shift of UiO-66-(OH)2–3 and UiO-66-(OH)2–3.5 may be the solid-state aggregation-caused quenching of CDs on the surface of UiO-66-(OH)2. Therefore, when the volume of CDs is more than 2 ml, the blue shift of CDs@UiO-66-(OH)2 is more significant. Worth mentioning, the quantum yield and fluorescent lifetime are also important indicators of luminescent materials. The quantum yield represents the ability of absorbed light energy to be converted into fluorescence. Measured and calculated by the stable/transient fluorescence spectrometer (Fluo Time300), the quantum yield of CDs and CDs@UiO-66-(OH)2 is 1.3% and 12.2% (Table II), severally. In the meantime, the quantum yields of encapsulating different guests in MOFs 25,55–57 are enumerated as shown in Table II. It is obvious that the quantum yield of CDs@UiO-66-(OH)2 is higher than other MOF materials. Subsequently, the PL decay curves of UiO-66-(OH)2 and CDs@UiO-66-(OH)2 are exhibited in Figs. 8a–8b. And then, the fluorescence lifetime of UiO-66-(OH)2 and CDs@UiO-66-(OH)2 are calculated by fitting the PL decay curves. As displayed in Fig. 8c, it is seen that the fluorescence lifetime of UiO-66-(OH)2 is 0.43 ns. When the volume of carbon dots is gained, the fluorescence lifetime of UiO-66-(OH)2 shows a trend of gradual increase. This demonstrates that carbon dots can be increased the fluorescence lifetime of UiO-66-(OH)2 material. Furthermore, the value of the correlated color temperatures (CCT) is the key to judge the warm and cold light. CCT values are acquired with the CIE coordinates of different materials. The CCT from UiO-66-(OH)2 to UiO-66-(OH)2–3 is decreased approximately, as shown in Table III. So that the light of materials is transited from cold light to warm light.

Figure 6. (a) The PL spectra of CDs at different state. Inset: images of liquid CDs under visible light (left) and 365 nm UV light (right) (b) The PL spectra of CDs and UiO-66-(OH)2. The inserted graph is CIE chromaticity diagram of CDs and UiO-66-(OH)2.
Download figure:
Standard image High-resolution image
Figure 7. (a) The PL spectra of CDs@UiO-66-(OH)2 at different volumes of CDs solutions. (b) The CIE chromaticity diagram of CDs@UiO-66-(OH)2.
Download figure:
Standard image High-resolution imageTable II. The comparison of quantum yield (QY) of different MOFs composite materials.
| MOFs | Guest | QY (%) | References |
|---|---|---|---|
| TMOF-7 | — | 11 | Chem. Comm., 2020. 55 |
| NENU-521 | Alq3 | 11.4 | Chem. Comm., 2016. 56 |
| Ln-MOF | CDs | 9 | ACS Appl. Mater. Interfaces. 2019. 25 |
| Zn(II)-MOF | Eu3+/Tb3+ | 8 | J. Mater. Chem. C 2014. 57 |
| UiO-66-(OH)2 | CDs | 12.2 | This work |

Figure 8. (a) The PL decays curves of UiO-66-(OH)2 (b) The PL decays curves of CDs@UiO-66-(OH)2 (c) The fluorescence lifetime of CDs@UiO-66-(OH)2.
Download figure:
Standard image High-resolution image
Table III. The chromaticity coordinates and CCT of CDs@UiO-66-(OH)2.
| Material | (x, y) | CCT |
|---|---|---|
| UiO-66-(OH)2 | (0.21,0.34) | 13392 K |
| UiO-66-(OH)2–0.1 | (0.22,0.34) | 12448 K |
| UiO-66-(OH)2–0.5 | (0.23,0.33) | 12306 K |
| UiO-66-(OH)2–1 | (0.22,0.31) | 14926 K |
| UiO-66-(OH)2–1.5 | (0.27,0.35) | 8633 K |
| UiO-66-(OH)2–2 | (0.29,0.36) | 7379 K |
| UiO-66-(OH)2−3 | (0.29,0.36) | 7379 K |
| UiO-66-(OH)2−3.5 | (0.27,0.34) | 8874 K |
Conclusions
By using a conventional adsorption method, CDs were encapsulated on Zirconium-based MOF. This method suppressed the ACQ problem of CDs and constructed a CDs@UiO-66-(OH)2 dual-emitting system. By adjusting the volume concentration of CDs, it is seen that the luminescence of CDs@UiO-66-(OH)2 composite material is changed. When the added volume of CDs is more than 2 ml, which may generate fluorescence quenching. The fluorescence quantum yield of CDs@UiO-66-(OH)2 is 12.2%. With the volume added of CDs, the material transitions from a cold light source to a warm light source and the fluorescence lifetime is increased in the meantime. Hence, MOFs as host of CDs@MOFs dual-emitting system is the way to inhibit ACQ of carbon dots and may apply to electroluminescent diodes, ion-sensor, environmental monitoring, biological imaging and other related biochemical fields in the future.
Acknowledgments
This study has been supported by the National Key Research and Development Program of China (SQ2020YFF0413357); Hubei Provincial Key Laboratory of Economic Forest Germplasm Improvement and Resources Comprehensive Utilization, Hubei Collaborative Innovation Center for the Characteristic Resources Exploitation of Dabie Mountains, Huanggang Normal University, Huanggang 438000, China (202020504).