

Abstract
Silicon solar cells are still dominating the solar cell market due to its mature technology, but its efficiency was limited due to its ineffective response to solar spectrum. Phosphor could modify the solar spectrum by transferring the Sunlight that cannot be effectively used to optimal response range of silicon solar cell. Here, Ba3Y(BO3)3: Ce3+, Nd3+ with near-infrared (NIR) emission were prepared via solid-state reaction route, which offer wide blue-violet light of Ce3+ ions and intense near-infrared light of Nd3+ ions locating at the maximal spectral response of silicon solar cell. The near-infrared emission intensity of Ce3+-Nd3+ sample was increased in comparison with that of Nd3+ single-doped sample, which show that Ce3+ act as an efficient sensitizer with broad absorption cross-section. The energy transfer mechanism was also analyzed. Results reveal that Ba3Y(BO3)3: Ce3+, Nd3+ co-doped phosphor have promising applications as solar spectral convertor for silicon-based solar cells.
Export citation and abstract BibTeX RIS
In recent years, environmental and energy problems have become increasingly serious, the development of renewable and green energy sources catch much attention. Solar cells have a huge market opportunity, such as perovskite, dye-sensitized and organic solar cells. Among them, silicon solar cells still occupy the majority of solar cell commercial market. 1,2 One of the main obstacles to improving the conversion efficiency of silicon solar cells comes from the mismatch of the uneven distribution sunlight and optimum response position. 3 The excess energy wastes as heat, which may lead to low efficiency in solar cells. For the sake of minimizing the energy losses, down conversion (DC) and up conversion (UC) are proposed for solar spectral modulation as useful ways. 4
The solar spectrum can be modulated by phosphors which could transfer the underutilized sunlight to efficient 900−1100 nm near-infrared (NIR) emission where the silicon-based cells have optimal response. 5 At present, NIR is realized by using ion pair mainly include Tb3+-Yb3+, Nd3+-Yb3+, Er3+-Yb3+ and Pr3+-Yb3+. 6–8 They are restricted to narrow absorption cross-section (4 f−4 f transition) and low efficiency. Therefore, a scheme to broaden the absorption cross-section was proposed based on energy transfer (ET): Eu2+ and Ce3+ with allowed 4f−5d broadband absorption were selected as sensitizers, which can efficiently absorb the energy in the ultraviolet-visible (UV–Vis) region and then transfer to other ions (such as Yb3+, Nd3+ and Er3+) with near infrared emission. 9–11 Among them, Nd3+ ions have abundant energy levels and could produce intense NIR emission in optimum 900−1100 nm region originated from 4F3/2 → 4I9/2 (901 nm) and 4F3/2 → 4I11/2 (1060 nm) transitions, where perfectly match well with the band gap (1.12 eV) of silicon solar cells. 12 Nd3+ is limited by narrow band absorption, while the addition of Ce3+ with broad absorption cross-section could widen the absorption band and is expected to enhance near-infrared emission.
Borate has attracted more and more attention act as an excellent phosphor matrix with relative ease of synthesis and excellent stability. For example, Ba3Y2B6O15: Ce3+, NaMgBO3: Ce3+ and Sr3B2O6: Eu2+ borate phosphors have been reported. 13–15 In general, Ce3+ doped borate phosphors can emit blue-violet light, which could be effectively absorbed by Nd3+ ions. Ba3Y(BO3)3 belonging to the large family of Ba3R(BO3)3 (R is a rare earth ion), and Ce3+−Nd3+ co-doped Ba3Y(BO3)3 have not been investigated until now. In this work, Ba3Y(BO3)3: Ce3+, Nd3+ were prepared via traditional solid state reaction. The crystal structure, fluorescence properties and ET mechanism were researched in detail to verify the existence of ET process. Under ultraviolet light excitation, the sample could generate both blue light from Ce3+ and intense NIR emission from Nd3+. Results show that the obtained samples are promising down conversion layer for silicon-based solar cells, which could modify the solar spectra and reduce the energy loss.
Experimental
Ba3Y1–0.01−x (BO3)3: 0.01Ce3+, xNd3+ (x = 0, 0.015, 0.025, 0.035, 0.045, 0.055) samples were prepared via solid-state reaction. All the starting materials including BaCO3 (A.R.), CeO2 (A.R.), H3BO3 (A.R., excess 5 mol% to compensate the loss), Y2O3 (99.99%) and Nd2O3 (99.9%), were weighted by stoichiometric ratio and milled in an agate mortar. It was then fully ground and transferred to corundum crucible. After pre-heating at 500 °C for 5 h, the mixtures were grinded and sintered at 1000 °C for 5 h in CO reducing atmosphere. The final powder products were obtained through orderly cooling down and thoroughly grind.
The crystal structures and phase were carried out on a Rigaku-Dmax 3 C powder diffractometer using Cu-Ka (λ = 1.54056 Å) radiation in the range 10o ≤ 2θ ≤ 60o. The luminescence spectra were measured by an Edinburgh FLS 920 fluorescence spectrometer equipped with a 450 W xenon lamp and near infrared photomultiplier tube (PMT) was cooled by liquid nitrogen system. The decay curves of Ce3+ ion were examined by a 375 nm nanosecond nF 900 flash-lamp. The tests were carried out more than three times to decrease measure error.
Results
Figure 1a depicts the XRD patterns of the different doped samples calcined at 1000 °C for 5 h and the standard profile for Ba3Y(BO3)3 (JCPDS 51-1849) used as reference. It has been reported that Ba3Y(BO3)3 has two structures. The low-temperature phase is hexagonal crystal system (P63 cm), which will be converted into the high-temperature phase (trigonal, R 3) under the condition of 1148 °C high-temperature synthesis. 16–18 The comparison shows that the obtained compound has the structure of low-temperature Ba3Y(BO3)3 phase belonging to an hexagonal lattice (space group: P63 cm). The diffraction peaks of all phosphors are consistent with those in the standard card JCPDS 51-1849, which indicates that the prepared phosphors are pure phases and the doped rare earth ions of Ce3+ and Nd3+ completely enter the lattice of matrix without any extra peaks. Figure 1b shows the schematic illustration of Ba3Y(BO3)3 structure plotted with Diamond software. Structurally, the Ba3Y(BO3)3 is composed of the BO3 triangle and the YO6 octahedron (the blue groups), as well as the BaO9 polyhedron. 19 The plane formed by BO3 triangle divides the Y and Ba sites. Furthermore, Ba with nine oxygens occupies four lattice sites as shown the ball-and-stick structure model in Fig. 1c. There are two types of Y atom coordinates to 6 O, forming two different YO6 octahedrons as shown in Fig. 1d. In addition, the Ce3+ and Nd3+ (RCe3+ = 1.01 Å, RNd 3+ = 0.98 Å, CN = 6) ions can be expected to take up the sites of Y3+ (RY 3+ = 0.90 Å, CN = 6) in this system due to their closer ionic radius and identical valency.
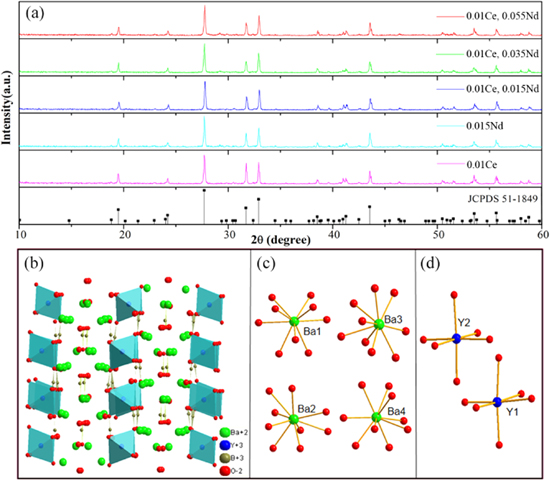
Figure 1. (a) XRD patterns of samples with standard profile for Ba3Y(BO3)3 (JCPDS 51-1849), simulated crystal structure of (b) Ba3Y(BO3)3, (c) Ba and (d) Y.
Download figure:
Standard image High-resolution imageFigure 2 exhibits the photoluminescence spectra of Ba3Y(BO3)3: 0.01Ce3+ and Ba3Y(BO3)3: 0.01Ce3+, 0.015Nd3+. For Ce3+ singly doped phosphor, the excitation band ranges from 280 to 400 nm including two significant broad bands assigned to the 4 f−5d transition. 20 Under the excitation of 356 nm, the sample produces the typical double-peak emission of Ce3+ ions in 370−600 nm originating from two luminescence centers. 21
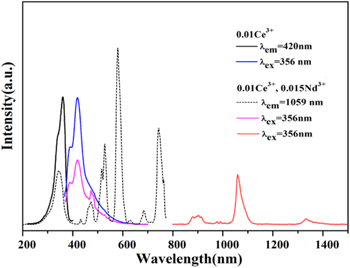
Figure 2. Photoluminescence spectra of Ba3Y(BO3)3: 0.01Ce3+ and Ba3Y(BO3)3: 0.01Ce3+, 0.015Nd3+ samples.
Download figure:
Standard image High-resolution imageComparing the single-doped and co-doped Ba3Y(BO3)3 samples, it was obvious that under the monitoring of Ce3+ ion at 420 nm and Nd3+ ion at 1059 nm, the profile of excitation band in 280−400 nm was similar except for the difference in relative intensity. 22 In other words, the excitation spectrum of Ce3+ ion could be obtained by monitoring the 1059 nm emission of Nd3+, which verifies the occurrence of ET in the Ce3+- Nd3+ samples. Moreover, the visible excitation peaks of Nd3+ ions overlapping well with the emission of Ce3+ included 441, 473, 527, 582 and 698 nm are also observed by monitoring at 1059 nm, which should be assigned to the 4I9/2 → 4D5/2, 4I9/2 → 2G9/2, 4I9/2 → 4G7/2, 4I9/2 → 4G5/2 and 4I9/2 → 4F9/2 transition. 23 Therefore, Nd3+ can broaden the range of absorption from ultraviolet region to visible and near-infrared region enhancing the utilization of solar spectrum. Under 356 nm excitation, the samples emit visible light from Ce3+ and Nd3+, as well as NIR emission from Nd3+ in 850−1500 nm peaked at 901 nm (4F3/2 → 4I9/2), 1059 nm (4F3/2 → 4I11/2) and 1340 nm (4F3/2 → 4I13/2). 24 Here Ce3+ ions act as sensitizer for Nd3+ ions, Ce3+ ions absorb the energy of near-ultraviolet excitation light, which could transfer the 4 f electrons of ground state to the excited state, then emit blue violet light. Another part of the energy transfer to the nearby Nd3+, which emit visible light and NIR light in 850−1500 nm region.
Figure 3 displays the visible and NIR emission spectra of Ba3Y(BO3)3: 0.01Ce3+, xNd3+ (x = 0, 0.015, 0.025, 0.035, 0.045, 0.055) samples. With the increase of Nd3+ doping, the visible emission of Ce3+ and Nd3+ ion reduce gradually. However, the NIR emission of Nd3+ ions rises first and then drops continuously after x = 0.035 because of concentration quenching. 25,26 The gradual decrease of visible light emission intensity indicates the existence of ET from Ce3+ to Nd3+. The illustration clearly illustrates the relationship between normalized integrated emission and doping concentration, and the optimal doping concentration of Nd3+ ion is 0.035.
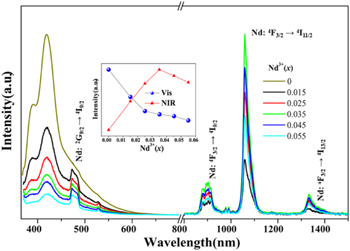
Figure 3. Visible and near-infrared emission spectra of the Ba3Y(BO3)3: 0.01Ce3+, xNd3+ (x = 0, 0.015, 0.025, 0.035, 0.045, 0.055) samples (λex = 356 nm). The inset displays integrated intensity of Vis / NIR emission.
Download figure:
Standard image High-resolution imageIn order to illustrate that Ce3+ ion could sensitize Nd3+ ion and the existence of ET process, Fig. 4 displays the NIR emission spectra comparison diagram of Ba3Y(BO3)3: 0.035Nd3+ and Ba3Y(BO3)3: 0.01Ce3+, 0.035Nd3+ samples. Under the 356 nm excitation, the emission intensity of Nd3+ singly doped phosphor is much weaker than that from corresponding Ce3+-Nd3+ sample. Furthermore, integrated intensity of the NIR emission in Ce3+-Nd3+ sample is 1.6 times of the single-doped sample when the Nd3+ doping content x = 0.035, which proves that effective energy transfer occurs. The phenomenon reveals that Ce3+ ion act as an efficient sensitizer for Nd3+ with strong broadband absorption, which could absorb the underutilized high-energy UV–Vis photons and convert to available low energy NIR photons by the ET process. The Ce3+-Nd3+ co-doped Ba3Y(BO3)3 could serve as a potential DC solar spectral convertor based on spectra modulate to improve optimal NIR emission in 900−1100 nm region.
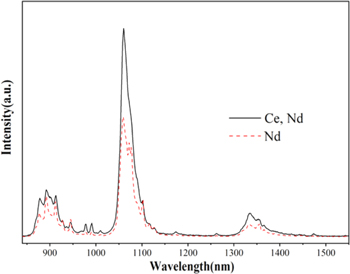
Figure 4. NIR emission spectra of 0.035Nd3+ and 0.01Ce3+, 0.035Nd3+ samples (λex = 356 nm).
Download figure:
Standard image High-resolution imageFigure 5 shows the decay curves of Ce3+ emission depend on Nd3+ (x) dosage with the 375 nm excitation. The average lifetime (τ) could be calculated by: 27

Here, I(t) is fluorescence intensity. The decay rate of Ce3+ becomes faster and the decay curves shift to multi-exponential due to the doping of Nd3+ (x) would cause else decay pathway. 28 Base on the fitted fluorescence attenuation curve, the decay lifetime of Ce3+ are calculated to be about 11.46, 7.27, 6.92, 6.55, 6.07 and 5.67 ns for x = 0, 0.015, 0.025, 0.035, 0.045 and 0.055, respectively. The ET efficiency (ETE, ηETE) from Ce3+ to Nd3+ could be described as: 29

in which τx and τ0 represent the lifetime of Ce3+ in the presence and absence of Nd3+ doping. By the calculation, the ηETE are 36.6%, 39.6%, 42.8%, 47.0% and 50.5% for x = 0.015−0.055. With the addition of Nd3+ ions, the decay lifetime decreases monotonically and the corresponding ETE increases gradually. It is further proved that the occurrence of ET between Ce3+ and Nd3+. When the doping amount of Nd3+ ions is 0.055, the energy transfer efficiency reaches a maximum of 50.5%.
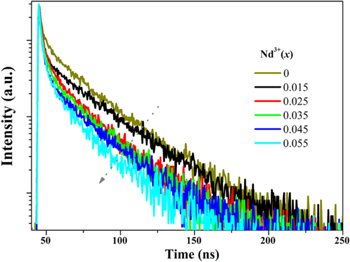
Figure 5. Decay curves of Ce3+ emission in Ba3Y(BO3)3: 0.01Ce3+, xNd3+ samples under excitation of 375 nm.
Download figure:
Standard image High-resolution imageBased on the above-mentioned results, the schematic diagram with probable energy transfer routes in Ba3Y(BO3)3: Ce3+, Nd3+ sample are depicted in Fig. 6. The electrons on the 4 f levels of Ce3+ ions could be excited to the 5d excited state with the UV excitation, then some energy from the 5d1 and 5d2 excited states returns to the ground state through radiation transition along with emitting blue violet light. At the same time, the other part of the energy can be transferred to the acceptor energy levels of Nd3+ ions through ET. Some of the energy further relaxes to 4F5/2 level mainly through non-radiatively decay, and then jumps to 4I9/2, generating emission with wavelength of 769 nm. While the other part through the radiation-free relaxation relaxes to 4F3/2 energy level, and then transits to 4IJ/2 (J = 9, 11, 13), respectively producing 900, 1059 and 1340 nm near-infrared emission. 30–32 Therefore, Ce3+-Nd3+ ion pair can convert a high-energy near-ultraviolet photon to a near-infrared photon matching the silicon band gap through ET process, thus effectively enhance the utilization of high-energy photons.
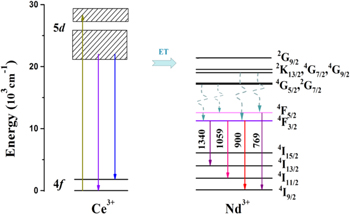
Figure 6. Schematic energy level diagram of the Ce3+, Nd3+ codoped samples.
Download figure:
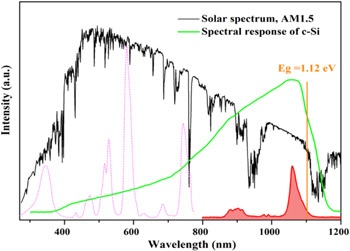
Standard image High-resolution imageFor better describing the spectra, Fig. 7 depicts the PLE (pink line) and NIR emission spectra (red area) of Ba3Y(BO3)3: Ce3+, Nd3+ phosphor along with solar spectrum. According to spectral response curve of crystal silicon solar cells, most high-energy short-wave photons less than 500 nm are almost underutilized. 4 As can be seen, the co-doped phosphor absorbs inefficient sunlight less than 400 nm, and achieves intense dominant NIR long-wave photons around 1000 nm matches well with silicon solar cells. Moreover, the absorption range expands to the visible region by doping Nd3+ ions. Hence, Ba3Y(BO3)3: Ce3+, Nd3+ phosphor is a potential solar spectral convertor, which could modify UV–Vis photons to beneficial NIR photons and reduce energy loss by spectra modulation.
Figure 7. PLE (pink) and NIR emission spectra (red) of Ba3Y(BO3)3: Ce3+, Nd3+ phosphor. The backgrounds are spectral response curve and AM 1.5 G solar spectrum.
Download figure:
Standard image High-resolution image
Conclusions
In summary, NIR emitting phosphor Ba3Y(BO3)3: Ce3+, Nd3+ has been successfully prepared using solid state reaction. Under 356 nm excitation, Ce3+ ion act as an efficient sensitizer could absorb the underutilized high-energy photons in 280−400 nm and convert to optimal NIR photons (850−1100 nm) matching the silicon band gap. In particular, the NIR emission of Ce3+ −Nd3+ sample was improved in contrast to Nd3+ single-doped sample. Fluorescence lifetime properties and possible ET mechanism were also investigated, which further confirm the existence of ET process from Ce3+ to Nd3+. The highest ηETE is 50.5% when the doping of Nd3+ is 0.055. The results indicate that Ba3Y(BO3)3: Ce3+, Nd3+ is a promising NIR down conversion converter with broad absorption cross-section for silicon-based solar cells.
Acknowledgments
This work was supported by National Natural Science Foundation of China (No. 11804265), Natural Science Foundation of Shaanxi Province (No. 2020JQ-656, 2018JQ1048), Talents Foundation of Xi'an University of Architecture and Technology (No. RC1809), College Students' Innovation and Entrepreneurship Training Programs (No. S201910703018).