Abstract
Lithium-sulfur (Li-S) batteries promise improved capacities over lithium ion batteries. While currently mostly metallic lithium anodes are used, the use of silicon-anodes might offer better safety and durability. However, in a lithium-sulfur-Silicon (Li-S-Si) battery, lithium must be introduced either on the anode or on the cathode in form of Li2S. In this study, we have prepared Li2S cathodes in combination with Si anodes (i.e., Si/Li2S full-cells) to investigate both the processes during initial charging/activation of Li2S cathodes and the effect of Li2S cathode activation on the cycling performance of Si/Li2S full-cells. We observed that the initial activation requires a substantially higher charging potential than for the subsequent cycles. In situ XRD analysis of the cathode during the first cycle clearly indicates the gradual transformation of Li2S to polysulfides and finally to crystalline sulfur, i.e., even large Li2S particles (≈20 μm) can be charged completely. The result is further confirmed by ex-situ SEM/EDS analysis, which revealed the formation of large sheets of sulfur at the cathode/separator interface. Similar cycling performance of Si/Li2S full-cells is observed at both 0.1 C and 1 C rates, a clear advantage over Li/Li2S cells, which suffer from severe dendrite formation at 1 C in the case of high Li2S loadings.
Export citation and abstract BibTeX RIS

This is an open access article distributed under the terms of the Creative Commons Attribution 4.0 License (CC BY, http://creativecommons.org/licenses/by/4.0/), which permits unrestricted reuse of the work in any medium, provided the original work is properly cited.
High capacity energy storage systems are needed for various applications ranging from portable electronic devices to automotive applications. For the latter, a safe onboard energy storage system that can provide sufficient driving range is needed. However, the specific energy of current intercalation based lithium ion batteries (≈250–280 Wh/kgcell) substantially limits the driving range compared to that of conventional fuel vehicles1,2 so that batteries offering higher specific energy are required.
Lithium-air (Li-O2)3 and lithium-sulfur (Li-S)4,5 batteries are among the most widely explored so-called post-lithium ion technologies, for which the lithium ions in the cathode react with either oxygen or sulfur during discharge, resulting in Li2O2 or Li2S discharge product, respectively. Considering the high theoretical specific energy of these post-lithium ion cathodes on the active materials level (viz., ≈3.5 kWh/kgLi2O2 for Li-O2 and ≈2.5 kWh/kgLi2S for Li-S1), they are very promising for use in electric vehicles, even though the specific energy gains over lithium ion batteries if compared on the battery system level are substantially lower.6 However, there are still several major issues to be resolved. In the case of Li-O2 batteries, these include the poor charge/discharge reversibility7,8 as well as the poor stability of electrolytes9–11 and of the catalyst support.12 Similarly, Li-S batteries are still plagued by an irreversible loss of active sulfur species, by polysulfide shuttling, and by the continuous electrolyte consumption at the lithium electrode.13,14 Nevertheless, Li-S battery performance/durability has improved significantly over the last few years, mainly by optimizing composite cathodes prepared of sulfur and carbon nanostructures,15 carbon fibers,16 and metal oxides like MnO2 and titanium sub-oxides17,18 as well as by optimizing electrolytes.19,20 With these improvements, Li-S half-cells have reached reversible capacities of >800 mAh/gS after several hundreds of cycles.21
Studies in the field of Li-S batteries have mostly been demonstrated by using metallic lithium as anode, which typically is not used in commercial rechargeable batteries with liquid electrolytes because of safety issues.22 Alternatives to the metallic lithium anode have been widely investigated during the last three decades, focusing mainly on carbon, silicon, and tin.23 Among these, graphite is widely used as anode material in current Li-ion batteries, but it has a relatively low specific capacity (≈372 mAh/gC)22 and is thus not suitable in combination with high capacity cathodes such as sulfur. In contrast, Si offers a high specific capacity (3580 mAh/gSi for the electrochemically reversible Li15Si4), but due to its large volume expansion during charging, it suffers from both mechanical degradation and continuous electrolyte consumption due to the instability of the SEI (solid electrolyte interface) on the expanding/contracting silicon surface during charge/discharge. The latter can be partially mitigated by using nanostructured Si (nanowires, nanotubes, nanoparticles, etc.).24,25
One approach to use silicon anodes instead of metallic lithium is to use Li2S (lithium sulfide) rather than S cathodes.26–28 Unfortunately, there are very few studies on full-cells with Li2S cathodes and high capacity Si or Sn anodes. In one study, Li2S/C composites were prepared by milling commercially available Li2S with carbon and testing it in a full cell with a Sn/C composite anode using a polymer electrolyte.28 Another frequently employed approach to prepare a full-cell with a Si anode and a S cathode is through electrochemical pre-lithiation of the Si anode prior to full-cell assembly with a S cathode, as demonstrated by Elazari et al.29 On the other hand, Lui et al. pre-lithiated silicon nanowire electrodes by physically contacting them with metallic lithium and subsequently assembling them into full-cells using S cathodes.30 More recently, Brückner et al. pre-lithiated Si-coated carbon and cycled it against a S cathode with a remaining capacity of ≈400 mAh/gS after >1000 cycles.31
In the present study, we have demonstrated full-cell cycling of a Li2S cathode coupled with a Si/C anode, examining the effect of the initial Li2S cathode activation process and comparing full-cell performance with that of Li2S half-cells (i.e., using a metallic lithium anode). In situ XRD and post-mortem SEM/EDX in combination with three-electrode measurements are used to elucidate the Li2S activation process.
Experimental
Preparation & characterization of Li2S cathodes
Commercially available Li2S powder (Sigma Aldrich) was used as-received to prepare Li2S cathodes. The Li2S particle size ranged from few hundreds of nanometers to more than 20 micrometer, as shown by the SEM image in Fig. 1a; particle size analysis by laser scattering (not shown) indicated a median diameter of ≈10 μm (volume-averaged distribution). The ink for the electrode coating was prepared by mechanically mixing the Li2S powder with commercial Vulcan XC72 carbon (≈30 nm primary particles and ≈200–300 nm primary agglomerates) using a mortar and pestle, followed by dispersion in a solution of N-Methyl-2-pyrrolidone (NMP) with dissolved polyvinylidene fluoride (PVDF) for two hours using a high speed magnetic stirrer. The solids content of the ink was approximately 150 mg (Li2S+C+PVDF) per milliliter of NMP, with a solids composition of 60%wt Li2S, 30%wt C, and 10%wt PVDF. The ink was coated onto an 18 μm thick aluminum foil using a 300 μm gap doctor blade. Because of the high reactivity of Li2S with moisture, all the processing steps were carried out inside an Ar-filled glove box (MBRAUN; <1 ppm H2O & <1 ppm O2). After drying inside the glove box, 10 mm diameter electrodes were punched out and further dried at 80°C under dynamic vacuum in a Büchi oven for 2 hours. For all the measurements, the Li2S loading in the cathode was maintained at ≈2.0 ±0.1 mgLi2S/cm2 (≡ 2.3 ±0.1 mAh/cm2 theoretical capacity). Morphological characterization of the cathode electrodes was carried out using SEM-EDS (JEOL, JSM 6000 equipped with EDS) using an air-tight specimen holder to transfer samples from the glove box to the SEM chamber.
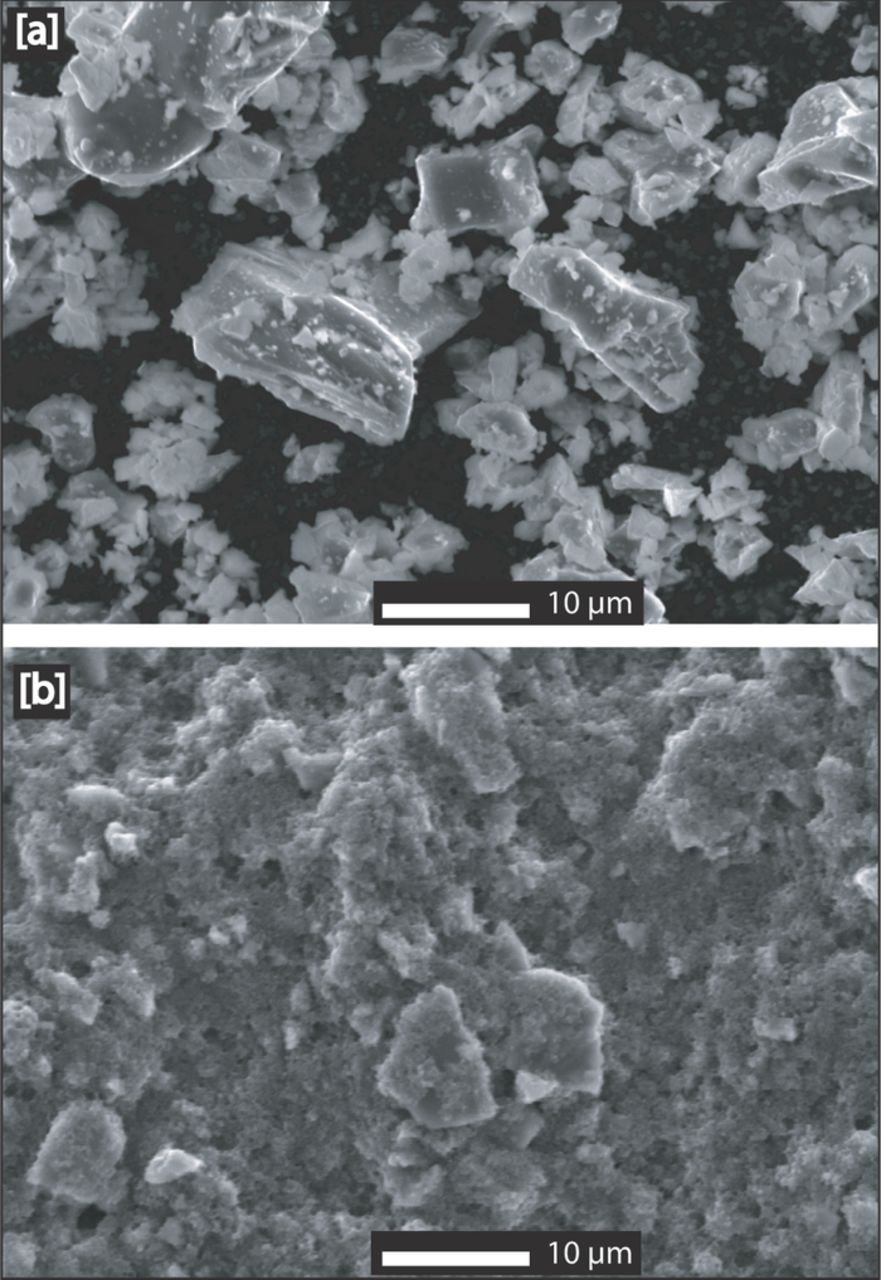
Figure 1. SEM images of [a] commercial Li2S particles used in this study; [b] surface morphology of a dried Li2S cathode. The scale-bar in the images corresponds to 10 μm.
Silicon/carbon anodes
The Si anodes used in this study contained 20%wt nano-silicon particles, 60%wt graphite, 12%wt conductive carbon-black, and 8%wt Na-CMC binder, supported on a Cu-foil current collector (Si anodes were provided by Wacker Chemie AG). The areal weight of the anode electrodes was 2.2 mg/cm2 (including Si, graphite, carbon-black, and binder). Assuming specific capacities of 3580 mAh/gSi,32,33 372 mAh/ggraphite, and 150 mAh/gcarbon-black,34 the theoretical capacity of the Si/C anodes equates to 2.1 mAh/cm2. Anodes were punched out with a diameter of 10 mm (i.e., 0.785 cm2).
Electrochemical characterization
All electrochemical testing was conducted in a Swagelok type cell using DOL:DME (1:1 v/v) with 1 M LiTFSI and 0.5 M LiNO3 electrolyte; the amount of electrolyte was normalized to ≈40 μl/cm2 for Li/Li2S or Li/Si half-cell measurements, and to ≈35 μl/cm2 for Si/Li2S full-cell measurements. Three layers of Celgard C480 were used as a separator. Most experiments were conducted in a two-electrode configuration, except in few specifically mentioned instances when a three-electrode configuration with a metallic lithium reference electrode was used. The cells were cycled galvanostatically (BioLogic VMP3 potentiostat) at different currents (rates) between 1.7 and 3.0 VLi for Li/Li2S half-cells, between 0.02 and 1.5 VLi for Li/Si half-cells, and between 1.3 and 2.6 Vcell for Si/Li2S full-cells. Before cycling the cells, the Li2S cathodes were initially activated by charging them up to 4.0 VLi for half-cells (Li/Li2S) and 3.8 Vcell for the full-cells (Si/Li2S). All cells were cycled in a climatic chamber at 25°C.
In situ XRD measurements
A specially designed cell was used for the in-situ X-ray diffraction measurements, in which the aluminum current collector of the cathode electrode served as X-ray window. X-ray diffraction (XRD) patterns were recorded using a STOE Stadi P diffractometer equipped with a linear position-sensitive detector (Dectris Mythen 1 K) and a Mo Kα source (50 kV of tube voltage and 20 mA current) in a Bragg-Brentano configuration. Each diffraction pattern was measured in three ranges with a step size of 15° (2θ = 4–18°, ω = 6.5° fixed). The 2θ range was chosen so that the reflections from the aluminum window do not interfere with the reflections of the Li2S. The exposure time for each range was 180s, equating to an acquisition time of 9 minutes for a complete in-situ diffractogram.
Results and Discussion
Commercially available Li2S powder with particle size up to ≈20 μm (Figure 1a) was used to prepare the cathode electrodes. Since the ink for the cathode was prepared by stirring, i.e., without exposing to strong shear forces during mixing, one would expect a similar Li2S particle size distribution in the cathode. This is indeed the case, as illustrated by the electrode surface morphology shown in Figure 1b, where large particles are ascribed to non-fractured Li2S particles.
Li/Si half-cell characterization
Figure 2a shows the initial five charge/discharge cycles of the Si anode in a Li/Si half-cell at a rate of C/4.5 (referenced to the theoretical Si/C anode areal capacity of 2.1 mAh/cm2, and corresponding to a geometric current density of 0.46 mA/cm2). It can be observed that the very first lithiation capacity (red dashed line in Fig. 2a) reaches the calculated theoretical capacity (see Experimental section), following a potential profile which is characteristic of crystalline silicon.33 After the first lithiation and delithaiation cycle, the specific lithiation and delithiation capacity decreases to a constant value of ≈1.8 mAh/cm2, corresponding to ≈85% of the theoretical areal capacity of the composite anode. The higher capacity observed in the first lithiation is attributed to SEI formation on the Si surface. The potential profile of the subsequent lithiation cycles is different from the first one, reflecting the typical lithiation profile of amorphized silicon.33 As shown in Figure 2b, the 2nd cycle lithiation/delithiation capacities for these Si/graphite composite anodes is nearly independent of rate between C/18 and C/4.5. Overall, from these results it can be concluded that the reversible capacity of the Si anodes in our study is ≈1.8 mAh/cm2 (within the first four cycles after the initial formation) and does not change significantly within the measured range of C-rates.
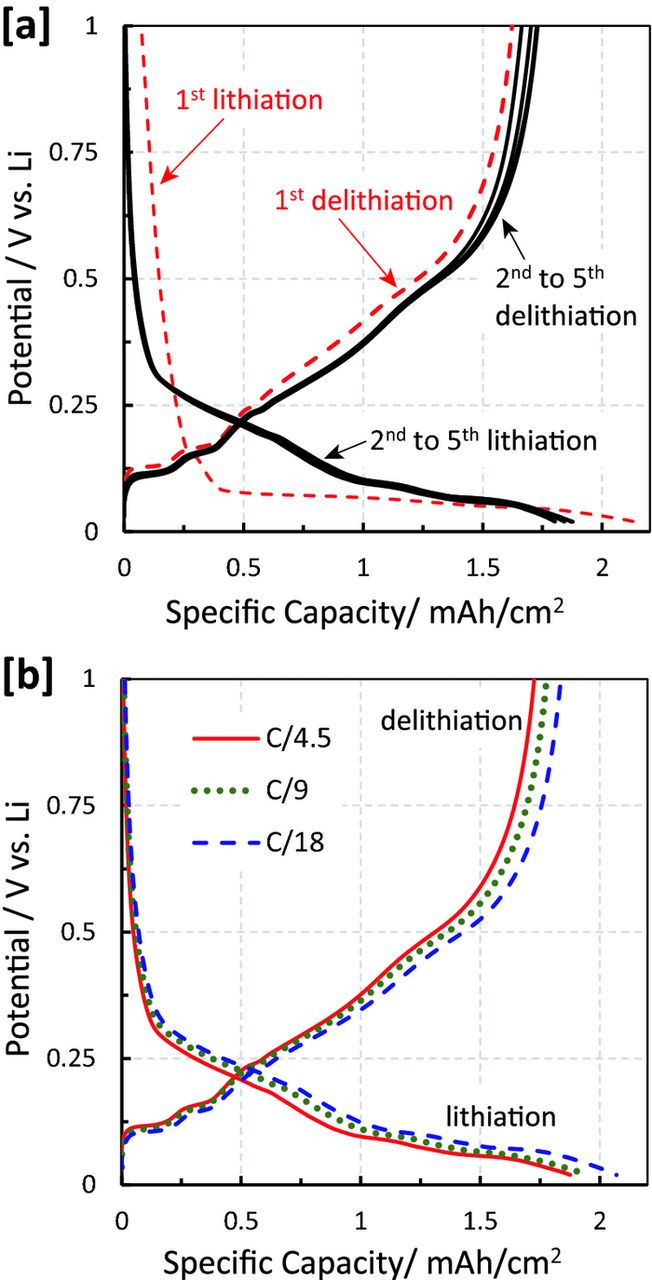
Figure 2. Galvanostatic lithiation and delithiation of the Si/C composite anode electrode (Li/Si half-cells). [a] 5 cycles of lithiation and delithiation at C/4.5, and [b] comparison of the 2nd cycle at C/4.5, C/9, and C/18. The C-rates are calculated based on the theoretical capacity of 2.1 mAh/cm2 for the Si/C anode. The cells were cycled in DOL:DME (1:1 v/v) with 1 M LiTFSI and 0.5 M LiNO3.
Activation of Li2S in Li/Li2S and Si/Li2S cells
Similar to the initial high-potential activation required during charging of Li2O2 pre-filled cathodes in the case of Li-O2 batteries,35 we found that the initial charging of Li2S cathodes also requires activation at higher potentials. This observation was reported also by Yang et al.,26 who showed that a ≈1 V overpotential is required during the first charge of a Li/Li2S half-cell in comparison to charging a discharged Li/S cell, which they ascribed to the initial barrier of forming soluble polysulfides in the electrolyte, which in turn serve as an electron shuttle between the electronically conductive carbon matrix and the Li2S particles. Consistent with this hypothesis, Meini et al.36 found that the high potential required in the first charging step of Li2S cathodes can be eliminated in the presence of redox-active additives. Figure 3a shows the initial charging of a Li2S cathode against a Li anode (Li/Li2S half-cell) at rates of C/10 (blue line) and 1 C (red line), with the voltage initially increasing to potentials of ≈3.4 VLi and ≈3.9 VLi, respectively, followed by a sharp decrease to a lower voltage plateau region. At the rate of C/10 (blue line), two charging plateaus at ≈3.2 and at ≈3.5 VLi are observed until the charging capacity approaches its theoretical value of 1165 mAh/gLi2S, at which point the voltage increases to ≈4.2 VLi, where the current is sustained by the continuous oxidation of the DOL/DME electrolyte. On the other hand, at a rate of 1 C, the charging voltage strongly fluctuates and the charging process continues indefinitely between 2.5 and 3.5 VLi, which we ascribe to the intermittent formation of lithium dendrites at this rather high current density of 2.3 mA/cm2 (dendrite formation was shown to occur by Aurbach et al.37 at >1 mA/cm2). This is evidenced by SEM/EDS analysis of the middle separator removed from the Li/Li2S cell after 1C charging (s. Fig. 4a): the separator was severely penetrated by lithium dendrites with a spot-size of 50 μm or more, and EDS mapping shows that these spots have a high oxygen content, indicating lithium oxides, hydroxides, or carbonates formed during air exposure of the separator (the separator was intentionally exposed to air to oxidize metallic lithium dendrites). These results confirm that the high current density during 1 C charging (2.3 mA/cm2) leads to severe dendrite formation if metallic lithium used as anode.

Figure 3. Initial galvanostatic charging of Li/Li2S half-cells [a], and Si/Li2S full-cells [b] at rates of C/10 and 1 C without imposing an upper potential limit. The y-axis (potential) is referenced in both cases against lithium, whereby a two-electrode cell was used in the Li/Li2S half-cell experiments and a three-electrode cell with a lithium reference electrode was used in the Si/Li2S full-cell experiments. The vertical dashed line indicates the theoretical capacity of Li2S. The C-rates are calculated based on Ctheoretical = 1165 mAh/gLi2S for the Li2S cathode. The cells were cycled in DOL:DME (1:1 v/v) with 1 M LiTFSI and 0.5 M LiNO3.
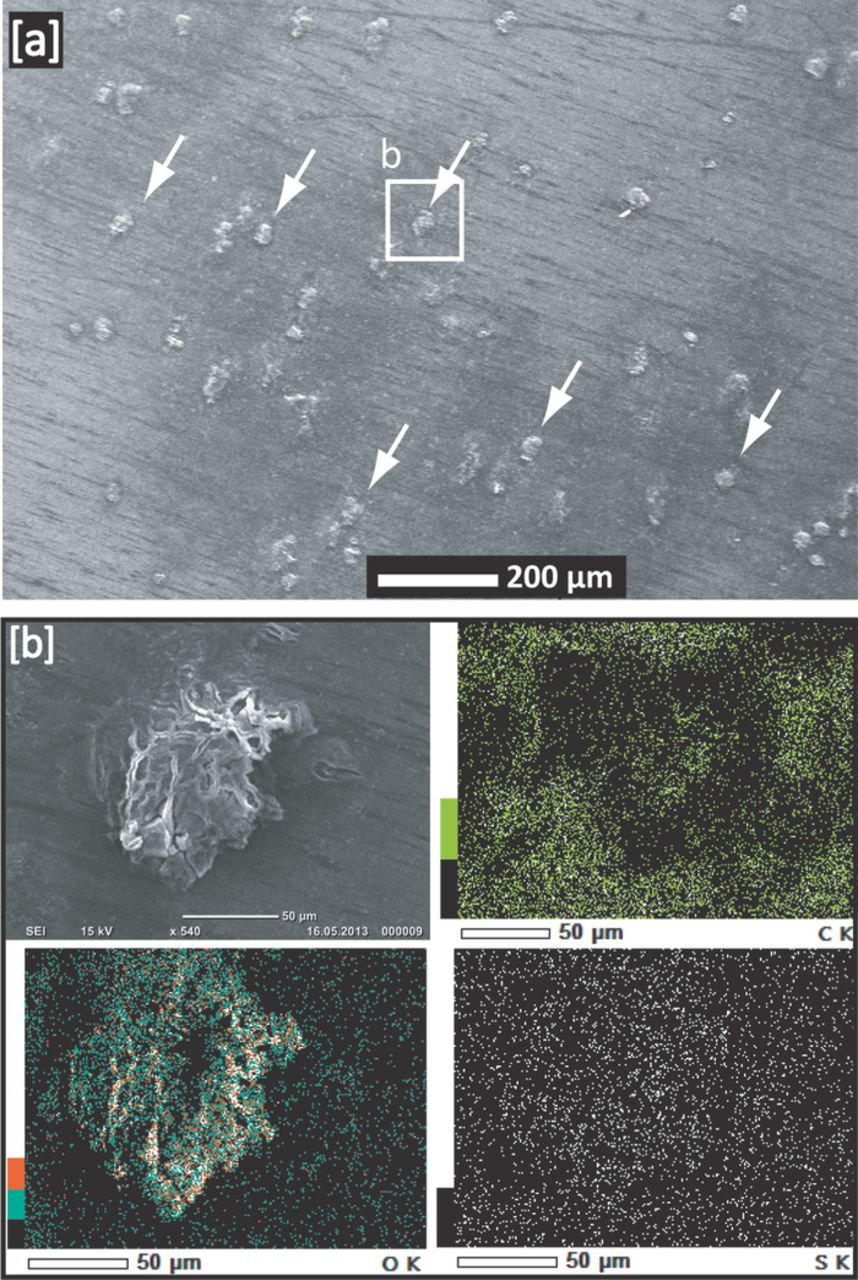
Figure 4. [a] SEM image of the middle separator (out of three layers) of a Li/Li2S half-cell after initial charging at 1 C as shown by the red curve in Fig. 3a. [b] EDS mapping of carbon, oxygen, and sulfur of a lithium dendrite feature in the separator, whereby the high oxygen signal at the location of the dendrite originates from lithium which was deliberately exposed to air in order to oxidize it. The C-rates are calculated based on Ctheoretical = 1165 mAh/gLi2S for the Li2S cathode.
As one would expect, lithium dendrite formation at high C-rate can be avoided during initial charging of a Li2S cathode in Si/Li2S full-cells, as evidenced by the smooth charging profile at 1 C in full-cells shown in Figure 3b (red line), where the potential is referenced against a metallic lithium reference electrode (using a three-electrode cell). Again, the capacity obtained as the potential reaches 4 VLi is close to the theoretical capacity of the Li2S cathode.
In order to confirm that Li2S is oxidized completely during the first activation cycle and to determine whether the lower and upper plateaus at the C/10 charging profile in the Li/Li2S half-cell (blue line in Fig. 3a) are indeed related to Li2S charging, in-situ XRD analysis was carried out with a Li2S cathode and a lithium metal counter electrode. Figure 5a shows the charging potential profile (vs. lithium) for a Li2S cathode at C/10 in the in-situ XRD cell, which is in excellent agreement with the charging profile obtained with a standard Swagelok cell (see Fig. 3a, blue line). The labels placed along the charging curve (letters a - i in Fig. 5a) mark the collection of the XRD diffractograms shown in Fig 5b (note that the diffractograms were acquired over a time of 9 minutes during cell charging). As expected, sharp peaks corresponding to the (111) and (200) diffractions of Li2S are observed at the beginning of the charging process (a in Fig. 5b), then gradually decrease during the first charging plateau at ≈3.2 VLi (b – d in Fig. 5b), and remain visible throughout the second charging plateau of ≈3.5 VLi (e and f in Fig. 5b). The Li2S diffraction peaks only disappear after the second charging plateau, i.e., after having reached 85–90% of the theoretical Li2S charge capacity (g – i in Fig. 5b). This may be compared to the study by Cañas et al.,38 who observed the disappearance of Li2S diffractions during the charge of a discharged S cathode at already ≈50% of the charging capacity, which is most likely due to the much smaller Li2S particles formed during S cathode discharge compared to the ≈20 μm large Li2S particles in our electrodes.
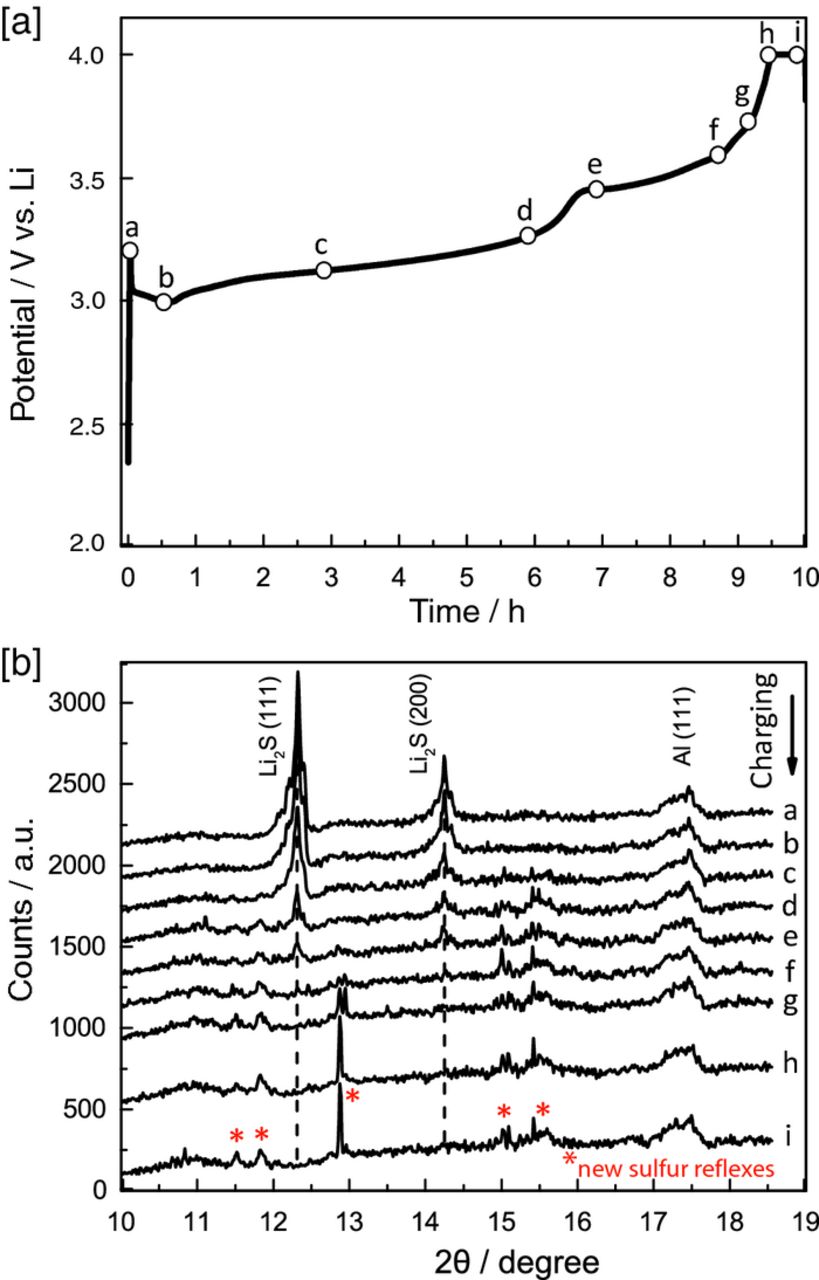
Figure 5. In situ XRD analysis of a Li2S cathode (vs. lithium metal) during initial activation/charging at a rate of C/10 (The C-rate is calculated based on Ctheoretical = 1165 mAh/gLi2S for the Li2S cathode). [a] potential vs. charge profile, and, [b] diffractograms acquired at the positions marked in the charging curve (a – i), with an acquisition time of 9 min.
The appearance and growth of new diffraction peaks (marked by * in Fig. 5b) can be observed at already ≈60% of charging (d in Fig. 5b), developing into sharp diffraction peaks after ≈90% of charging (g in Fig. 5b), which suggests the formation of large crystallites. These peaks must be related to the formation of crystalline sulfur, even though their positions do not exactly match the PDP database, indicating the formation of a new crystalline phase of sulfur. A similar observation was reported by Cañas et al.,38 who reported sulfur reflections after ≈90% of charge of a previously discharged sulfur cathode, with diffraction patterns which were also different from the PDP database. Furthermore, Nelson et al.39 also observed the formation of crystalline sulfur after ≈80% charging of a discharged sulfur cathode. These findings, however, contradict the in-situ XRD study by Yang et al.,26 where no crystalline sulfur is observed even after complete charging of their Li2S cathode; the origin of this discrepancy is unfortunately not clear.
In summary, the analysis of Figure 5 suggests that the charging process in the first plateau at ≈3.2 VLi, which extends to ≈60% of the charging, can be assigned to the transformation of Li2S to lithium polysulfides and possibly small amounts of sulfur, as the potential is sufficiently high to oxidize polysulfides to sulfur. After the second charging plateau (g in Fig. 5), all Li2S diffraction peaks have vanished and sharp diffraction peaks related to crystalline sulfur appear (at around 2θ = 12.8°), indicating the formation of large sulfur crystallites in the charged Li2S cathode.
The formation of large crystalline sulfur domains after charge of the Li2S cathode was verified by ex-situ SEM/EDS analysis of the Li2S cathode after charging to a cutoff potential of 4VLi at C/10, i.e., after nearly 100% of the theoretical charge was obtained. For this investigation, the cell was disassembled inside a glove box, washed with DME to remove any residual polysulfides from the cathode, and then the electrode transferred into ambient air in order to convert potentially remaining Li2S into Li2CO3, LiOH, and Li2O; subsequently, the sample was transferred into the SEM. Strikingly, as shown in Fig. 6a, the surface of the cathode was covered with large sheets of sulfur, as confirmed by the EDS elemental mapping: the sulfur map matches the SEM image (compare Figs. 6a and 6c), while no common patterns are observed between the oxygen map and the SEM image (compare Figs. 6a and 6d), which after air exposure could only be the case for elemental sulfur. The sulfur sheets extend over several hundreds of micrometers across the cathode surface, whereby imprints from the separator can be observed on the sulfur sheets. The cross-section of the cathode was examined after bending of the electrode, as shown in Fig. 6b. Empty pockets inside the cathode electrode can be clearly seen, the sizes of which are consistent with the initial size of the Li2S powder used to prepare the Li2S cathode, which is consistent with the absence of Li2S diffraction peaks after charging (s. Fig. 5).
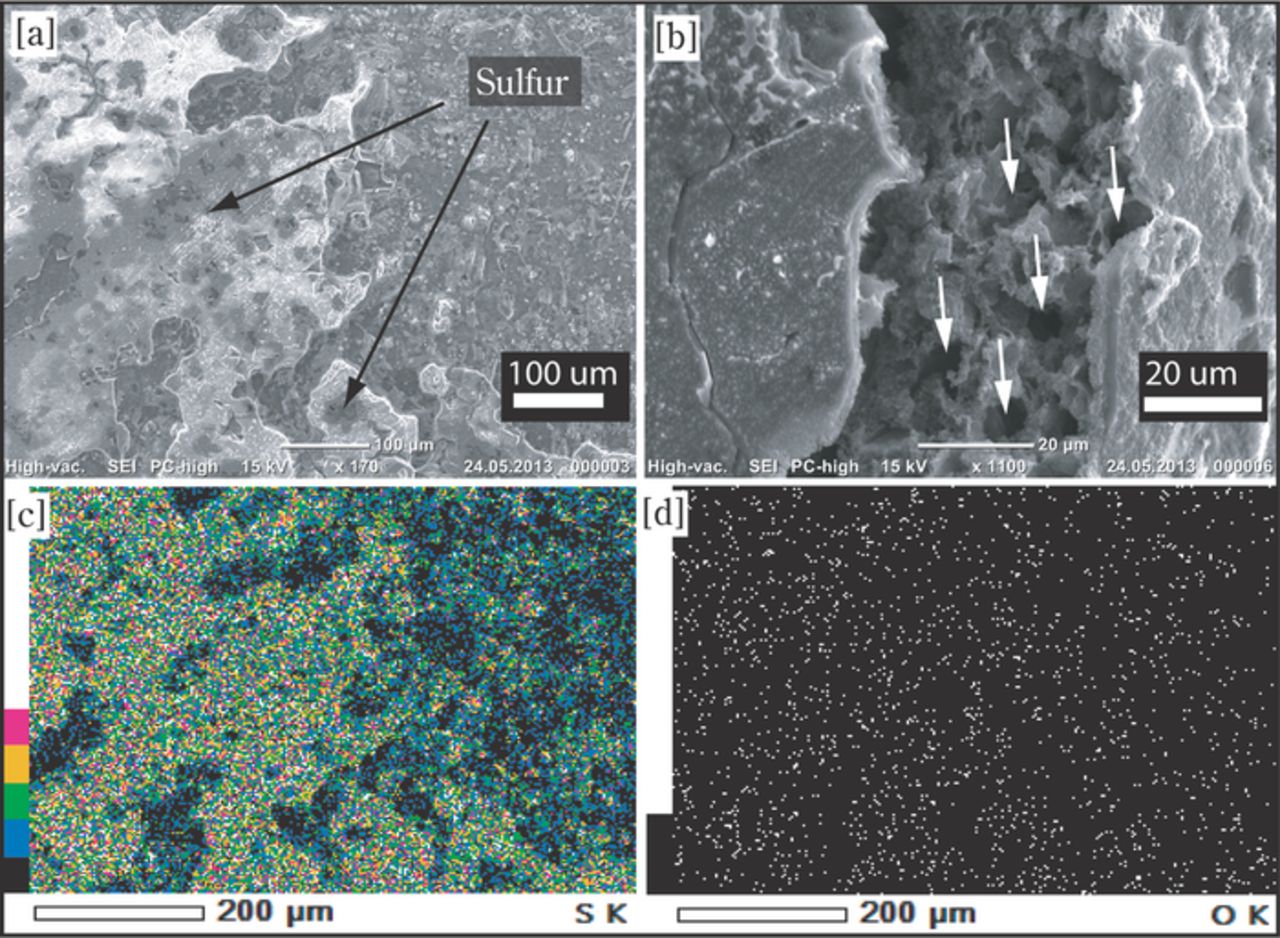
Figure 6. SEM/EDS analysis of an Li2S cathode after charging to 4.0 V at C/10 vs. a Li-anode. [a] SEM image of the cathode, showing a compact sheet of sulfur covering the surface. [b] SEM image inside a crack (made intentionally by bending the cathode) of the cathode electrode, showing empty pockets in the cathode electrode layer. EDS elemental mapping of the surface shown in [a] is given for sulfur and oxygen in [c] and [d], respectively. (The C-rate is calculated based on Ctheoretical = 1165 mAh/gLi2S for Li2S cathode).
Analogous to our study, the formation of large crystalline sulfur domains at the cathode/separator interface upon charging of a discharged sulfur electrode was also observed by Cañas et al.,38 albeit with different shapes/morphology. We believe that the accumulation of sulfur at the cathode/separator interface during the last stages of the charging process is most likely due to the oxidation of dissolved polysulfides (solubilities of 0.1 to 1 mol/l in the electrolyte) contained inside the separator (rather than inside the cathode) during the final stages of charging: under this condition, the high cathode potential will cause the rapid and highly localized oxidation of polysulfides which are stored inside the separator region once they reach the cathode/separator interface, thereby forming a deposit at this very interface.
Activation and cycling of Si/Li2S full-cells
The activation and subsequent cycling of Si/Li2S full-cells was investigated using Si/C anodes and Li2S cathodes of theoretical capacities of ≈2.1 and ≈2.3 mAh/cm2, respectively. In order to monitor the charge/discharge behavior of each electrode, the Si/Li2S full-cells were assembled with a metallic lithium reference electrode in a three-electrode cell. The questions to be addressed were: i) whether the polysulfide shuttling currents would be low enough to allow for a complete charging of the Si/C anodes; ii) whether the high voltages at 1 C activation (≈3.3/≈3.5 VLi in the 1st/2nd charging plateau; red line in Fig. 3b) compared to C/10 activation (≈2.5/≈3.1 VLi in the 1st/2nd charging plateau; blue line in Fig. 3b) would affect the subsequent cycling stability, as activation at lower potentials was suggested to improve cycle-life;36 and, iii) whether the long-term cycling stability of Si/Li2S full-cells would be comparable with that of Li/Li2S half-cells.
The Si/Li2S full-cells were subjected to an initial activation from OCV (≈0.3 Vcell) to a cell voltage of 3.8 Vcell at two different rates, viz., C/10 (Fig. 7a) and 1 C (Fig. 7b), followed by continuous cycling between 1.3 and 2.8 Vcell at C/5 rate. Figures 7a and 7b show the potential variation of the Li2S cathodes vs. Li reference (curve 1, dashed blue line), the cell potential of the Si anodes vs. the Li2S cathodes (curve 2, black line), and the potential of the Si anodes vs. Li reference (curve 3, dashed red line). Examining the first activation cycle at both C/10 and 1 C (initial charging panels in Figs. 7a and 7b, respectively), it is clear that the potential of the Si anodes is gradually lowered to <0.5 VLi, where lithium ion intercalation will occur. The fact that the Si anode potential decreases faster to below 0.5 VLi at 1 C (at ≈120 mAh/gLi2S; dotted red line in Fig. 7b) compared to charging at C/10 (at ≈320 mAh/gLi2S; dashed red line in Fig. 7a) is ascribed to the polysulfide shuttling current, which consumes a larger fraction of the charging current at the lower C-rate. At the end of the activation cycle, the Si anode potentials reach ≈0.1 VLi, which according to Fig. 2b would correspond to a ≈50% charge of the Si anode (≈1 mAh/cm2). The missing charge compared to the expected ≈2.1 mAh/cm2 (s. above) must be caused by the irreversible lithium loss for SEI formation. This is consistent with the only ≈50% theoretical cell capacity obtained in the second discharge/charge cycle at C/5 shown in Fig. 7: ≈550 mAh/gLi2S corresponding to ≈1.1 mAh/cm2 at C/10 and ≈500 mAh/gLi2S corresponding to ≈1.0 mAh/cm2. If compared with the Si anode half-cell data at the same current density (red lines in Fig. 2b), a charge/discharge capacity of ≈1.0–1.1 mAh/cm2 is consistent with the observed Si anode potentials in the 2nd cycle, ranging between ≈0.12 and ≈0.5 VLi (s. C/5 segments in Fig. 7). These results clearly indicate that the capacity of the cell is limited by the Li2S cathode due to a large irreversible lithium loss during the first charging cycle, while only about ≈50% of the anode's capacity is used. Consequently, we expect that the Si/Li2S full-cell performance will improve by applying an excess cathode capacity of QLi2S/QSi between 1.5/1 and 2/1, which we will explore in future experiments.

Figure 7. Cell voltage (left axis) vs. charge (black solid line) of a Si/Li2S full-cell during activation at [a] C/10 and [b] 1 C, followed by cycling at C/5. The experiment was conducted in a three-compartment cell with a Li reference electrode, and the potentials referenced to Li are shown for the Li2S cathode (blue dashed line) on the left axis and for the Si anode (red dotted line) on the right axis. The C-rates are calculated based on Ctheoretical = 1165 mAh/gLi2S for the Li2S cathode.
The Li2S cathode potential profiles during activation (blue dashed lines in Fig. 7) are essentially identical to those shown in Fig. 3b, except that potential oscillations are observed toward the end of the C/10 charging curve (dashed blue line in Fig. 7a). Indeed, we have frequently observed these potential oscillations during charging at low C-rates, and Fig. 7a clearly shows that it is caused by the Li2S cathode and not the anode electrode. The fact that these oscillations appear in the second charging plateau, where we had observed the onset of the formation of crystalline sulfur phases (see Fig. 5) suggests that they are related to the formation of current-blocking sulfur domains at the separator/cathode interface (see Fig. 6). The absence of these oscillations at the higher rate of 1 C would then suggest that the formation of large sulfur sheets might be suppressed at higher rates, which could be explained by fact that the cathode potential in that case is far above the potential required for the complete reduction of polysulfides to sulfur, so that the polysulfide concentration in the separator will remain low (see above discussed hypothesis for the sulfur sheet formation at the separator/cathode interface).
The long-term cycling performance of Si/Li2S full-cells is shown in Fig. 8a (showing the average and the standard deviation of two cells for each test sequence), exploring the effect of C-rate during activation and during long-term cycling on capacity retention: i) initial activation at 1 C followed by cycling at C/5; ii) initial activation as well as cycling at 1 C; and, iii) initial activation at C/10 followed by C/5 cycling. It can be seen that the cells that were activated at C/10 followed by C/5 cycling show somewhat higher capacities (red line in Fig. 8a) compared to the cells which were activated at 1 C and cycled at either C/5 or 1 C (black and gray lines in Fig. 8a). While the difference is small, it might be related to the much lower charging voltages if the initial activation step (i.e., the very first charging cycle) is done at C/10 instead of at 1 C (see Fig. 7), which might prevent the formation of electrolyte decomposition products at the initially high voltages that could compromise cycle-life. The higher coulombic efficiency of the cells cycled at 1 C (gray lines in top panel of Fig. 8a) compared to the cells cycled at C/5, independent of the activation procedure (red and black lines in Fig. 8a), is indicative of significant polysulfide-shuttle currents, which play a lesser role at the higher C-rate. After 70 cycles, the cells activated at C/10 and cycled at C/5 have a remaining capacity of 280 mAh/gLi2S, (≡400 mAh/gS). To our knowledge, our study is the first to examine the long-term stability of Si/Li2S full-cells based on Li2S powder based cathodes and Si based anodes. The only related study is the work by Yang et al.,40 who cycled Si anodes with Li2S cathodes obtained by lithiation of a sulfur cathode with n-butyllithium, observing mych higher capacity fading (to ≈250 mAh/gLi2S after only 20 cycles at a similar rate of C/3).
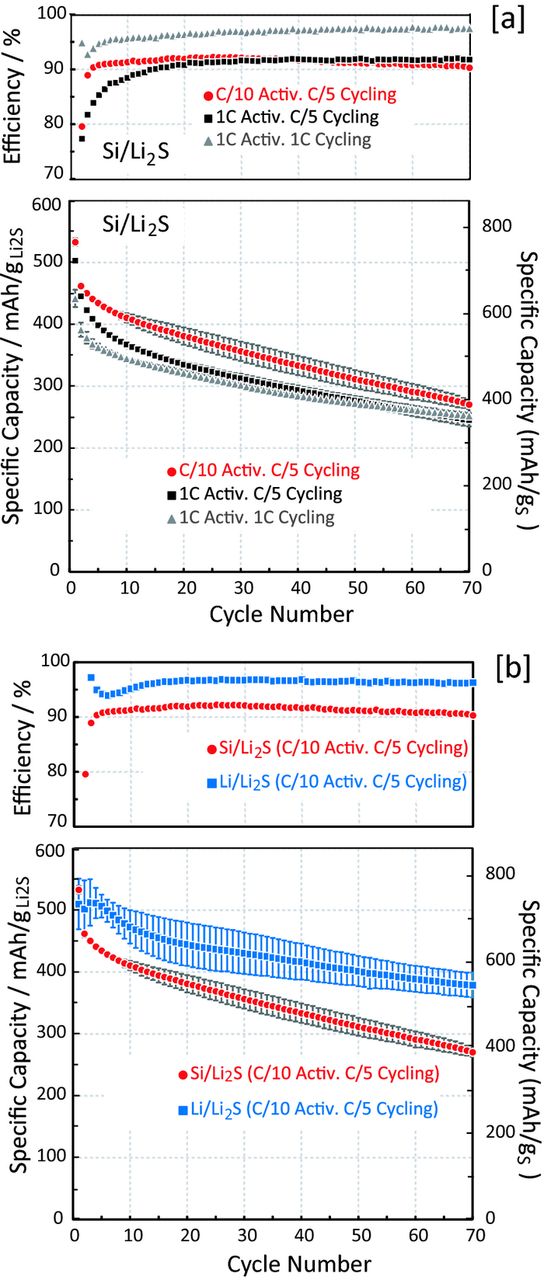
Figure 8. [a] Activation and cycling performance of Si/Li2S full-cells at different rates for the 1st cycle charge ("activation") and different subsequent cycling rates: [a] comparison of Si/Li2S full-cells at different activation and cycling rates; [b] comparison of the cycling performance of Si/Li2S and Li/Li2S cells after initial activation at C/10 and subsequent cycling at C/5. The upper panels of each graph indicate the Coulombic efficiency (≡Qdischarge/Qcharge). The C-rates are calculated based on Ctheoretical = 1165 mAh/gLi2S for the Li2S cathode. The error bars represent the standard deviations of two cells in each case. Capacities are referenced to either Li2S (left y-axes) or S (right y-axes).
On the other hand, Si/S full-cell data have been obtained combining electrochemically pre-lithiated Si anodes with S cathodes. For the latter configuration, Elazari et al.29 demonstrated ≈380 mAh/gS after 60 cycles at C/5, and Brückner et al.31 showed ≈400 mAh/gS after 1400 cycles at C/2 (≈700 mAh/gS after 70 cycles at C/2). They also showed increased capacity fading with increasing C-rate for Li/S half-cells, while high C-rates of a large number of cycles could be maintained with Si/S full-cells based on S cathodes and pre-lithiated Si anodes, which they ascribed to both a larger irreversible electrolyte loss at the lithium anode and/or lithium dendrite formation. Without providing any proof, their hypothesis would suggest that the rate capability of Si/S or Si/Li2S full-cells would be higher than that of Li/S or Li/Li2S half-cell. That this is indeed the case is shown by our Si/Li2S full-cell tests, which demonstrate the same capacity retention of 350 mAh/gS (≡250 mAh/gLi2S) after 70 cycles, independent of whether cells were cycled at 1 C or C/5 (gray and black lines in Fig. 8a, respectively). Thus, we can provide for the first time an unambiguous proof that the poor rate capability in Li/S or Li/Li2S half-cells is caused by the lithium anode and that the kinetics of the sulfur cathode is much faster than previously assumed based on half-cell data.
Furthermore, the fact that the capacity retention of Si/Li2S full-cells is the same at C/5 and 1 C demonstrates that capacity fading is not related to total time, but to the number of cycles, which points toward irreversible lithium loss, originating from SEI expansion/contraction during each cycle. This is indeed supported by a comparison of the capacity retention between Si/Li2S full-cells and Li/Li2S half-cells at C/5 (s. Fig. 8b): while the initial capacities are quite similar for half-cells and full-cells, the capacity retention of half-cells is superior (≈550 vs. ≈400 mAh/gS after 70 cycles), which supports the above hypothesized active lithium loss into the SEI. Here it may be noted that the capacity retention of our Li/Li2S half-cells compares reasonably well with that shown previously by Yang et al.26 (≈650 mAh/gS after 50 cycles at C/10) and Cai et al.41 (≈550 mAh/gS after 45 cycles at C/5).
Conclusions
Li2S cathodes were prepared from as-received Li2S powder (≈20 μm particle size) and in-situ XRD half-cell measurements clearly showed that Li2S could be completely decomposed during the first charge and that crystalline sulfur was being formed. This was confirmed by ex-situ SEM/EDX, revealing the presence of very large sulfur sheet (>100 μm) located at the separator/cathode interface, which we believe is caused by the oxidation of dissolved polysulfides present in the separator.
Li2S cathodes were also tested in full-cells using Si/C composite electrodes without any pre-treatment. While Li/S and Li/Li2S half-cells have been shown in the literature to have a poor capacity retention at high C-rates, we could demonstrate for the first time that the capacity and the capacity fading of Si/Li2S full-cells is identical for C/5 and 1 C. This suggests that the apparently poor rate capability of sulfur cathodes tested in half-cells is caused by the lithium electrode and that the intrinsic charge/discharge kinetics of sulfur cathodes are much larger than previously thought.
Acknowledgment
The authors acknowledge funding of this work from the Federal Ministry of Education and Research (BMBF) under agreements number 03×4627A ("LiSSi" project) and number 03×4633A ("ExZellTUM" project) and to acknowledge Wacker AG for providing the Silicon anodes used in this study. Furthermore, we thank Stefan Haufe, Jürgen Stohrer, and Robert Maurer from Wacker AG as well as Oliver Gröger from Volkswagen AG for valuable discussions. S.M. acknowledge financial support from BASF SE through the framework of its Scientific Network on Electrochemistry and Batteries. The authors would also like to thank Anna Eberle for her help with cell building and testing.