Abstract
In this study the effect of the purification of electrolyte material on the performance and long-term stability of dye-sensitized solar cells is investigated. The combined effect of purifying all the electrolyte materials has been examined, as has the effect of purifying each compound to identify those compounds worth purifying and to eliminate unnecessary production steps on an industrial scale. Statistical methods were employed to draw statistically significant conclusions from the experimental results. No effect on the initial cell performance is found in this study. The purity of the electrolyte solvent (here methoxypropionitrile) is shown to have a remarkable effect on the cell lifetime: it could even double when the cell is properly purified. It is shown that exposing the cell to even relatively small amounts of UV light resulted in cell degradation through electrolyte bleaching during a 1000 hour aging test. Here the impurities in the electrolyte solvent lead to an almost doubled rate of electrolyte bleaching under UV light.
Export citation and abstract BibTeX RIS

This is an open access article distributed under the terms of the Creative Commons Attribution 4.0 License (CC BY, http://creativecommons.org/licenses/by/4.0/), which permits unrestricted reuse of the work in any medium, provided the original work is properly cited.
Dye-sensitized solar cells (DSSC) have the potential to become a low-cost alternative to silicon solar cells in the future. They can be made out of sustainable materials, they have a wide application area, and they are on the threshold of large-scale production.1 They are also efficient: an 11.9% efficiency record for DSSCs has been achieved.2 At the moment one of the main challenges is the cell stability. DSSC stability for approximately 20 years in outdoor conditions is an essential prerequisite for the introduction of DSSCs into the wide commercial market, e.g., in the form of building-integrated panels. The structure of DSSCs is quite complicated and unfortunately the components tend to age when the DSSC is exposed long-term to light, humidity, and extreme temperatures.3,1,4,5,6,7,8
Material purification has been proposed to increase the stability of the cells.9–12 The use of highly pure materials is also regarded as an essential step in the preparation of most efficient cells.13,10,14 The reported data do not, however, include direct comparisons of purified and unpurified materials, which would be essential for assessing the importance of material purification in cell fabrication. From the industrial point of view, material purification increases the production costs of the cells. Thus the necessity of material purification should be studied carefully,1,15 just like any step that increases the complexity of the production. The objective of this study is to investigate if cell efficiency and stability increase as a result of the purification of the electrolyte material. The effect of the purification of all the electrolyte materials has been studied and the effect of each compound has been statistically compared and analyzed. The research continues in,16 where the effect of dye purification on cell efficiency and lifetime is studied.
It is still quite common in the field to utilize only a few tests, mainly IV curve measurements in aging studies, or to test the cells only at the beginning and end of the aging. This is sufficient when the only purpose is to show that the cells remain stable but in order to gain a profound understanding of the aging mechanisms, a more detailed investigation is required. In this study, the cells are analyzed with a multitude of electrical, electrochemical, and visual tests: IV tests, electrochemical impedance measurements, cell photographing, quantum efficiency tests, and a combination of liquid chromatography and mass spectrometry. Automatic IV curve and impedance measurements are also performed continuously to monitor the trends in cell degradation.
In aging studies, the aging process is often accelerated by continuous, sunlight-simulating illumination, elevated temperatures or high air humidity. Still, a typical duration for an aging study is 1000 hours, which corresponds to approximately a year's operation in sun light in Northern European latitudes.17 The long duration makes it challenging to perform aging studies and treat the results because the effects of variations in test conditions, which it is practically impossible to avoid, accumulate during the whole test period. One approach to this inherent challenge of aging tests is statistical treatment of the results. Statistical techniques can be used to compensate the differences in test conditions and evaluate the significance of the results. At the moment, the utilization of statistical tools is rare in the field of DSSC research. Here we present practical statistical methods (Pierce's criterion, regression analysis, analysis of covariances, and one-way analysis of variances) applied to aging studies that we consider would bring significant improvements to the field. We suggest that these methods could be applied more generally in the investigations of dye solar cells.
Materials and Methods
Material purification
The electrolyte components and the components of the dye solution were purified, especially in order to minimize the water absorbed in the materials. Thus, the material purification was performed under an inert atmosphere either using standard Schlenk techniques and an argon line or using a nitrogen-filled glovebox.18 Additionally, all the glassware was oven-dried before use.
The electrolyte consisted of iodine (I2), 1-methyl-benzimidazole (NMBI), 1-propyl-3-methylimidazolium iodide (PMII), guanidinium thiocyanate (GuSCN) and 3-methoxypropionitrile (MPN). The iodine was not purified. The purification of the other materials required the use of purified solvents or reagents: tert-butyl methyl ether (TBME, Sigma-Aldrich), tetrahydrofuran (THF, Sigma-Aldrich), n-propyliodide (Sigma-Aldrich), N-methylimidazole (Sigma-Aldrich), and isopropanol (Sigma-Aldrich). The first two materials were purified by redistilling them over sodium benzophenone ketyl. The N-propyliodide and N-methylimidazole were stirred overnight at 60 °C with calcium hydride and redistilled at reduced pressure. The isopropanol was purified in a similar way but redistilled at atmospheric pressure.
The actual purification of the electrolyte materials was performed according to the following techniques: commercially available NMBI (Sigma-Aldrich, 99%) was recrystallized from hot TBME and isolated by filtration in a glovebox. PMII was prepared from n-propyliodide and N-methylimidazole according to the literature.19 Commercially available GuSCN (Sigma-Aldrich, ⩾ 99%) was recrystallized from hot isopropanol and isolated by filtration in a glovebox. MPN (Sigma-Aldrich, ⩾ 98%) was treated in a similar way to the n-propyliodide and N-methylimidazole. Bubbles that probably contained hydrogen were detected when the MPN was stirred with calcium hydride, which suggests that water was removed from the solvent. This is a reasonable assumption because the reported impurities in the original MPN solution were water ( ⩽ 0.3%), chloride, and bromide ( ⩽ 50 mg/kg).20 After the purification the MPN was noticed to have changed color from slightly yellowish to fully transparent, which also indicates that some impurities were removed during the purification.
The test cells were dyed in purified cis-bis(isothiocyanato)-bis(2,20-bipyridyl-4,40-dicarboxylato)-ruthenium(II)bis- tetrabutylammonium (N719) dye, which was dissolved in tert-butanol (Sigma-Aldrich) and acetonitrile (Sigma-Aldrich) 1:1 solvent. The tert-butanol and acetonitrile were purified in a similar way to the isopropanol. Purified N719 was made from cis-bis(isothiocyanato)-bis(2,20-bipyridyl-4,40-dicarboxylato)-ruthenium(II) (N3) dye. N3 was prepared according to the procedure published in the literature.21 The preparation procedure for the N719 was the following: N3 dye that was dissolved in tert-butanol and water was purified by gel filtration on Sephadex LH20 using water as an eluent. The main dark red-colored band was collected and titrated with 0.05-M HNO3 to pH 4.3. The resulting suspension was stirred for 3 h at room temperature and centrifuged. The precipitate was washed with water and centrifuged again. 2.5 eq of 40% solution of tert-butanol in water were added to the solid N719 thus obtained and the gel filtration and precipitation steps were repeated once more. Finally, the dye was dried in a vacuum. According to NMR spectroscopy (data not shown here), the spectrum of the self-prepared purified dye contained a smaller number of impurity peaks than the spectrum of commercially available dye (Solaronix), indicating that the self-prepared dye was purer.
Cell preparation
The cell substrates were 2.5-mm TEC-15 FTO glass. They were washed with washing detergent, de-ionized water, ethanol, and acetone and UV-ozone-treated for 20 minutes. 0.4-cm2 photoelectrodes were prepared by screen printing TiO2 paste on top of the glass substrates. A TiCl4 treatment according to the procedure described in the literature22 was also performed. The photoelectrodes consisted of two layers of Dyesol DSL 18NR-T TiO2 paste and one layer of Dyesol WER2-O TiO2 paste that acted as a light-scattering layer. The total thickness of the photoelectrodes was approximately 13 μm. After the sintering, the photoelectrodes were immersed in the dye solution immediately after they had cooled down enough to not to evaporate the dye solution. The photoelectrodes were dyed in the dark under a nitrogen atmosphere (S.I. Fig. A1) for 16 hours. This way, the absorption of humidity into the photoelectrodes was minimized before the cell assembly. The dye solution consisted of 0.3-mM purified N719 in purified acetonitrile and tert-butanol 1:1 solvent.
The counterelectrodes were made just before the cell assembly by adding 4 μl of 5-mM H2PtCl6 in 2-propanol solvent on top of the glass substrates and heating them at 385 °C for 20 minutes.
The electrolyte consisted of 0.05-M I2, 0.5-M NMBI, 0.5-M PMII and 0.1-M GuSCN dissolved in MPN. Six batches of electrolytes were made (Table I): completely purified and completely unpurified electrolytes and four batches of electrolytes that were otherwise purified but each of which contained one unpurified component. The unpurified components in the partly purified batches were MPN, NMBI, PMII, and GuSCN. Iodine was left out of the investigations because the "resublimated" grade was considered already to be as pure as practically possible. The electrolytes were prepared and stored in an argon atmosphere to avoid the absorption of water from the air.
Table I. Compositions of electrolyte batches (A-F). It is indicated for each batch whether the electrolyte components were purified (P) or unpurified (U).
| Batch | I2 | GuSCN | PMII | NMBI | MPN |
|---|---|---|---|---|---|
| A | P | P | P | P | U |
| B | P | P | P | U | P |
| C | P | P | U | P | P |
| D | P | U | P | P | P |
| E | P | U | U | U | U |
| F | P | P | P | P | P |
For practical reasons, the cells were prepared in air (at approximately 20 °C and with a relative humidity of less than 10%) instead of a glove-box. Furthermore, in order to reduce the absorption of humidity from the air during the cell preparation, the materials were kept in closed containers when they were not in use. The preparation of a single cell took roughly 4 minutes from picking the photoelectrode from the solution of dye solvent to the sealing of the cell. The cells were sealed with 25-μm Bynel foils. For each electrolyte batch mentioned in Table I, four to six cells were prepared and aged. Additionally, one cell of group E and one cell of group F were left as reference cells and stored in the dark during the aging tests.
Aging tests and equipment
The test cells were aged for a total of 1000 hours under illumination. The aging tests consisted of three main parts: pre- and post-aging measurements, automatic measurements performed continuously during the aging, and manual measurements performed on a weekly basis during the aging.
First, the cells were subjected to light soaking at an illumination of approximately 0.5 Sun for 16 hours to stabilize the cell operation. Second, the following pre-aging tests were performed on the cells: current-voltage (IV) curve measurements and electrochemical impedance spectroscopy (EIS) at open circuit voltage (Voc) in a solar simulator, IV curve measurements as a function of light intensity, and incident-photon-to-collected-electron efficiency (IPCE) tests.
The solar simulator was calibrated with an official calibration solar cell with a KG5 colorglass filter (PV Measurements, Inc.) to a state equivalent to the 1000 Wm− 2 AM 1.5G (1 Sun) illumination spectrum in the visible range. The spectrum of the halogen lamps used in the solar simulator is shown in S.I. Fig. B1. The IV curves were measured with a Keithley 2420 SourceMeter with black tape masks attached on top of the cells. EIS at Voc under 1 Sun were performed with a Zahner Zennium potentiostat. In the impedance measurements, the frequency range 10− 1-105 Hz was swept back and forth with 10 mV amplitude. The EIS data were fitted using the ZView2 program with an equivalent circuit presented in.23 The analysis of the EIS results is explained in more detail in the S.I. section C. An Autolab PGSTAT302 N potentiostat combined with a white LED light source built in-house was used for measuring the IV curves as a function of varying light intensity up to the equivalent of approximately 0.5 Sun. The IPCE tests were performed with a PV Measurements QEX7 Solar Cell Spectral Response Measurement System in DC mode with no bias light, and in the wavelength range 300--900 nm.
Third, the cells were aged. The light soaking device built in-house that was used for aging the cells uses the same lamps as the solar simulator and thus gives illumination equivalent to 1 Sun in the visible range. Calibrated this way, the lamps emit approximately 20% of the UV in the AM 1.5G spectrum (the spectrum of the lamps is shown in S.I. Fig. B1).
The temperatures of all the cells stayed below 40 °C during the light soaking, which was confirmed by weekly infrared photographs (Flir InfraCam) and by monitoring the temperature continuously during the aging with thermocouples. Because of the large number of cells in the aging, the illumination level in the light soaking device was not as uniform as in the solar simulator. To be able to compensate for the variations in the light intensity, the light intensities of each cell were measured manually every time the cells were moved or a bulb in the light soaking device was changed.
During the aging, automatic IV measurements and EIS measurements at different voltages between the short and open circuit voltages of the cells were performed with a Solar Cell Aging Test Unit (SCATU) built in-house using a Bio-Logic SP-150 potentiostat with similar EIS settings to those that were used in the Zahner potentiostat. SCATU takes one measurement every five minutes, cycling through all the cells, so the degradation rate of the cells is monitored continuously.
In addition to the automatic SCATU tests, manual tests were performed on a weekly basis. These tests included EIS in the dark (Zahner Zennium potentiostat) and cell photographing (the system built in-house described in,24 which includes an Olympus E-620 camera). The EIS settings were the same as in the measurements performed under illumination but the tests were repeated at a voltage range from 0 V to 0.7 V at intervals of 0.1 V. Cell photographing was used for the quantitative monitoring of the changes in the color of the electrolyte over the aging test period. As the yellow color of the electrolyte comes mainly from iodine, the changes in the blue RGB pixel values of the photographs of the cell electrolyte can be related to the changes in the iodine concentration in the electrolyte.24 Cell photographing is also suitable for monitoring dye desorption to the electrolyte because desorption increases the red RGB pixel values of the photographs of the electrolyte.24 A detailed description of the photographing method and the photographing system can be found in the literature.24
Fourth, the post-aging tests were performed after an aging period of 1000 hours. These tests were otherwise the same as the pre-aging tests but one more test was added: liquid chromatography-mass spectrometry (LC-MS) measurements for a couple of cells in each cell group. Dye was extracted from one cell from each batch with 0.1-M NaOH and analyzed with LC-MS according to a procedure described elsewhere.25 MS was performed in order to gain further information about the structure of the observed dye degradation products. The LC-MS results of the cells were compared with the results of both the pure starting material (dye solution) and reference cells that had not been aged under illumination. The results were not compared to the pre-aging measurements of each cell because LC-MS is a destructive analytical method.
Statistical methods for analyzing the aging data
The experimental results in this study were subjected to statistical testing in order to compensate for the effects of random errors and varying light intensity during the aging test. One-way analysis of variances (ANOVA) combined with paired comparison tests was utilized for checking if the differences between the cell groups in the averages of the measured parameters were significant.26,27 For the aged data, regression analysis was applied for line plots showing result parameters as a function of the light intensity during the aging test. Linear regression lines and confidence intervals were calculated with the Matlab software with the Matlab functions polyfit and polyconf. Analysis of covariance (ANCOVA)27 is a method in the middle ground of ANOVA and regression analysis, used for the comparison of groups with respect to a variable, regardless of the covariate. Here, the performance of different cell groups was compared despite of the varying light intensity during the aging test with ANCOVA.
Before ANOVA or ANCOVA were performed, the results had to be pre-treated by removing significant outliers from the untreated measurement data. The selected exclusion method was Peirce's criterion. It has been described accurately in the literature.28 This easy method is designed in such a way that it can be applied to several suspicious data points and it adjusts the criterion for excluding a data point to the number of data points.28 Peirce's criterion is designed for detecting random errors in data sets without taking any additional parameters into account but it seems to function also for the data that contains external dependencies, such as the light intensity dependency. Like all outlier detection methods, Peirce's criterion must be combined with further inspection of the data and the cells in order to avoid false positive and negative detections.
Results and Discussion
IV measurement results
Initially, all the groups performed similarly, as shown in Fig. 1. This was also confirmed by the 95% confidence level ANOVA test described in Statistical methods for analyzing the aging data section. Surprisingly, the result indicates that the purification of the electrolyte components did not affect the initial cell performance. There seems to be no need to purify electrolyte components in studies that do not include cell stability testing, even though this has been quite common practice in the field.
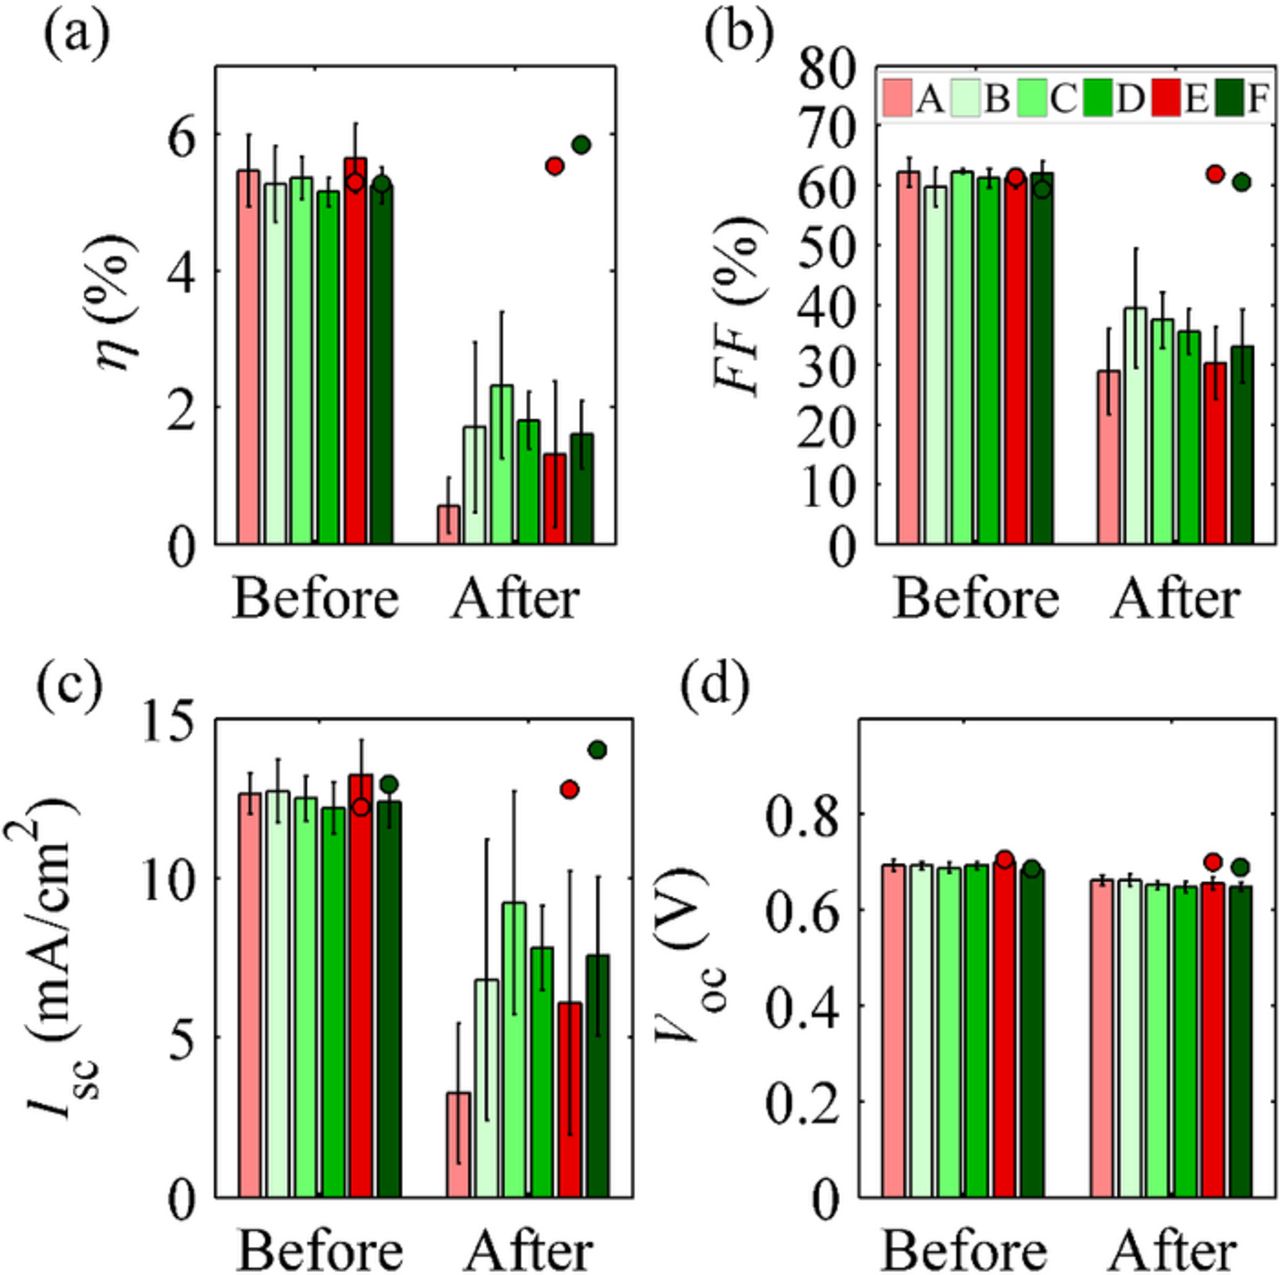
Figure 1. Efficiencies, fill factors, short circuit currents and open circuit voltages of the cells with group standard deviations before and after the 1000-hour aging test. The green and red dots represent the two reference cells from groups E and F, respectively, which were not aged under illumination but kept in the dark.
The efficiencies of the cells in this study are moderate (Fig. 1) because of the cell geometry used in this study, and the geometry does not affect the possible chemical reactions related to the impurities in the electrolyte. Thus we believe that these results apply also for more efficient cells. Here, the cell geometry was not optimized for cell efficiency but for the ease of photographing the electrolyte and to mimic a small piece of a larger module so that the results would also be meaningful for upscaled cells. Therefore, the cell dimensions are rather large, increasing, e.g., the series connected resistances.
All the cells degraded during the aging (Fig. 1) and the degradation was related to the light soaking because the reference cells kept in the dark during the aging stayed stable. Cells containing similar ingredients to those used in this study have been reported to have passed 1000-hour aging tests on a regular basis29–33 and even in our own studies using the same aging system.34–36 The reasons that led to the aging of the cells in this study are analyzed later in this section. The degradation is mainly related to reduced Isc and FF, while Voc decreased only moderately (30-40 mV). Interestingly, quite similar cells exposed to a shock test at 100 °C and under UV illumination showed a similar 36 mV decrease in Voc.15
On the evidence of Fig. 1, it seems that after the aging, group A and possibly also group E performed worse than the other groups. The cells in both groups contain unpurified MPN, while the other groups contain purified MPN. This hypothesis was tested by a 95% confidence level ANCOVA test with average light intensity during the aging as a covariate by dividing the cells into six groups (A-F). The test did not confirm reliable differences between the individual groups because the variations within the groups are large compared to the differences in the mean values of the groups, making it difficult to analyze the differences. This is also clear to the eye from Fig. 1. When the group size was increased by dividing the samples into only two groups, purified MPN (B, C, D, F) and unpurified MPN (A, E), ANCOVA resulted in differrences in performance between the groups: the cells containing unpurified MPN had a lower Isc, FF, and η after the aging than the cells containing purified MPN. Therefore the effect of the purity of the MPN seems relevant to cell stability when the effects of the purity of the other electrolyte components are neglected.
One significant reason that we suspect accounts for the deviations in the post-aging cell efficiencies within the cell groups is the variation in the light intensity. The test cell series is so large that it was not possible to keep the variations in the light intensity between the cells negligibly small during the aging test. Therefore, the cells might have aged at different rates and the differences accumulated during the whole aging period.
This effect has to be dealt with in all the measurements performed on the cells. Additionally, there are some measurements that are difficult to perform for cells that are too aged. The cell current can, for example, decrease so much that the random fluctuations in the measured cell current hide the actual cell response in EIS or the electrolyte can become so colorless that the sensitivity of the photographing technique is not high enough to detect the color. Two measures were taken to deal with these problems: first, to compensate for the variations caused by the varying light intensity, the analyses were performed as a function of the average light intensity during the aging in suitable cases, and, second, in order to reveal the possible differences between the cell groups better and for the sake of consistency, the decision was made to analyze all the automatic and weekly measurements at an earlier point of time, after 700 aging hours.
The SCATU IV results were analyzed to verify that they supported the solar simulator IV results. The results were analyzed as a function of the average light intensity during the aging after 700 hours of aging. The IV parameters are shown in Fig. 2, normalized to the initial values in order to remove the effect of slightly varying initial performance. The SCATU IV results (Fig. 2) do indeed confirm the solar simulator IV results (Fig. 1): groups A (unpurified MPN in the electrolyte) and E (completely unpurified electrolyte) clearly perform poorly in comparison with the other cell groups, while it is not possible to detect differences between groups B-D and F. Thus the regression lines for groups A and E versus all the other cells are shown in Fig. 2. Fig. 2 shows that the η, FF, and Isc values are lower in groups A and E as compared to the other groups, whereas Voc has decreased by roughly 5% for all the cells.
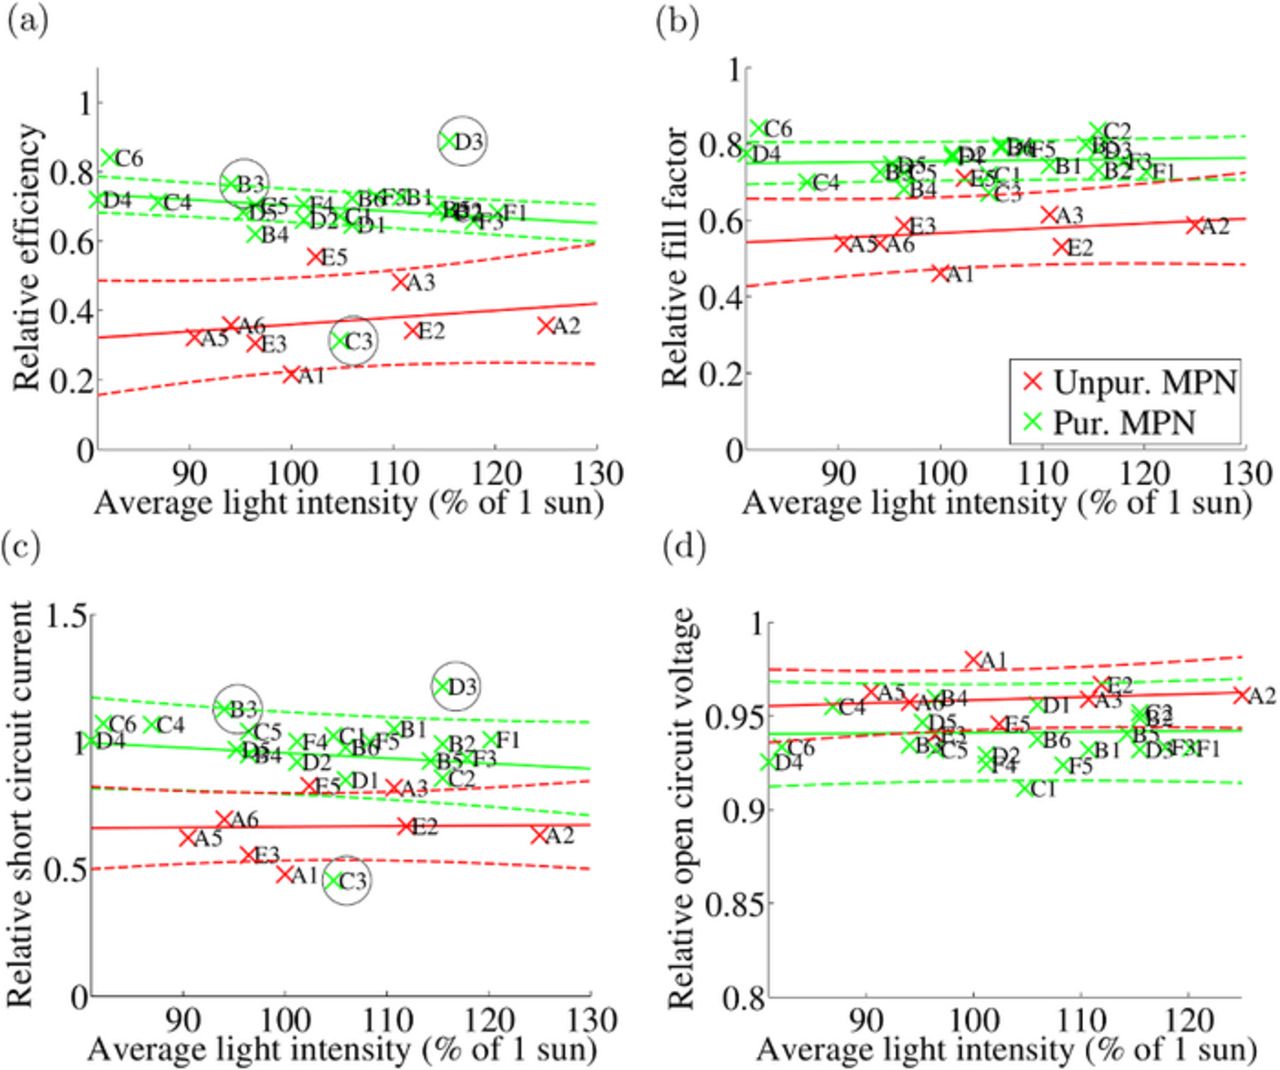
Figure 2. Efficiencies, fill factors, short circuit currents, and open circuit voltages of the cells shown relative to initial values after 705 hours of aging. The bright red color refers to groups A and E (unpurified MPN) and the light green refers to the other cells (purified MPN). The regression lines and 70% confidence intervals drawn according to the method described in Statistical methods for analyzing the aging data section are also included. The cells that are marked with a black circle were discarded from the regression line calculations on the basis of Peirce's criterion.
The SCATU IV curves were measured practically continuously during the aging. The IV curves of all the cells seemed to transform in a roughly similar way during the aging but the rate of degradation between the cells clearly varied. A typical example of the transformation of an IV curve is shown in S.I. Fig. D1. The evolving IV curves showed that the performance of the cells with unpurified MPN was stable during the first 120 hours but started to decrease after that. There was more variation in the performance of the cells with purified MPN but most cells had started to degrade by 500 hours of aging. It seems that the effect of the purity of the MPN on cell performance is greater than the effect of the other electrolyte materials. This is reasonable because MPN is the solvent of the electrolyte and thus the volume of the MPN in the cell is larger than the volume of other electrolyte components. Fig. 2 shows that after 700 hours of aging, the η of the cells containing purified MPN has mainly decreased because of decrease in FF. For cells containing unpurified MPN, the degradation has proceeded further, also causing a decrease in Isc.
Some cells have been discarded from the regression line calculations in Fig. 2. Peirce's criterion, described in Statistical methods for analyzing the aging data section, was utilized as the main guideline in the cell rejection. Peirce's criterion was applied for the Isc values of the cells when the cells were divided into two groups (purified and unpurified MPN) and into six groups (A, B, C, D, E, and F). Cell C3 was spotted as an outlier in the two-group test and cells B3, C3, D3, and F3 were spotted as outliers in the six-group test. The aging data of cell C3 were consistent with the rest of the data of the same cell and showed that the cell had degraded very fast. It is possible that C3 had become contaminated during the cell assembly. Therefore, cell C3 was discarded as an outlier. On further inspection of the Isc data of cells B3 and D3 it was noticed that the values at 700 hours were not consistent with the values before or after that time. The recorded light intensity for these cells is probably erroneous at 700 hours, which creates the discontinuities in Isc and makes the data at that time invalid. Therefore, these cells were discarded from the regression line calculations. Peirce's criterion spotted cell F3 as an outlier in group F when the cells were divided into six groups because F3 had a somewhat low current (0.94 in Fig. 2c) compared to the other three cells in group F (on average 1.00 in Fig. 2c). The difference is actually quite small compared to the deviation of all the cells with purified electrolyte solvent and the IV values of cell F3 fit this group well. Therefore, F3 was regarded as a false positive result of the Peirce's criterion test and was not discarded. Peirce's criterion seems to be a useful method in the analysis of aging data even if the efficiencies of the cells analyzed in Fig. 2 had a notable light intensity dependence.
After Peirce's criterion had been applied to the SCATU IV data, the data were tested by 95% confidence level ANCOVA and paired comparison tests that have been described in Statistical methods for analyzing the aging data section. The tests resulted in the following conclusions: Groups A and E differed from the other groups (B-D and F, containing purified MPN) in Isc and η but resembled each other. In FF, groups A and E resembled each other but, additionally, group E resembled groups B and F, which had a slightly lower FF than groups C and D. The differences in Voc between the groups were quite small and paired comparison tests for Voc showed just that group A differed from group F in having a higher average value. The results indicate that groups A and E perform worse than the other groups in the IV tests. The difference is clear in η and Isc. For FF, the differences between the groups are not as large as for η and Isc but still, group A performs worse than the other groups.
There is a significant difference between the regression line calculation and the ANCOVA tests: the first method is used for estimating the size of the difference between the groups and the latter is used for assessing whether any difference between the groups exists. Thus it is not odd that ANCOVA concluded with a high 95% confidence level that groups A and E behaved differently from the other groups, even if the size of the difference could not be estimated with such a high confidence level (70% confidence intervals of regression lines).
Analysis of internal series connected resistances
The previous section showed that a great performance-limiting factor for the cells after 700 hours of aging is FF. Series connected resistances are the factors affecting FF: the series resistance, Rs, the resistance at the counter electrode/electrolyte interface, RCE, and the steady state value of the diffusion impedance in the electrolyte at the counter electrode, RD. These resistances are easy to investigate by EIS under illumination at Voc.
EIS at Voc was analyzed in its initial state and at 700 aging hours. Examples of the measurement results of the aged cells A6 (unpurified MPN) and F1 (purified MPN) and the fits to the equivalent circuit model are shown in S.I. Fig. E1. All the cells were analyzed but the only differences were found between cells containing unpurified MPN (groups A and E) and purified MPN (groups B-D and F). Therefore, the parameters resulting from the fit of EIS at Voc to the cell equivalent circuit (see S.I. Section C) are presented as being divided in these two groups. The fitted parameters are Rs, RCE, RD, and the capacitance related to the counter electrode/electrolyte interface, CCE.
Initially, EIS at Voc showed no apparent differences between the cells containing unpurified and purified MPN, as Fig. 3 illustrates. This was confirmed by the 95% confidence level ANOVA. The development of the parameters RCE, CCE, and RD (Figs. 3a–3c) during the aging differed between the two groups but Rs (Fig. 3d) did not show either any post-aging difference between the two groups nor radical degradation. These results were also confirmed by the 95% confidence level ANCOVA with the average light intensity during the aging as a covariate. The stability of Rs (Fig. 3d) indicates that the cell contacts, especially silver paint, did not degrade during the aging in either cell group. Figs. 3a and 3b illustrate that the resistance and capacitance related to the interface between the counter electrode and the electrolyte increased in the cells containing unpurified MPN but stayed relatively stable in the cells containing purified MPN. It is worth noting that although the changes in RCE and CCE are typically connected to changes in the counter electrode catalyst, they can just as easily be affected by changes in the electrolyte as they describe the properties of the whole interface (see S.I. Section C). RD increased in both cell groups, indicating the degradation of the electrolyte, but the increase is clearly larger for the cells containing unpurified MPN as compared to the cells containing purified MPN.

Figure 3. Results of EIS OCV measurements that were performed before and after 700 hours of aging. Averages and standard deviations of the values are presented.
The sum of the series connected resistances Rs, RCE, and RD tripled in the cells containing unpurified MPN during the aging, whereas in the cells containing purified MPN the increase was approximately 50 percent. This might explain the differing Isc of the cells containing unpurified or purified electrolyte solvent (Fig. 2): the series connected resistances increased so drastically in the cells containing unpurified MPN that it affected the short circuit currents of the cells, whereas the increase in the series connected resistances was not large enough to limit Isc in the cells containing purified MPN. It only reformated the IV curve, which led to a decrease in the FF of the cells. This hypothesis is actually supported by the IV vs. light intensity measurements performed for one cell in each cell group that are described in the S.I. Section J. They showed that Ilim decreased for the cells containing unpurified MPN but not for the cells containing purified MPN (with the exceptions of cells F3 and C2, which were exposed to exceptionally high light intensity during the aging).
The same post-aging data as shown in Fig. 3 are plotted cellwise as a function of the average light intensity during the aging in Fig. 4. These graphs illustrate more clearly the differences between the two groups. First, the cells with an unpurified electrolyte solvent degraded regardless of the light intensity applied. Second, the standard deviations in this group are much higher than in the cells containing a purified solvent. On the basis of Fig. 4, RCE and RD seem to be relatively independent of the light intensity applied, at least in this intensity range. However, CCE seems to decrease as the light intensity increases in the case of the cells containing unpurified MPN.
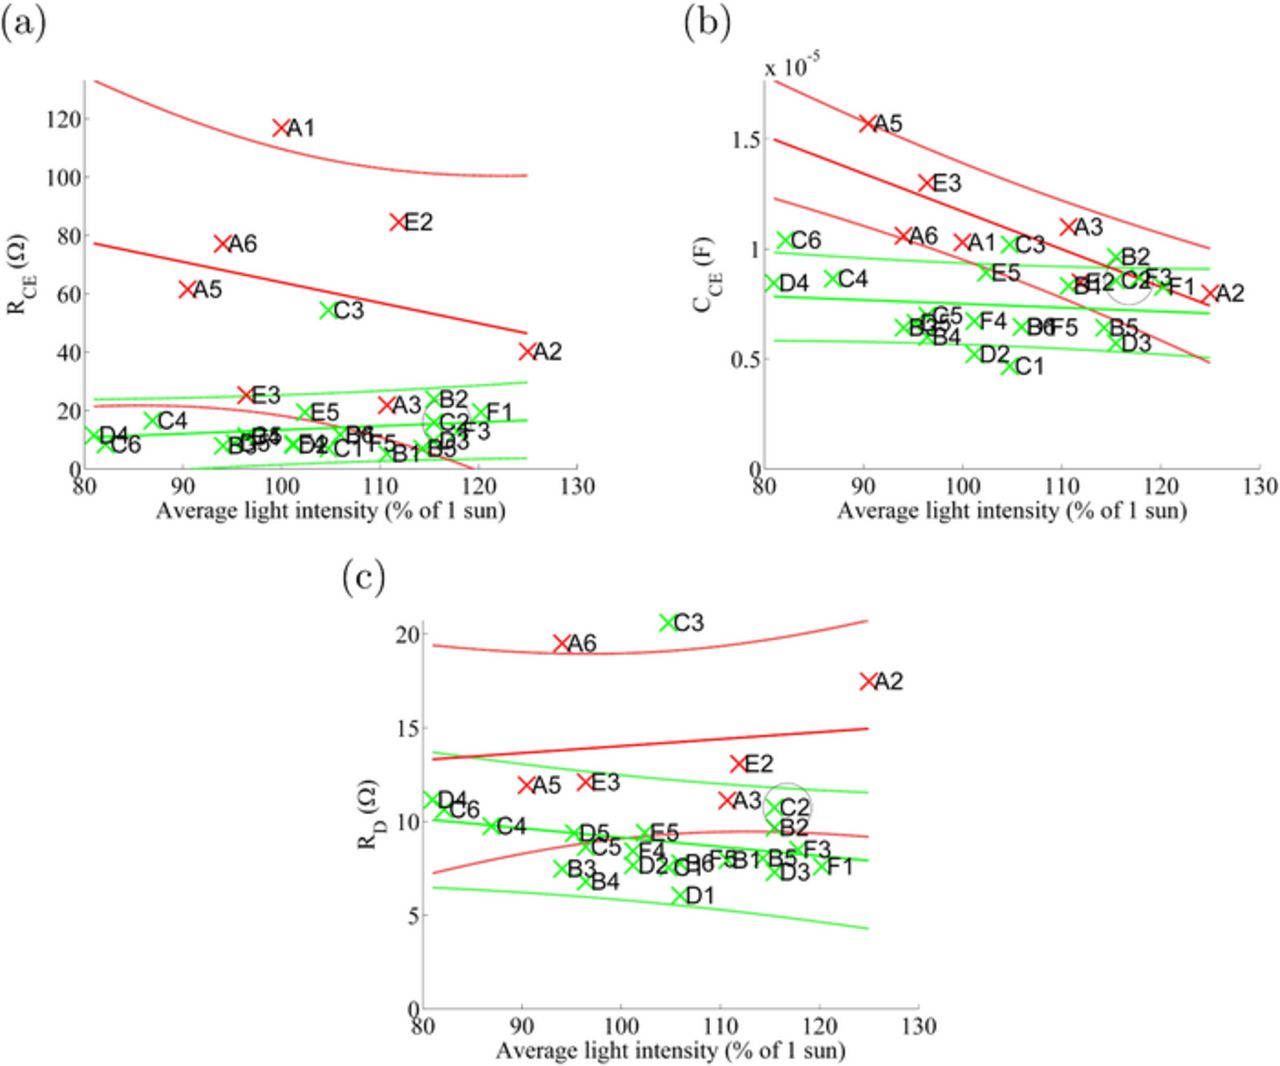
Figure 4. Counter electrode resistance and capacitance, RCE and CCE, and diffusion resistance of the electrolyte, RD, of the cells determined from EIS measured at Voc after 700 hours of aging as a function of the average light intensity during the aging.
Analysis of photoelectrode performance with impedance measurements performed in the dark
EIS in the dark as a function of voltage was analyzed at the moment of 700 aging hours to investigate possible changes at the photoelectrode. Only groups A (unpurified MPN) and F (purified MPN) were analyzed because the IV results presented in IV measurement results section showed that the purity of other cell components than the electrolyte solvent did not affect the cell stability. First, the equivalent circuit model of EIS (see S.I. Section C) was fitted to the measurement results. An example of typical data and the fits of both a fresh and an aged cell are shown in S.I. Fig. F1. The data are only shown for one cell (A6) as the data were very similar in all the cells.
The average fitted equivalent circuit model parameters, resistance, and capacitance at the photoelectrode/electrolyte interface, RPE and CPE, and electron lifetime in the photoelectrode, τ, are shown in Fig. 5. There are no significant differences in the results of the two cell groups before and after the aging. This fact suggests that the purification of the electrolyte solvent did not affect the initial photoelectrode performance or photoelectrode degradation during the aging. RPE decreased and CPE increased slightly during the aging in both groups. A decrease in RPE indicates that the recombination from TiO2 to the electrolyte has increased and thus the cell performance has decreased. The large standard deviations at 0.3 V and 0.4 V in CPE arise from the fact that log(CPE(V)) is not linear but has a steep slope in this range. Thus the slight individual differences between the cells result in large differences in the values of CPE. Interestingly, τ in Fig. 5c has not decreased but stayed rather constant during the aging and even increased to some extent at higher voltages. Moreover, the estimated electron diffusion length (data not shown) calculated on the basis of the results of EIS in dark measurements had apparently not decreased during the aging, but was about 2.5 times longer than the thickness of the photoelectrode both before and after the aging. These observations suggest that there were no apparent significant problems or changes during the aging in terms of electron collection efficiency.
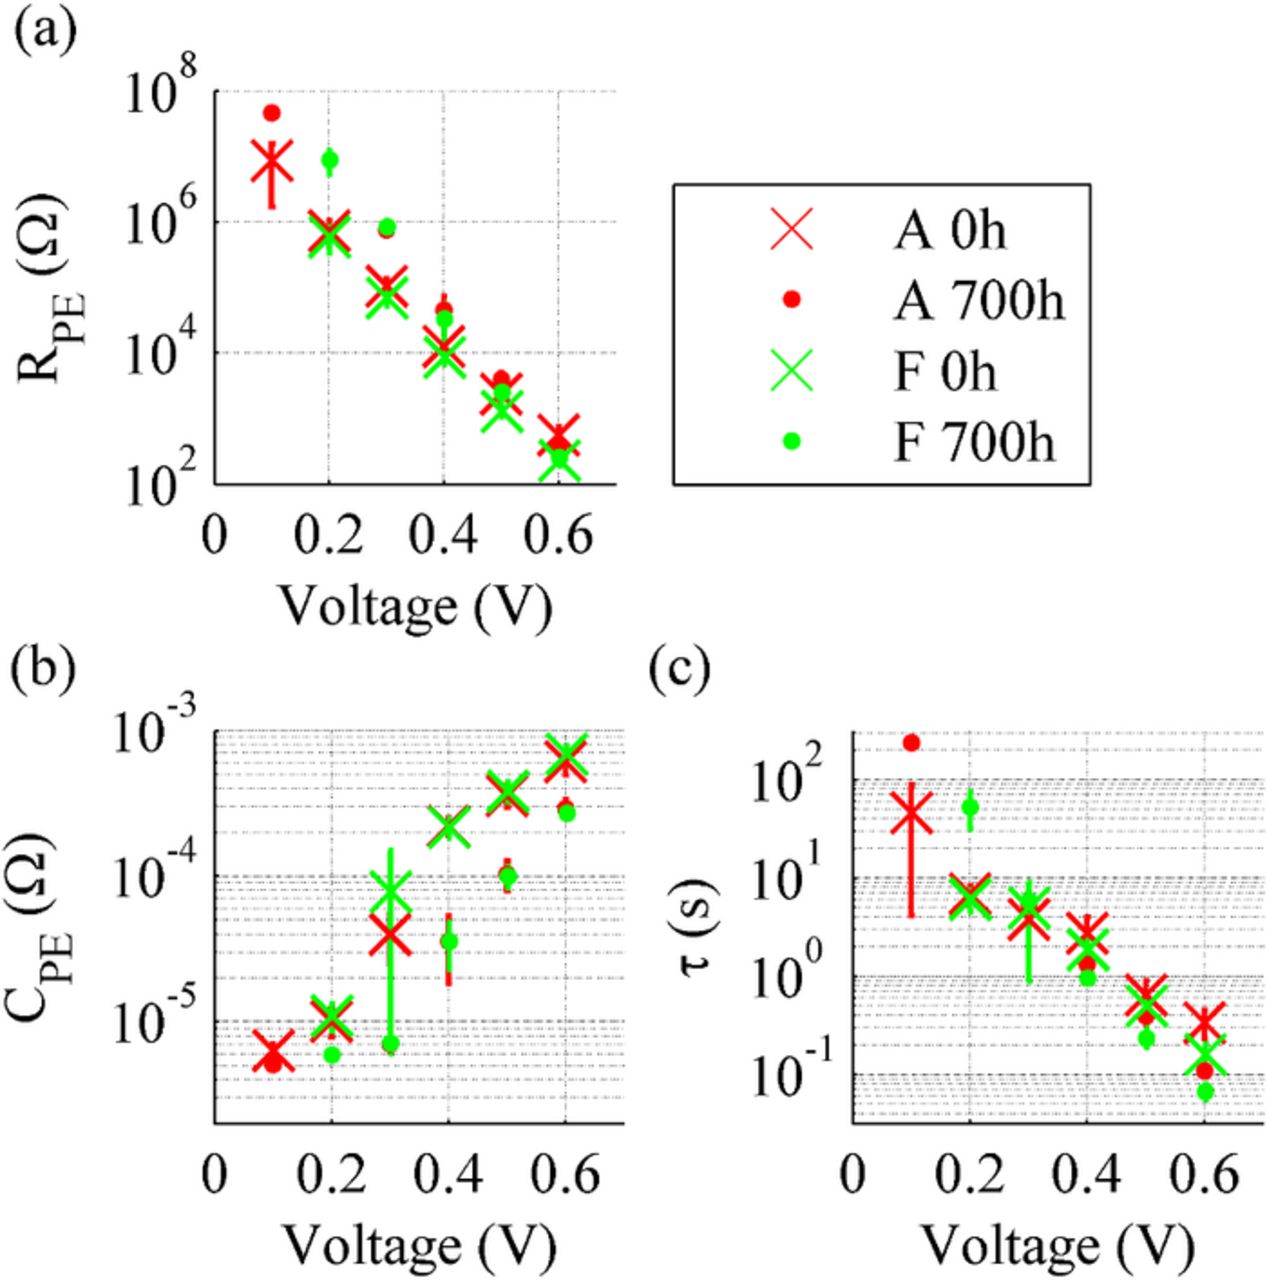
Figure 5. Average photoelectrode resistance RPE, photoelectrode capacitance CPE, and electron lifetime τ shown as a function of impedance measurement voltage before and after the aging. The results for group A are marked in red and the results for group F in green. The "o" markers are for the pre-aging and the "x" markers for the post-aging results. The results show the standard deviations for the values.
Analysis of short circuit currents
The Isc of the cells decreased during the aging, as Fig. 1 shows. The reasons for the decrease can be investigated by IPCE tests at low light intensity and IV measurements as a function of light intensity. Isc at IV tests performed under illumination of 1 Sun might be diffusion-limited, whereas in IPCE tests that are performed at low light intensity without bias light, the current is not diffusion-limited. Hence, the possible changes in the photocurrent-generating capability of the dye can be separated from the possible changes in the limiting current density, Ilim, of the cell. As for the changes in Ilim, they can be quantitatively estimated by IV measurements performed as a function of the light intensity.
IPCE was measured from one test cell in each cell group. The results for the aged and reference cells are shown in Fig. 6 and in S.I. Fig. G1, respectively. The IPCE curve is slightly lower for the cells with unpurified MPN. Actually the differences are so small that they do not significantly affect Isc. This conclusion was checked by calculating the short circuit currents of the cells as
![Equation ([1])](https://content.cld.iop.org/journals/1945-7111/162/9/H661/revision1/jes_162_9_H661eqn1.jpg)
where A is the cell area, qe is the elementary charge, λ is the wavelength, Φ(λ) is the flux of the halogen lamps used in this study, and ηIPCE is the IPCE efficiency of the cell,23 and comparing  of the cells with purified and unpurified MPN. The results are shown in S.I. Table H1.
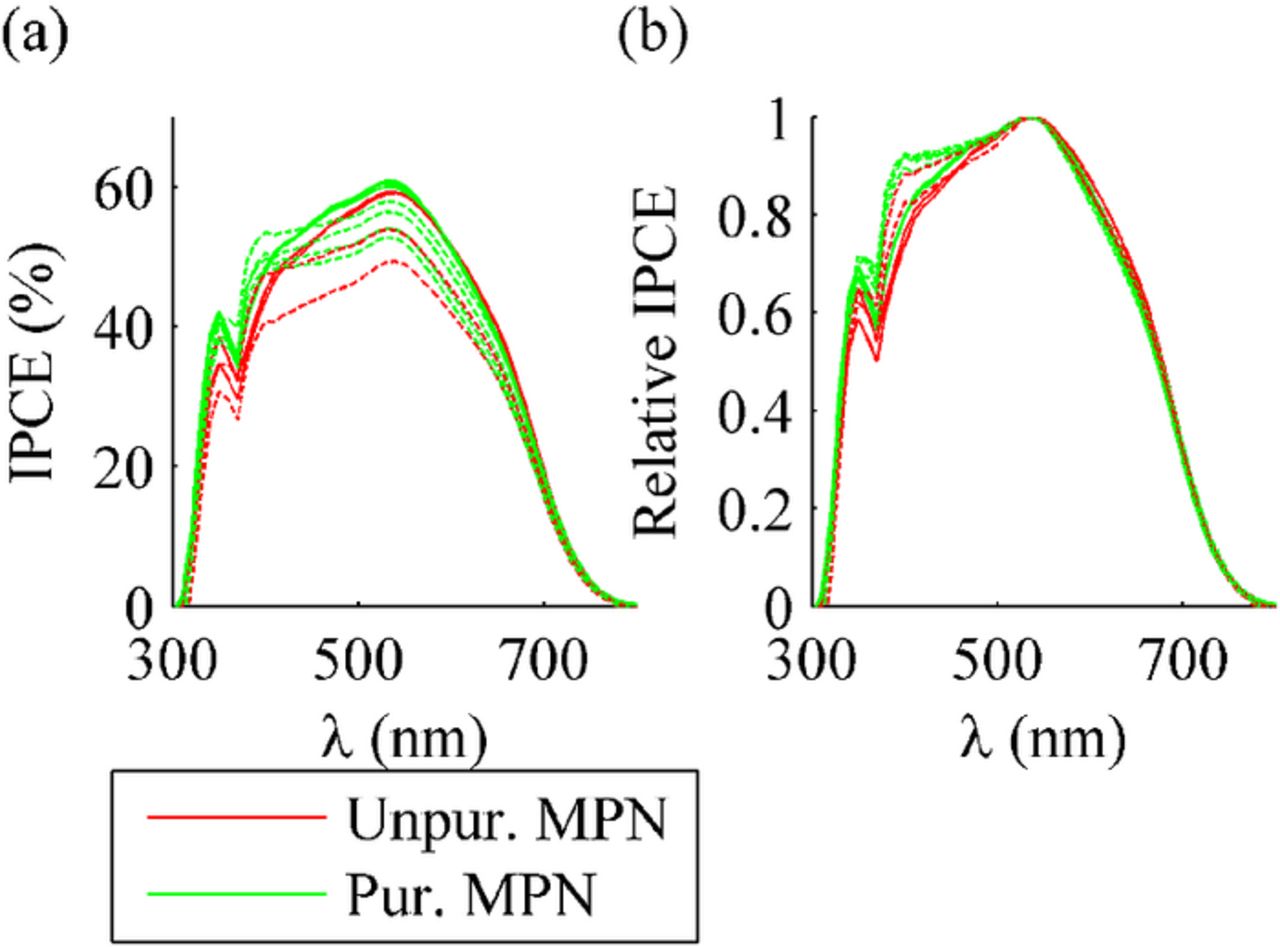
Figure 6. Results of incident photon to collected electron efficiency (IPCE) measurements in absolute and relative values as a function of light wavelength. One cell has been measured for each group. The solid lines mark the pre-aging measurements and the dashed lines mark the post-aging (1000 h) measurements.
The original peaks in Fig. 6 did not move during the aging but an extra peak appeared at 400 nm for all the cells aged under illumination. The most likely reason for this peak is the bleached electrolyte: e.g., iodine in the electrolyte absorbs less light at shorter wavelengths,37 allowing the dye to absorb more light in this wavelength area. It is also noteworthy that the new peak does not appear in the IPCE curves of the reference cells E1 and F2, which were stored in the dark and apparently were not bleached. Thus, the electrolyte bleaching seems to be a photoinduced effect, which is in accordance with the literature.24,15,38
The post-aging  calculated with Eq. 1 were compared to the actual Isc measured with the solar simulator to evaluate the effect of PE degradation on the decrease in Isc. This is made possible by the fact that IPCE was measured at a low light intensity, where the current limitations do not occur, but the IV measurements were made at 1 Sun. Apart from one cell that remained very stable, all the aged cells had lower Isc than the IPCE results would have led us to assume:
  had decreased by 2-18%, whereas Isc had decreased by 35-80% (see S.I. Table H1). This indicates that mere PE degradation does not explain the decrease in Isc of the cells, but there are also current limitations in the cells.
The IPCE results and visual inspection showed that the electrolyte in most of the cells had bleached during the aging, indicating a loss of charge-transporting I3 ions. Severe loss of I3 can also lead to a decrease in Isc, which was investigated by measuring Isc as a function of the light intensity (see S.I. Section J). The tests were performed before the aging and after 1000 hours of aging for one cell in each cell group. For some cells, Ilim decreased during the aging test. The results for these cells are shown and explained in S. I. Section J. As a result, the IV curve measurements as a function of the light intensity suggest that unpurified MPN exposes the cells to a greater decrease in  during the aging, and that the high light intensity during the aging also causes a decrease in
  . The former suggestion is examined further in Investigation of electrolyte bleaching section.
IPCE and Ilim tests were performed for one cell in each cell group in order to limit the total measurement time. Therefore, it was not reasonable to perform statistical testing, ANOVA or ANCOVA, for these tests. Instead, these tests were used to support the more thorough tests: IPCE shows that the changes of the photoelectrodes observed in EIS are not the main reason for the reduced efficiency of the cells and Ilim tests prove that the electrolyte bleaching observed in IPCE and visually (see Investigation of electrolyte bleaching section) is strong enough to limit the currents of the cells at 1 Sun.
Liquid chromatography-mass spectroscopy measurements
LC-MS measurements supported the conclusions drawn from IPCE and EIS in the dark tests: all the aged cells were found to have degraded to some extent but no significant differences between the cells in terms of the amount and types of degradation products were observed. N719 was found to degrade by ligand substitution reactions between the dye and solar cell components such as solvent and electrolyte additives. The ruthenium complexes present in the extract were identified on the basis of their m/z ratio, fragmentation pattern, and comparison with data presented in the literature39–41 as [RuL2(NCS)(H2O)], [RuL2(NCS)(MPN)], [RuL2(NCS)(NMBI)], [RuL2(NCS)(SCN)], and N719 or [RuL2(NCS)2]. The amount of these degradation products could be determined only roughly by LC-MS analysis. Sample UV-chromatograms from one reference cell kept in the dark, a cell aged under illumination, and the dye used in the cells are presented in Fig. 7. The corresponding m/z ratios of the compounds that were identified are listed in Table II.
Table II. Compound identity of the peaks in the UV-chromatograms shown in Fig. 7.
| Peak | Retention time (min) | m/z | Ruthenium complex | Description |
|---|---|---|---|---|
| 1 | 8.0 | 663.0 | [RuL2(NCS)(H2O) − H]− | Minor impurity formed in the cell even in dark. |
| 2 | 9.9 | 731.0 | [RuL2(NCS)(MPN) − H]− | Minor impurity formed in the cell even in dark. |
| 3 | 11.6 | 705.0 | [RuL2(NCS)(SCN) − H]− | Impurity present in the dye used to assemble the cells. |
| 4 | 11.8 | 778.0 | [RuL2(NCS)(NMBI) − H]− | Major, photo-induced impurity. |
| 5 | 12.3 | 705.0 | [RuL2(NCS)2 − H]− or N3 (fully protonated N719) | Dye |
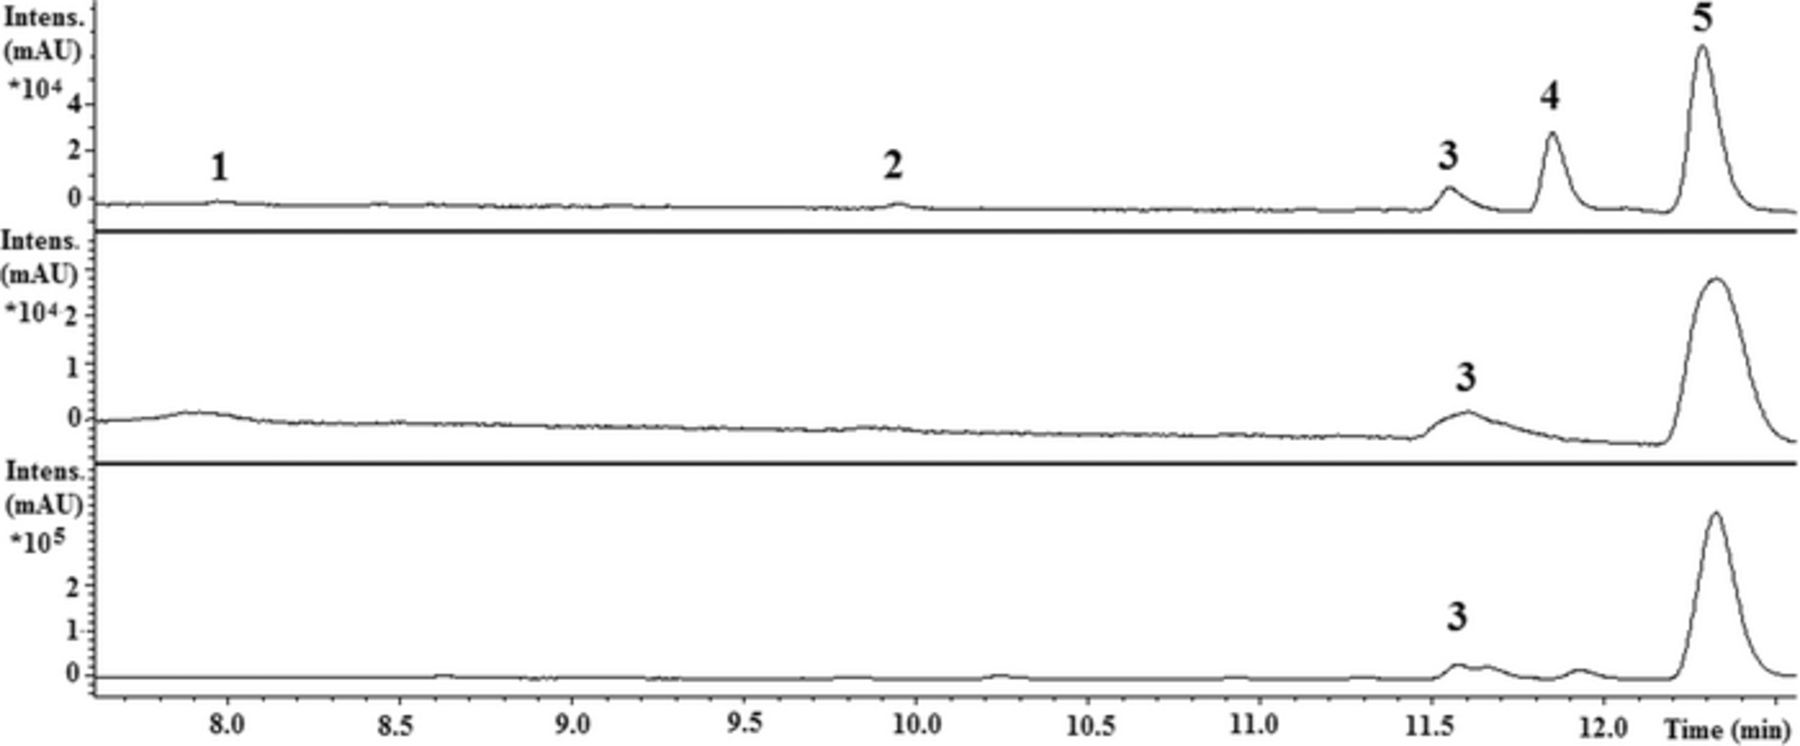
Figure 7. Sample UV-chromatograms from one of the cells aged under illumination (top), one of the reference cells stored in the dark (middle), and the dye used to assemble the cells (bottom) (see Table II for peak identifications).
The major degradation product in the aged cells is [RuL2(NCS)(NMBI)] (peak 4, Fig. 7). This compound has previously been found to work as a sensitizer, but is approximately two times less efficient than N719.41 This compound was not present in the reference cells kept in the dark, which indicates that [RuL2(NCS)(NMBI)] is a photo-induced degradation product. [RuL2(NCS)(MPN)] and [RuL2(NCS)(H2O)] are degradation products that appeared both in the cells aged under illumination and in the reference cells kept in the dark but were not present in the fresh dye. The effectiveness of these products as dyes has not been studied. The solvent substitution product [RuL2(NCS)(MPN)] seems to be a minor degradation product. The product is not stable in the extraction solution and may therefore be more prominent in the intact solar cell.
There was no significant difference between the cells containing unpurified and purified solvent, even though the unpurified solvent probably contains more water than the purified one. This is especially interesting when the minor degradation product [RuL2(NCS)(H2O)] is considered. The LC-MS result suggests that the amount of [RuL2(NCS)(H2O)] in the cell is actually not dependent on the amount of water in the cell. It is possible that the formation of [RuL2(NCS)(H2O)] competes with the other degradation reactions, and that a higher amount of the water ligand would thus be present in cells with a different electrolyte composition containing the same amount of water. As a final remark, in the fresh dye, [RuL2(NCS)(H2O)] could not be detected by LC-MS analysis. In solar cells with the type of electrolyte composition used in this study, water probably reacts with N719 at a slower rate than NMBI.42 [RuL2(NCS)(SCN)] was found to be an impurity in the starting material. This compound is often removed by the purification of N719 in order to achieve higher efficiencies.
All the above-mentioned degradation products have previously been found to be formed at elevated temperatures, but they have not been reported at lower temperatures (below 40 °C).39,40,41,43 In this work these degradation products were detected in cells aged at a temperature below 40 °C. The degradation of the photoelectrode is not the main route for the formation of the impurities (see previous Sections). The observation implies that these degradation products are not necessarily the main reason for the decline in solar cell performance observed at elevated temperatures. As the cells in this study were aged under UV+vis instead of only vis, it is possible that UV exposure is related to the formation of these degradation products.
Investigation of electrolyte bleaching
Cell photographing can be utilized for evaluating the changing iodine concentration in the electrolyte during the aging.24 The photographing results for the cells are shown in Fig. 8. In the resulting figure, the cells are divided into two groups: cells containing unpurified MPN (groups A and E) and purified MPN (groups B-D and F). The red and green pixel values in Fig. 8 remained stable within the limits of uncertainties in the groups throughout the whole aging period. This indicates that, e.g., no significant dye desorption to the electrolyte occurred during the aging (which was also confirmed by visual inspection). The blue pixel values shown in Fig. 8 increased, especially at the beginning of the aging, until they stabilized to a constant value that was close to the blue pixel value of the bare glass substrate. The increase in the blue pixel values was clearly faster in the cells containing unpurified MPN during the first couple of hundred hours of the aging. These observations indicate that the yellow color of the electrolyte (caused by iodine) bleached in both groups during the aging, i.e., the electrolyte lost free iodine. Additionally, the bleaching was much faster in the cells containing unpurified MPN.
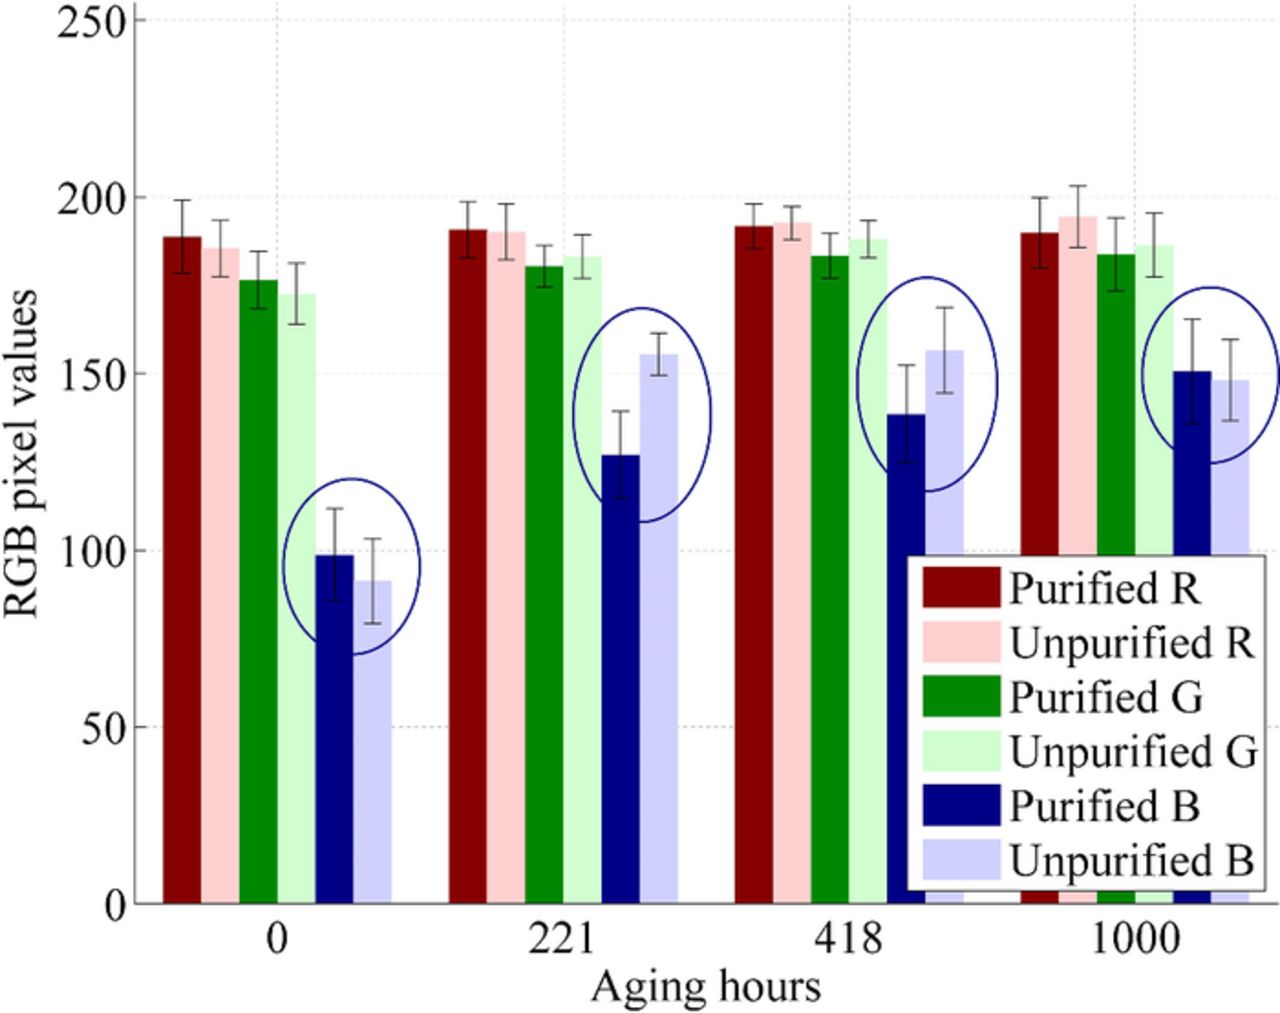
Figure 8. The average RGB values of the electrolyte in the photographs as a function of aging hours. The standard deviations of the values are also shown. The results are divided into two groups, cells containing purified electrolyte solvent and cells containing unpurified electrolyte solvent.
The analysis of the IPCE, photoelectrode impedance, and LC-MS results showed that the photoelectrodes of the cells did not degrade drastically. Instead, the IV, EIS at Voc, and Ilim tests together suggest that the main reason for the reduced performance is electrolyte degradation in both cell groups and that the degradation is faster with cells containing unpurified MPN. Cell photographing results in the same conclusion but also brings an important new piece of information: the degradation occurs through significant electrolyte bleaching. Electrolyte bleaching has been connected to UV exposure24,44,15,45,46 and suggested to be caused by oxidative species generated under the illumination.15,1,47,48 The illumination spectrum of the light soaking lamps is shown in S.I. Fig. B1. It indicates that the amount of UV in the lamp illumination is just one fifth of the UV illumination in the AM 1.5G spectrum. Even small amounts of UV light might, however, be harmful in the long term if UV light triggers side reactions leading to irreversible electrolyte degradation, as has been suggested.16,15,44 In this case, the damage caused by the UV light would simply be linearly related to the amount of UV in the illumination instead of having some threshold value below which no damage would be caused.
One suggestion for the reason for the different bleaching rates of the cells containing purified and unpurified MPN is that unpurified MPN contains more impurities that, together with UV or visible light, trigger the bleaching reaction. MPN could contain, e.g., water, which would react with the TiO2 when exposed to UV light.15,44,38 In this case, the bleaching could be retarded but not completely prevented by applying a UV filter, as there are no perfect UV filters. This is suggested also by our other study.16 Therefore, the effect of the purity of the electrolyte on bleaching is important for the overall cell stability.
Evolution of iodine concentration in the electrolyte
A difference in the bleaching rates of the cells containing unpurified and purified MPN was demonstrated in the previous section. The remaining questions are first, why cells have passed 1000-hour aging tests performed with the same light soaking device before34–36 but degraded in this study and second, whether the bleaching is caused by UV or visible light. These subjects are studied further in this section by estimating the evolution of the iodine concentration in the electrolyte in the cells of this study and comparing them to another study.24 The cell photographing results were used for estimating the iodine concentration as a function of the cumulative UV dose shown in Fig. 9. The cumulative UV dose is the product of the aging hours and the UV light level in proportion to the amount of UV light in AM1.5G illumination. A 0.03M concentration of iodine has been marked in Fig. 9 as representing the level below which current limitations probably appear in the cells.49
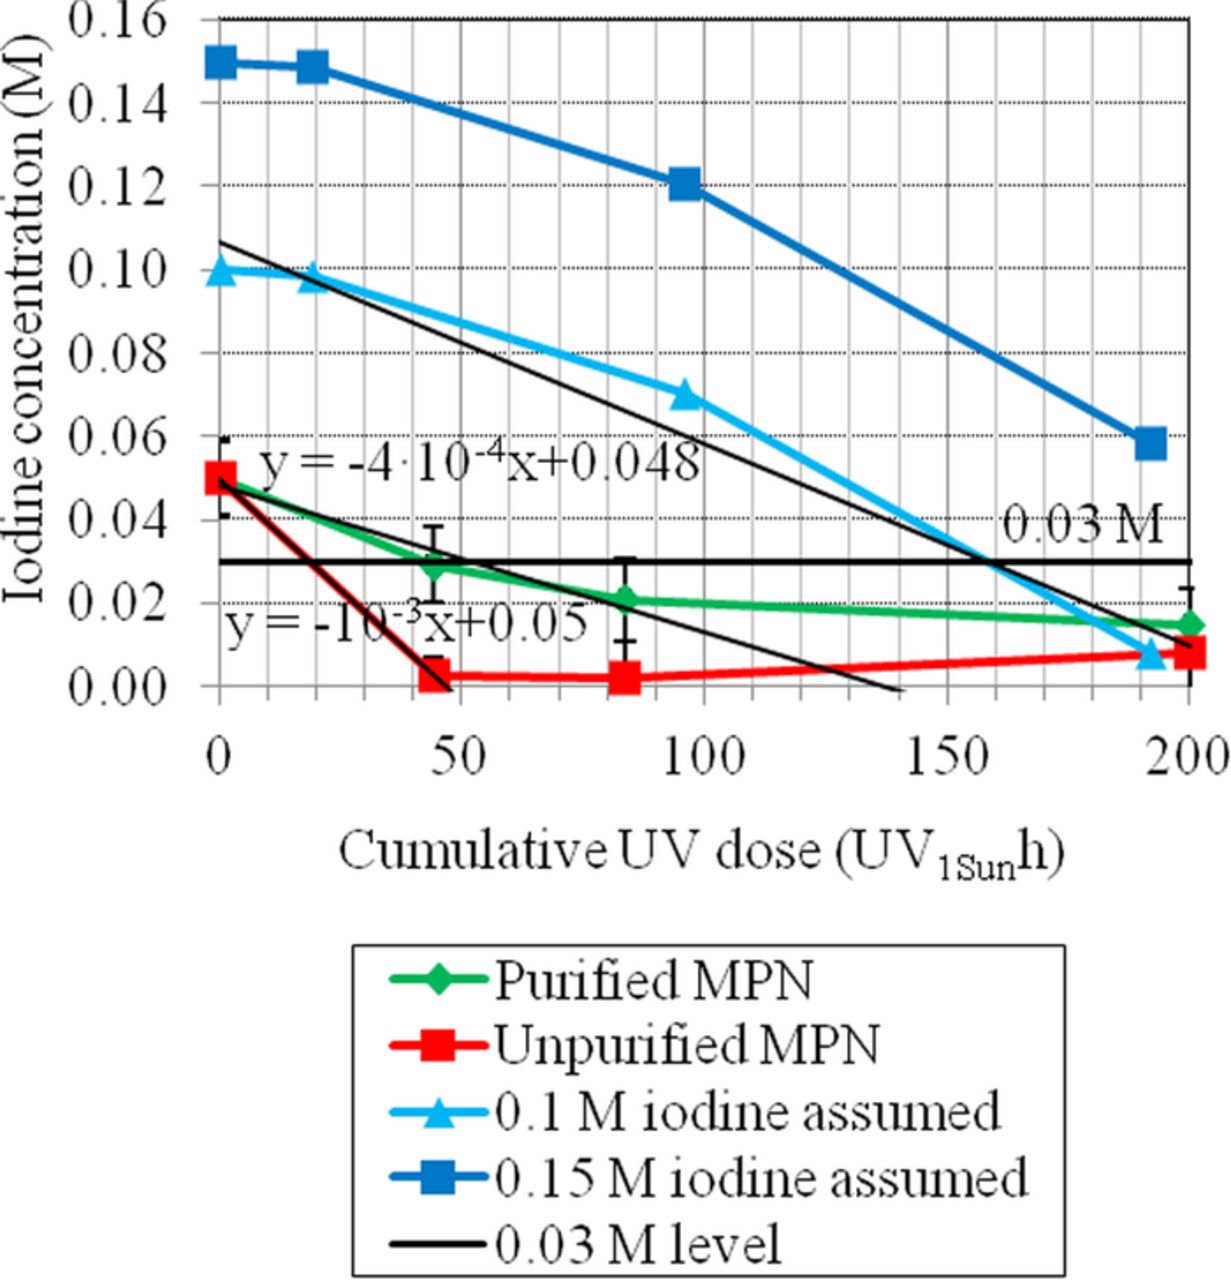
Figure 9. The estimated decrease in the iodine concentration during the aging as a function of the cumulative UV dose. The estimate has been made on the basis of the change in the blue pixel values of the electrolyte during the aging (Fig. 8) and the calibration of the setup (7.35 · 10− 4 M per blue pixel within 0.025-0.1 M iodine24). The red and green lines present the cells measured in this study. The blue lines present the cells in24 calculated on the basis of 24 and the assumption that the electrolyte initially contained 0.10 M or 0.15 M iodine. The linear trend lines fitted by the least squares method are marked in black.
The red and green lines in Fig. 9 represent the cells of this study. In this kind of plot the drastic difference in the bleaching rates of the cells containing purified and unpurified MPN is even more clearly visible than in Fig. 8: the cells with unpurified MPN cross the 0.03M line after roughly 20 UV1Sunh and the cells with purified MPN just after 45 UV1Sunh. Converted to the actual aging hours, these values are 100 hours and 225 hours, respectively. They match to the beginning of the performance degradation in the SCATU results quite well (IV measurement results section), which supports the hypothesis that electrolyte bleaching is the main reason for the degradation. The iodine concentration in both cell groups seems to saturate to the level that corresponds to the blue pixel value of the bare glass substrate in Fig. 9. Therefore, it is more probable that the saturation of the red and green curves in Fig. 9 illustrates a drop in the resolution power of the photographing technique when the electrolyte is nearly colorless than that it indicates the actual saturation of the bleaching.
A straightforward thought arising from Fig. 9 is whether the cell performance would remain stable for a longer time if more iodine were added to the electrolyte. Then the slope of the bleaching would still be the same but the starting point would be higher. This is also suggested by Mastroianni et al.15 The experimental confirmation of this question was not within the scope of this study, but a comparison was performed that was based on the aging data presented by Asghar et al.24 (the blue lines in Fig. 9). The most significant difference between the cells of Asghar et al. and the cells aged in this study is that the cells of Asghar et al. contained commercial Dyesol HSE-EL electrolyte. This is the same electrolyte that has been used in cells that have passed 1000-hour aging tests without a UV filter and using the exactly same lamps as in this study.34–36 The two blue curves in Fig. 9 are otherwise identical but have a different initial concentration of iodine because the commercial electrolyte used in34,35,36,24 was estimated to contain 0.10-0.15-M iodine on the basis of the color of the electrolyte. The line showing a 0.1-M initial concentration crosses the 0.03-M limit just after 155 UV1Sunh and the line showing a 0.15-M initial concentration does not reach the 0.03-M level at all in 200 UV1Sunh. This indicates that the cells would probably have passed a 1000-hour aging test conducted with the same light soaking device (0.2 UV1Sun) as that was used in this study. By comparing the slopes of the lines in Fig. 9 it is clear that the cells containing purified MPN are not less stable than the cells of Asghar et al. - actually, the slopes are remarkably similar before the 85 UV1Sunh point. Therefore it can be concluded that the cells in this study are as stable as expected but failed to pass the aging test because they did not contain that much iodine.
Asghar et al. aged the cells under lamps that emitted 80% of the UV light in AM1.5G irradiation but the same amount of visible light as in this study. Because the bleaching rate in Fig. 9 is plotted as a function of the cumulative UV dose and the bleaching rates of the cells containing purified MPN and the cells prepared by Asghar et al. are the same, it is likely that the electrolyte bleaching was caused mainly by UV rather than visible light in this study (see investigation of electrolyte bleaching section).
Additionally, Fig. 9 illustrates the fact that with the bleaching rates of this study and article,24 the cells would only survive under solar irradiation for a few dozen days without a UV filter. Based on the bleaching rate of the cells containing purified electrolyte solvent calculated in this study, similar cells would probably survive a 1000 hour aging test with a UV filter that would pass roughly 4.5% of the UV irradiation. This drastic difference might explain why controversial dye solar cell stability results are sometimes reported, especially when the cells contain significant amounts of impurities such as water. Extremely good UV filters should be applied on top of the cells to slow down the bleaching so much that the cells would survive for twenty years: assuming that the MPN in the electrolyte is purified, the initial iodine concentration is very high (0.15 M), the minimum amount of iodine for normal cell operation is 0.03 M, and the yearly illumination corresponds to 1000 hours of AM1.5G irradiation, a filter that allows less than 0.6% of the incoming UV light to pass through would be needed. The application of UV filters that are this good reduces the overall efficiency of the module50 and probably increases production costs. Therefore, further improvements in cell stability under UV illumination would be advantageous.
The photographing results can be summarized in three conclusions. First, simply increasing the concentration of iodine could lead to stable performance in a 1000-hour aging test even if long-term stability were not achieved. A lower concentration of iodine explains why the cells degraded quickly in this study, while earlier cells have passed similar 1000-hour tests. Second, the impurities in MPN, e.g. water, lead to significantly faster bleaching of the electrolyte, possibly because of UV-induced side reactions. Third, even an amount of UV corresponding to one fifth of the UV in solar irradiation is probably a significant factor in cell stability tests. Therefore, the use of UV filters and the portion of UV in the spectrum of light soaking devices should be reported accurately in studies considering cell stability.
Summary
In this study three main questions were studied. First, could purification of the electrolyte components affect the initial cell performance? Here it turned out that the purification of the electrolyte had no statistically significant effect on the initial performance characteristics. No differences were found in any of the numerous other tests performed in this study in the initial state, either.
Second, could the purification of the electrolyte components extend the cell lifetime? On the evidence of this study, the cell lifetime increases as a result of the purification of the electrolyte solvent (methoxypropionitrile in this case). From an industrial viewpoint, electrolyte solvent purification should be considered as part of the manufacturing prosesses for dye solar cells. The purification of the other electrolyte components did not lead to improvements in the cell lifetime.
Third, what kind of mechanism causes cell degradation during the aging test? On the evidence of the tests that were performed, the degradation of the cell under illumination results from similar mechanisms in the cells containing purified and unpurified electrolyte solvent, but the degradation rate is clearly faster in the latter cells. The electrolytes degraded massively during the aging under illumination through bleaching. The bleaching rate of the cells containing unpurified electrolyte solvent was almost double that of the cells containing purified solvent. The photoelectrodes of the cells degraded only marginally. Despite that, we interestingly found dye degradation products that have previously been reported only at elevated temperatures39,40,41,43 in cells aged under UV and visual irradiation below 40 °C. Some degradation products seem to form only under illumination, because they were not detected from cells kept in the dark at room temperature.
On the evidence of this study, UV-induced iodine bleaching seems to be directly proportional to the cumulative dosage of UV. Bleaching is most probably a combined effect of impurities and exposure to UV irradiation (approximately 20% of the UV in AM1.5G irradiation) during the aging test. UV is a significant factor in cell stability testing and therefore, the amount of UV in the illumination of aging lamps should be reported in cell stability studies. While the UV-induced degradation can be alleviated by using a UV filter, the filters are not perfect and preventing UV-related degradation, e.g., as shown here by purifying the solvent, is important.
Acknowledgments
The authors thank Prof. Leif Kronberg (Åbo Akademi) for his expertise in LC-MS measurements and Dr. Eeva Vilkkumaa (Aalto University) for her assistance in the statistical analysis. This study was partially funded by Tekes - the Finnish Funding Agency for Technology and Innovation (project KesMPV, 2928/31/2010) and partially by the Multidisciplinary Institute of Digitalization and Energy (MIDE) of Aalto University (project FerroPV; 751026). S. R. thanks the Fortum Foundation for financial support and K. M. is grateful for a post-doctoral project (253643) funded by the Academy of Finland.