Abstract
Proton Exchange Membrane Fuel Cell cold start performance and durability from subzero conditions are dependent upon the cathode catalyst layer (CL) structure and interfacial binding to the membrane. The CL constituents and fabrication methodology impact the amount and location of freezing point depressed water available for proton conduction at subzero temperatures, water storage capacity and mechanical stability. Two common types of CL fabrication methods were studied to compare and contrast the nominal operational performance (80°C polarization curves) and water storage capacity at −10°C, −20°C, and −30°C; Decal Transfer versus Direct Spray. The cathode platinum on carbon CL constituents were also varied; ionomer-to-carbon support loadings (20wt% and 30wt%) and ionomer equivalent weight (830EW, 1000EW, and 1100EW). The different cathode CLs were assessed for resistance to proton conduction ( ) and electrochemical surface area (ECSA). The Sprayed cathode CL had the least
  and highest ECSA, while decreasing the EW negatively impacted the electronic continuity of the CL. The baseline configuration (1100EW 30wt%) nominal operational iR-free voltages at 500 mA cm−2 were 50 mV higher for the Spray method. Subzero isothermal water fill tests (WFTs) at −10 mA cm−2 measured water storage capacity at freeze-out; Decal transfer was 2-2.5x higher than Spray CLs.
Export citation and abstract BibTeX RIS

This is an open access article distributed under the terms of the Creative Commons Attribution 4.0 License (CC BY, http://creativecommons.org/licenses/by/4.0/), which permits unrestricted reuse of the work in any medium, provided the original work is properly cited.
Proton exchange membrane fuel cells (PEMFCs) are seen as a commercially viable alternative to the internal combustion engine by automotive manufacturers, reducing the world's reliance on fossil fuels and our carbon footprint. One of the major obstacles to widespread adoption of PEMFCs is the poor tolerance of their nano-porous materials to sub-zero temperatures, especially cold-starting from sub-zero. During such cold start-ups water produced within the three-dimensional structure of the cathode catalyst layer (CL) may exist in both frozen and non-frozen states. Any ice produced directly impacts the ability to start the PEMFC system, the performance and, ultimately, durability. The freezing of product water may cause swelling (frost heave) resulting in mechanical damage and reduced electronic and ionic conductivity. Liquid product water may migrate to colder regions in the PEMFC where it will freeze, blocking channels and reducing reactant/product transport. To understand and mitigate these issues, testing and modeling have been performed by universities, automotive manufacturers and national laboratories.1–3
In a single PEMFC there are multiple symmetrical material layers uniformly compressed between electrically conductive anodic and cathodic flow fields. The reactants and products are distributed via the flow fields through electrically conductive hydrophobic gas diffusion layers (GDLs, approximately 200 μm thick). Adjacent to the interior of the GDLs are the anodic and cathodic CLs that are 3-dimensional agglomerates comprised of electrically connected carbon supported platinum (Pt/C) nanoparticles partially encapsulated with sulfonated tetrafluoroethylene (Nafion) ionomer for proton conduction  , with Pt loadings equal to or less than 0.4 mgPt cm−2 resulting in thicknesses less than 10 μm. A Nafion proton exchange membrane (PEM, 15–50 μm thick) ionically connects and electronically separates the anode and cathode CLs of the PEMFC. Typically, in an automotive stack there are 350–400 repeat PEMFC units in series.
The hydrophilic nano domains of Nafion in the CLs at the Pt/C interface of the agglomerates and within the PEM have a minimum quantity of freezing point depressed water for operational  even at subzero temperatures. Freezing point depressed water remains in the liquid phase due to either curvature induced Gibbs-Thompson effects or acidity induced colligative effects of the sulfonated sidechains.4 A cold-start actively hydrates the Nafion ionomer due to production and mobility of freezing point depressed water and exothermically elevating stack temperature.5,6
Successful automotive cold-starts require attaining operational temperatures and power outputs within the first several minutes of load being applied.7 Unfortunately, the rigid end-plates used to apply the compressive load makes single cell PEMFC cold-start testing unrealistic as they act as a thermal sink to the cathode CLs exothermic temperature rise. Stack testing is cost prohibitive. A significant part of the cold-start data is therefore restricted to freeze/thaw events and isothermal water fill tests (WFT) related to water mobility and freeze location, in attempts to find materials and operational conditions that extend the water fill capacity to improve cold start-up performance and limit damage. Experiments with freeze/thaw cycling have shown that accelerated degradation takes place due to residual water within the CL prior to a freezing event.8 A significant fraction of degradation has been mitigated by drying out the PEMFC prior to freeze, however this does not meet the Department of Energy's Multi-Year Research Development and Demonstration plan's goals.7 Typically, isothermal WFTs (under low applied loads in the range of 10–100 mA cm−2) are used to predict cold-start performance (at high applied loads greater than 500 mA cm−2).9,10
Only limited experimental data exists regarding the optimization of CL material properties in an effort to improve the water storage capacity during automotive cold-starts. These properties may have a direct impact on the distribution, mobility and thickness of the freezing point depressed water at the surface of the Pt/C/ionomer agglomerates. The following studies have investigated the effect of hydrophilic additives11 and ionomer content12,13 on the water storage capacity. Miao et al. incorporated 5wt% of the hydrophilic additive nanoporous silica into the cathode CL and saw a drastic increase in storage capacity possibly coupled with the ability to temporarily cold-start a single PEMFC from −8°C, attributed to increased freezing point depressed water storage.11 It is impossible to directly compare results by Hiramitsu et al. and Mishler et al. on ionomer content as their fabrication and testing protocols differ drastically, however the general trend observed was that higher ionomer-to-carbon ratios increased the water storage capacity.12,13 Further, Mishler et al. demonstrated that the water storage capacity does not linearly scale with cathode CL thickness, attributing this phenomena to spatial variations of the reaction.13
Several WFT-based models have evolved with a rudimentary predictive capability to extend the water fill capacity.9–14,15 Nandy et al. used a non-isothermal model fit to isothermal data at different CL thicknesses (by controlling catalyst loading) to develop a criterion for a successful cold start:10
![Equation ([1])](https://content.cld.iop.org/journals/1945-7111/164/6/F582/revision1/d0001.gif)
where δm is the PEM thickness, Δλm is the available PEM water storage capacity assuming ultrathin CLs, mcp is the thermal mass of the cell and T0 is the cold start temperature. They found that as cathode CLs become thinner the loss in the amount of water storage capacity must be compensated for by either a drier initial condition or decreased thermal mass (such as decreasing the thermal mass of the flow fields).
CL fabrication is critical to PEMFC performance and durability under nominal operating conditions; several reviews have been written on the methods commonly used.16,17 The preparation methods result in structural differences within the 3-dimensional CL agglomerates, i.e. size and shape of pores.16,18,19 The inks include supported catalyst, solvent suspended ionomer, ultra-pure water, and solvent. The three main methods for CL fabrication are (i) catalyst coated PEMs using 'direct spray', (ii) screen printing for 'decal transfer' via hot pressing, and (iii) gas diffusion electrodes.20–22 Mixing of ink constituents is method specific and is done by either using a sonic horn, an ultrasonic bath or mechanical stirring. The agglomerate structure is controlled by the solvent//catalyst interface interaction, the solvent evaporation process, and if used hot pressing conditions.16,18,19 The decal transfer process to form the CL is prepared by making a catalyst particles, ionomer, and solvent emulsion and application onto a decal through a nano or microporous screen, then hot pressed to the PEM.20–22 The direct spray method applies thin layers of the catalyst ink in a suspension directly to a heated clamped PEM. Gas diffusion electrode fabrication is similar to the direct spray method except applied directly to the porous GDL.
Direct sprayed CLs have been demonstrated to outperform those prepared from the other two methods under normal operational conditions resulting in higher open circuit voltages, better beginning of life performance, and extended durability.23 Industrial scale CL manufactures favor the decal transfer method, due to reduced costs and complexity. One of the reasons for the poorer performance of the CL prepared via the decal transfer method is because of the collapse of the pore structure by hot-pressing during the decal transfer process; which reduces the pore size and induces large concentration gradients limiting high current density performance.24 A second reason is the formation of an ionomer skin formed during the hot-pressing transfer process at the decal interface; increasing mass transport resistance and reducing electrical contact between the GDL and catalyst particles within the CL.25 PEMFC performance may be optimized with regard to the ionomer/carbon ratio and its effect upon  , electrical continuity and mass transport.18 Lowering the ionomer equivalent weight (EW, weight of ionomer per sulfonic acid group) may increase the sub-zero water storage capacity by increasing the acidity and thus further depressing the freezing point of the water.
The focus of the study herein centers on the WFT performance of the two primary cathode CLs preparation methodologies, i.e. direct spray and decal transfer, using method specific ink compositions. Two additional parameters that were varied in the CL preparation were the ionomer-to-carbon ratios (20wt% and 30wt%) and the EW of the ionomer (830EW, 1000EW, and 1100EW). The performance was evaluated by operational temperature polarization curves and analysis of the electrochemical surface area (ECSA) and resistance to proton transport ( is equal to
  ) within the cathode CL in addition to the subzero water fill capacity (at −10°C, −20°C and −30°C) and initial pre-conditioning water contents (λinitial of 1.8, 2.4, and 3.2).
Experimental
Fuel cell assembly
Tests were performed in subscale fuel cell hardware consisting of symmetric 2.3 cm thick stainless steel endplates to apply uniform axial load across interior gold plated current collectors and distribute reactants/products to/from graphite gas flow field plates (BMC-940, MetroMold). The back side of the flow fields housed coolant channels for thermal regulation during normal operating conditions. The channel-to-land ratio of the flow fields was 2:3 and the thickness of each flow field was 3.175 mm. Two sets of flow fields were used within this study to adjust for the active area of the CLs (1) 50 cm2 with a five-serpentine pattern and (2) 16 cm2 with a three-serpentine pattern. Limjeerajarus and Charoen-amornkitt numerically evaluated multiple subscale flow field designs specifically three- and five-serpentine patterns.26 With a geometric oxidant flow rate of 100 sccm cm−2, under high applied load nominal operating conditions, minimal performance variations were observed in only the mass transport region. The GDLs surrounding the CL consisted of a hydrophobic macroporous layer and a hydrophobic microporous layer (SGL 25BC, Ion Power) to distribute the gasses from the flow fields and minimize interfacial liquid water accumulation during normal operating conditions. The anode/cathode CLs sandwiched the Nafion based PEM to form the membrane electrode assemble (MEA).
Decal transfer Cls
The 50 cm2 decal transfer CLs were prepared by Ion Power to specific equivalent weights (EWs) and ionomer-to-carbon (IC) ratios. Nafion non-reinforced 212 (NR-212) PEMs (50.8 μm thick) and ∼50% Pt catalyst on high surface area carbon (Pt/C) were used for all of Ion Power's MEAs. The anode CLs were from the same web with loadings of 0.3 mgPt cm−2 and bound with 30wt% Nafion ionomer (D521 1100EW, Ion Power). Three cathode CL webs were investigated with catalyst loadings identical to the anode: 30wt% 1100EW, 20wt% 1100EW, and 20wt% (D520 1000EW).
Direct sprayed Cls
The 16 cm2 direct sprayed CLs were prepared in-house using an airbrush (Badger 150) and directly spraying catalyst ink onto suspended Nafion HP PEMs (20 μm thick) or Nafion NR-212 PEMs. The IC ratios were identical for all CLs (30wt% ionomer) and the catalyst was 46.6% Pt on high surface area carbon (Pt/C, Tannaka (TKK)). Three MEAs were prepared with identical anode loadings of 0.25 mgPt cm−2 and bound with 30wt% Nafion ionomer (1100EW). Cathode loadings were all 0.35 mgPt cm−2: two were bound with 30wt% Nafion ionomer (1100EW) and deposited on either Nafion HP or NR-212 PEMs. The third was bound with 30wt% Aquivion ionomer (D83-06A, 830EW) deposited on the Nafion HP PEM.
Instrumentation
PEMFC testing was performed with a Scribner 850e test system to control reactant gas flow and relative humidity (RH), PEMFC temperature, measure voltage, and applied load. To maintain the PEMFC temperature through the Scribner test system, micro thermocouples for in-vivo application (T-type, Physitemp IT-24P) were placed in the flow field channels to sense the GDL surface temperature with heating pads located on the endplates of the fixture. To dissipate generated heat from the PEMFC and to freeze the PEMFC, the PEMFC was placed in a forced convection environmental chamber (Cincinnati Subzero MicroClimate), which was augmented with a peristaltic pump to circulate coolant. All electrical and feed/exit line connections were made through an insulated bulkhead fitting in the environmental chamber. Electrochemical analysis consisted of electrochemical impedance spectroscopy (EIS) and cyclic voltammetry (CV) using a frequency response analyzer and potentiostat (Solartron 1260 and 1287, respectively), procedural details expounded upon in the subsequent Baseline electrochemical characterization section.
Water content calculations
The RH was calculated using the August-Roche-Magnus approximation for saturation vapor pressure at the set dew point (TDP) compared to the saturation vapor pressure at T = 80°C:
![Equation ([2])](https://content.cld.iop.org/journals/1945-7111/164/6/F582/revision1/d0002.gif)
and the RH's were then converted into water contents (λ) with the water absorption isotherm fitted based on the following equation by Hinatsu et al.27,28
![Equation ([3])](https://content.cld.iop.org/journals/1945-7111/164/6/F582/revision1/d0003.gif)
Fuel cell conditioning
Initial conditioning of the PEMFC was performed using an accelerated conditioning cycle consisting of alternating between H2/N2 and H2/Air (anode/cathode) 15 times at 0.75/1.5 slpm, with a cell temperature of 70°C and a dew point temperature of 60°C (64% relative humidity, RH) allowing a stable open circuit voltage (OCV) to be obtained between each cathode gas exchange. After which, polarization curves (H2/Air) at the same conditions were performed 15 times. Then the cell was heated to 80°C, the dew points were elevated to 73°C (75% RH), and 10 more polarization curves were performed to ensure reproducible cell performance. The lower voltage limit for all polarization curves was 0.3 V. Cathode reductions (H2/N2) were performed between each polarization curve, to remove the surface Pt oxides by reducing the cathode potential to below 0.12 V.
Baseline electrochemical characterization
To quantitatively compare and contrast the cathode CLs of the MEAs under investigation in this study, electrochemical impedance spectroscopy (EIS) was performed to evaluate  and cyclic voltammetry (CV) was used to measure the ECSA. Baseline electrochemical testing was performed at a cell temperature of 35°C and a dew point of 30°C (75% RH) with symmetric 0.5 slpm H2 and N2 on the anode and cathode, respectively. The anode in the presence of H2 behaved as a dynamic hydrogen electrode (DHE) reference and counter electrode, while the cathode was the working electrode. To limit H2 crossover effects during CV measurements 4% H2 in 96% Ar was used as a DHE. The CVs were measured in the range 0.1 to 0.6 V vs. DHE at a sweep rate of 5 mV s−1. The ECSA was calculated from the proton desorption region of the CVs (anodic current between 0.1∼0.4 V vs. DHE) using 210 μC cm−2 as the conversion constant for a monolayer of protons adsorbed per surface Pt atom.29 EIS was acquired at 400 mV vs. DHE from 10 kHz to 100 mHz with a perturbation amplitude of 10 mV.
Freeze pre-conditioning
Prior to each freeze the cell was pre-conditioned to a set initial water content (λinitial). To pre-condition the cell: (i) a polarization curve was performed at a cell temperature of 80°C and dew point of 73°C, (ii) while supplying H2/N2 to the anode/cathode the dew point of the saturators was reduced to either 42.3°C, 51.7°C, or 61.2°C (corresponding to λinitial's of 1.8, 2.4, and 3.2, respectively), (iii) followed by acquisition of another polarization curve, and (iv) purging for >12 hrs in a symmetric N2 atmosphere at 0.75 slpm. After the purge and removal of gasses, the cell was then frozen to either: −10°C, −20°C, or −30°C. An electric shorting strap was connected to both the anode and cathode current collectors to protect the cathode from high potentials that would result in carbon corrosion during all steps in the absence of H2 on the anode.
Water fill tests
The isothermal WFTs were performed at subzero temperatures (−10°C, −20°C, or −30°C) in the presence of H2/Air at 0.05/0.10 slpm, to quantify the product water storage capacity.9,10 Initially an OCV was established greater than 0.97 V and then a small constant load of 10 mA cm−2 was applied. The cell voltage and cell resistance (via current interrupt) were monitored. The test was terminated at freeze-out when the cell voltage dropped to <0.1 V. All tests were replicated three times; all summative results are represented by standard deviation derived error bars.
Results and Discussion
Beginning of life performance
After initial break-in conditioning of the various cathode CLs/PEM assemblies within the fuel cell hardware their respective performances were compared prior to freeze testing. They were evaluated for nominal operational polarization performance, as well as electrochemically characterized to quantify  (within the PEM and cathode CLs) and cathode CL electrochemical surface area (ECSA).
In Figure 1A, the final H2/Air conditioned polarization curves at 80°C are presented for the CLs prepared by Decal (black) and Spray (gray) fabrication methods. The voltages are iR-Free to correct for ohmic resistance effects due to the Nafion 112 and HP thicknesses difference. The respective ohmic resistances are displayed on the second y-axis in Figure 1A. It was assumed that the anode contribution to polarization curve was insignificant due to high hydrogen oxidation reaction rate kinetics compared to the sluggish oxygen reduction reaction on the cathode. The open circuit voltages (OCVs) were similar for all CLs tested (0.986 ± 0.013 V). The contribution of the cell resistance (second y-axis in Figure 1A) is on average 109 ± 8 m Ω cm−2 greater for the thicker PEMs used for the decal transfer CLs. However, the profiles under load exhibited cathode CL dependence on fabrication method, with the Sprayed performing the highest. For both fabrication methods, the baseline 30wt% 1100 EW ionomer CLs performed superior to their respective alternative compositions, with the Sprayed performing the highest. The two Decal CLs with lower ionomer content (20wt%) underperformed in comparison, due to significant activation losses. Reducing the EW negativity impacted performance for both the Sprayed and Decal CLs. The iR-Free voltages at 500 mA cm−2 in order of increased performance were: 0.58 V (20wt% 1000EW Decal), 0.60 (20wt% 1100EW Decal), 0.71 (30wt% 1100EW Decal), 0.74 (30wt% 830EW Spray), and 0.76 (30wt% 1100EW Spray).

Figure 1. Polarization curves at 80°C cell temperatures and 75% relative humidity: (A) H2/21% O2 and (B) H2/100% O2. Under ambient pressure.
To eliminate concentration and mass transport limitations from the performance analysis of the polarization results the measurements were acquired in the presence of 100% O2 under the same conditions, Figure 1B. A Tafel analysis was preformed between 10–100 mA cm−2 and the slopes for all the CLs centered around 82 ± 3 mV decade−1 supporting the absence of ionomer content or EW effects on the reaction kinetics. The origin of the performance differences between the two CL preparation methods were further investigated by quantifying the  and available ECSA within the cathode CLs.
Electrochemical impedance spectroscopy (EIS) was used to evaluate the  in the PEMs and cathode CLs. Using the method described by Pickup's group, the Nyquist plots comprise three connected distinct regions as shown in Figure 2.30 Faradaic currents are minimized by holding the cathode potential to 0.4 V vs. DHE. The Nyquist profile has the following order from high to low frequency: (i) the intercept where the line crosses Z' abscissa (real impedance), (ii) the linear 45° section, and (iii) the subsequent vertical 90° section. The intercept (i) is dominated by proton resistance within the PEM with a small contribution of electrical resistance. Electrical resistance could arise from electronic transport limitations within the cathode CL or contact resistance. The second transition (ii) in the Nyquist plot (linear 45° region) is due to proton resistance within the cathode CL scaling with thickness and is proportional to the ECSA due to the proton availability at the carbon support//ionomer interface. The final region (iii) where the line approaches 90° assumes the limit of capacitance and resistance at low frequencies. The
  within the cathode CL is determined by: 1) measuring the intersection of the 90° and 45° lines, 2) subtracting the real components of the intersection and the high frequency intercept (Rsheet), and 3) multiplying by 3 since
  = Rsheet/3. Numeric values are summarized in Table I. The PEM resistances demonstrate type dependence with Nafion NR-212 and HP having values of 0.303 ± 0.015 and 0.185 ± 0.005 Ω cm2, respectively. The Sprayed MEAs had the lowest
  for similar catalyst loadings, suggesting a more optimized CL structure. This was consistent with the profiles of the Nyquist plots in Figure 2 having a short 45° line segment length and a sharp 90° transition. Comparing the two Sprayed CLs, the 830EW had a slightly lower resistance which was in-line with the increased density of sulfonic acid end groups increasing
  . The Decal CLs showed inconsistencies in EW and wt% Nafion trends. Both the 20wt% Ion-Power
  values suggest a non-optimized triple-phase boundary of the catalyst//ionomer interface.
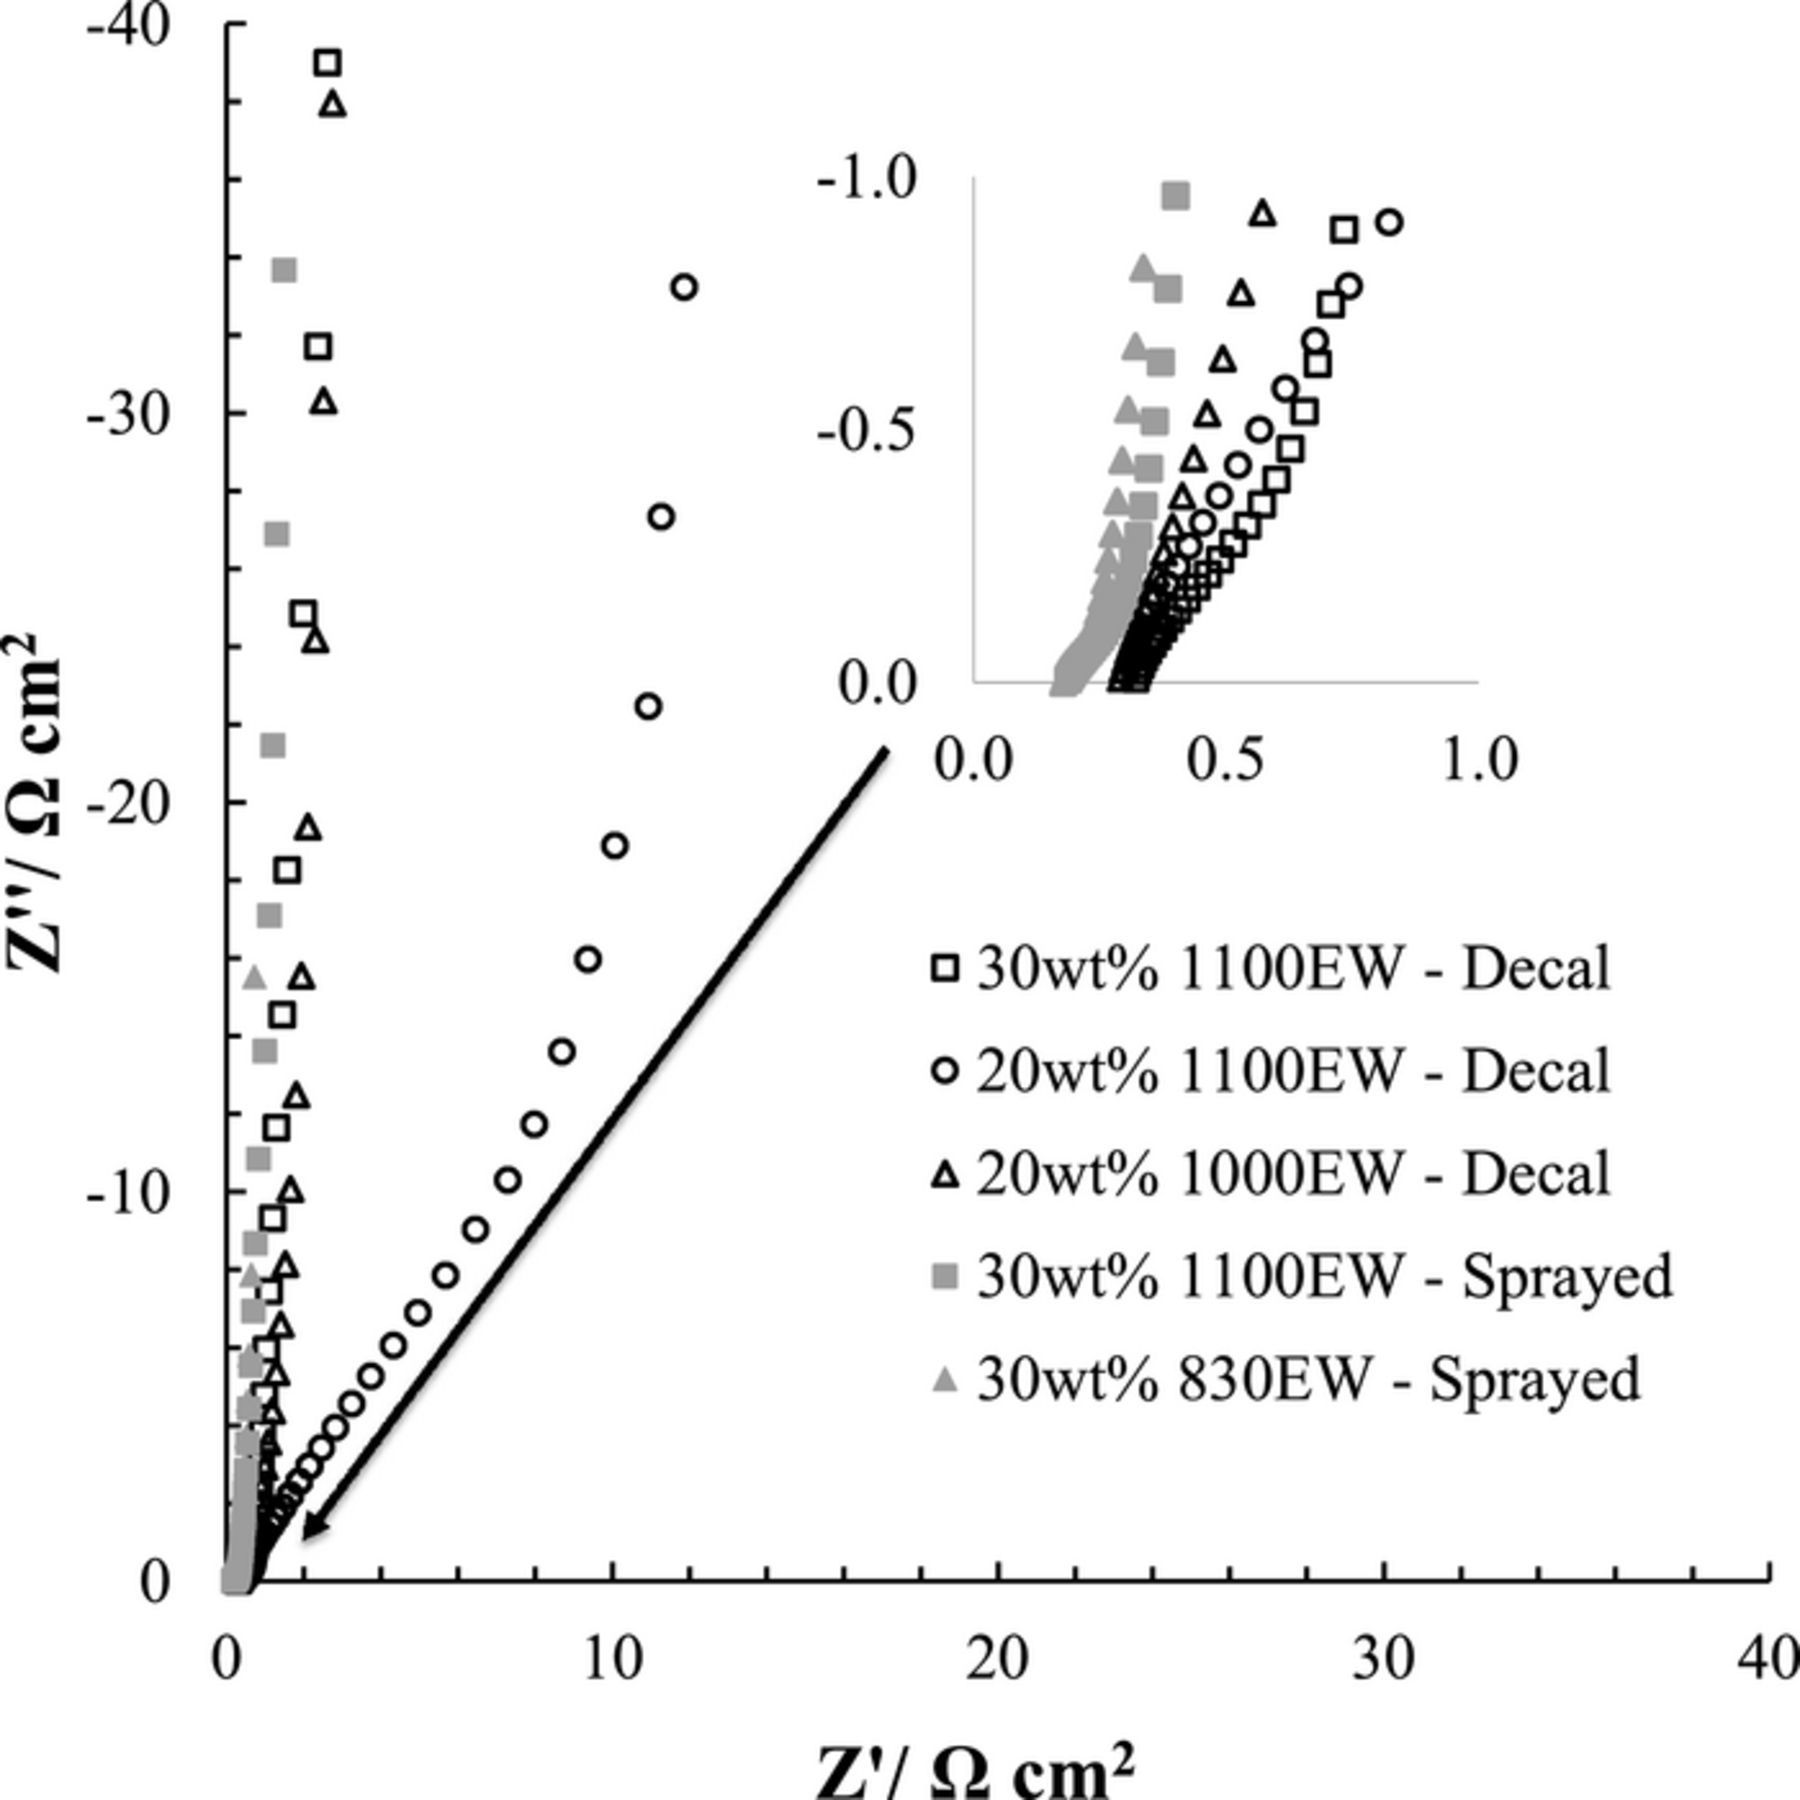
Figure 2. Electrochemical impedance spectroscopy of each of the cathode catalyst layer configurations at 35°C held at 0.4 V. Anode/Cathode (H2/N2) 0.5 slpm with 75% relative humidity.
Table I. Analysis at 35°C of the proton exchange membrane and cathode catalyst layer: resistance to proton ( ) conduction, electrochemical surface area (ECSA), and the double layer capacitance (CDL).
| Membrane | Cathode Catalyst Layer | |||||
|---|---|---|---|---|---|---|
| Rmem (Ω cm2) |  (Ω cm2) (Ω cm2) |
ECSA (m2 g−1Pt) | CDL (μF g−1Pt/C) | CDL/ECSA (μF m−2) | ||
| Decal – Nafion NRE 212 | 0.32 | 30% 1100EW | 1.4 | 32 | 117 | 3.66 |
| 0.30 | 20% 1100EW | 36 | 49 | 158 | 3.22 | |
| 0.29 | 20% 1000EW | 3.7 | 12 | 51 | 4.25 | |
| Spray –Nafion HP | 0.19 | 30% 1100EW | 0.94 | 40 | 127 | 3.18 |
| 0.18 | 30% 830EW | 0.86 | 29 | 92 | 3.17 | |
The CV profiles and the calculated ECSA values of the cathode CLs are summarized in Figure 3 and Table I, respectively. The CVs are normalized for ECSA. The available ECSA was found to be dependent on CL preparation method, as well as EW and wt% ionomer loading. Although, the loadings and catalyst types are similar (both high surface area carbon) for each preparation method the general CV profiles trend differently, see Figure 3 inset for baseline cathode CLs comparison. The Decal CLs have equivalent intensities in the low potential hydrogen desorption Pt(110) (∼0.19 V) and high Pt(100) (∼0.11 V) crystal facet peaks. The Sprayed CLs exhibited higher hydrogen desorption Pt(110) peak intensities. Differences in crystal facet expression suggest different catalysts were used for the CLs or the preparation methodology created fundamentally different ionomer//catalyst interfaces. The baseline 30 wt% ionomer for the Decal and Sprayed CLs had measured ECSAs of 32 m2g− 1Pt to 40 m2g− 1Pt, respectively. The  was slightly elevated in the Decal case by a factor of 1.5. This was consistent with the Sprayed CLs having the higher polarization curve performance (Figure 1). For the Decal CLs a reduction in ionomer loading from 30wt% to 20wt% resulted in an increase in ECSA, 32 m2g− 1Pt to 49 m2g− 1Pt, respectively. However, the
  conversely increased by 25x suggesting ionically isolated agglomerates that caused additional ohmic losses observed in the polarization profile and possibly reduced mass transport throughout the CL. Lowering the ionomers EW increases the acid content per mass, however, there appears to be increased electronic discontinuity in the agglomerates of the CLs, as seen in both the Decal and Sprayed CLs ECSA. This was in agreement with the ratio of the Pt/C double layer capacitance (CDL) and the ECSA 3.50 ± 0.47 μF m−2, which suggested disconnected 3-Dimension agglomerates.
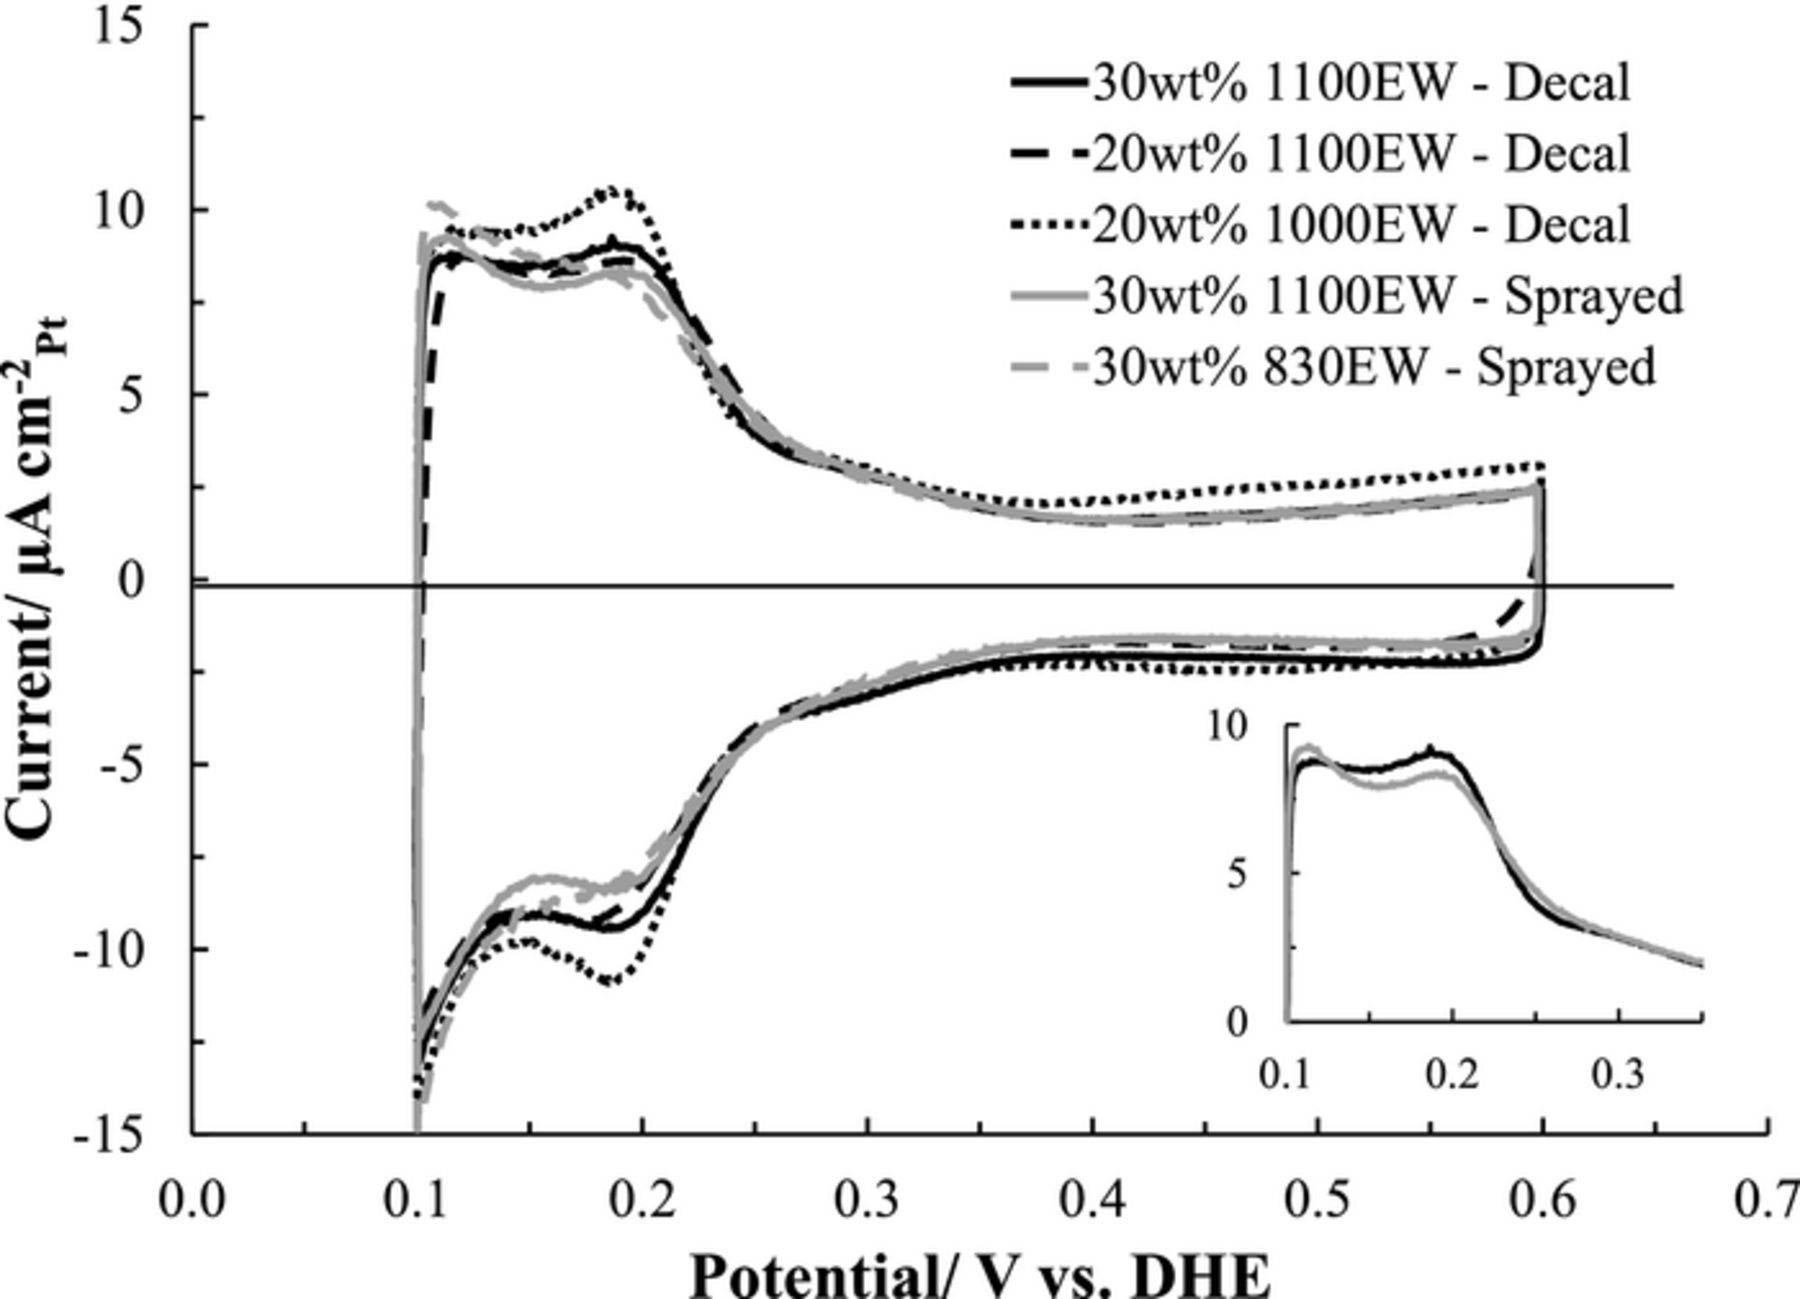
Figure 3. Cyclic voltammograms of each of the cathode catalyst layer configurations at 35°C and 5 mV s−1. Anode/Cathode (4%H2/N2) 0.5 slpm with 75% relative humidity. The inset compares the hydrogen desorption profiles for just the 30wt% 1100EW Decal and Spray cathode catalyst layers.
Subzero water fill tests
Catalyst layer fabrication comparison
PEMFC cold starts are challenging at low temperatures as the PEM conductivity is limited and the availability of freezing point depressed water is reduced.31 Isothermal water fill tests (WFTs) of single cell PEMFCs are the standard for material comparisons for predicting cold-start ability. In this study, WFTs were performed at −10°C, −20°C, and −30°C; the 30wt% 1100 EW baseline CLs for both the Decal and Spray methods and are plotted in Figures 4A and 4B, respectively. The MEAs were prehydrated to λinitial of 3.2 prior to freeze. There are five stages of a WFT: (i) The first is establishing the OCV by flowing the reactant gasses into the PEMFC, (ii) followed by applying a 10 mA cm−2 load across the cell which results in an initial rise in the voltage due to hydration of the connected hydrophilic ionomer domains of the cathode CL//PEM//anode CL.32 Subsequently, (iii) the voltage maintains a quasi-steady-state as the aforementioned ionomer domains reach maximum hydration.33 After complete hydration of the ionomer the (iv) product water moves out of the hydrophilic domains and starts to accumulate as ice in the open pores of the cathode CL resulting in a voltage drop due to mass transport limitations and/or disruption of the connected electronic pathways within the cathode CL.34 Finally, in stage (v) the voltage drops nearly instantaneously and is termed PEMFC freeze-out.

Figure 4. Temperature dependent isothermal water fill tests (H2/Air at 10 mA cm−2) of baseline catalyst layers. Prior to freeze preconditioned to λinitial = 3.2. A) Decal catalyst layers (30wt% 1100EW/Nafion NR212/30wt% 1100EW) and B) Sprayed catalyst layers (30wt% 1100EW/Nafion HP/30wt% 1100EW).
In general, the initial voltage on load (stage ii) was 100 mV lower for the Decal CL, which could result in additional ohmic heating and redistribution of the water. This possible ohmic heat induced redistribution in the Decal CL was suggested by stages (iii)-(iv) of the WFT being extended compared to the Sprayed CL. The product water, after filling the inner agglomerate pores of the CLs and ionic channels of the PEM, at the low current density of 10 mA cm−2 and minimal geometric oxidant flow rate (2 and 6 sccm cm−2, Decal and Sprayed CLs, respectively), is distributed in the open pores of the agglomerates within the cathode CL or at either PEM//CL or CL//GDL interface.32 The GDL's microporous hydrophobic layer, at the cathode CL interface, restricts liquid water transport. Table II summarizes the literature findings of water mobility into the GDL during isothermal WFTs. The higher applied loads and elevated flow rates promote thermal and convective transport of water into the GDL, respectively. The absence of a microporous layer and temperatures of −10°C or higher, also promote water transport. In the final stage (v) a sharp drop in voltage due to freeze-out was observed as the open pores of the agglomerates are filled with ice to a level that restricts O2 transport into the CL and the cell becomes mass transport limited. Stage (iv) is prolonged for the Decal CL, particularly at −10°C in Figure 4, possibly attributed to the poor adhesion of the CL to the PEM during hot pressing, resulting in potential pockets at the interface where water accumulated forming an ice lens.35 The Decal CL's WFT at −10°C has a nearly 2x greater time on load before freeze-out than the Sprayed CL. This observation further supports that liquid water is not being removed from the GDL during a WFT at a significant rate, as the smaller geometric size flow field with the Spray CL is not favorably impacted with a high water storage capacity.
Table II. Summary of literatures observation of water in the gas diffusion layer (GDL) with and without microporous layers (MPLs) during water fill tests. The oxidant flow rates were normalized for geometric surface area.
| Water in GDL | ||||||||
|---|---|---|---|---|---|---|---|---|
| Frozen | Oxidant Flow | Oxidant | Applied Load | "Excerpt from | Research | |||
| Temperature (°C) | GDL | MPL | Rate (sccm cm−2) | O2 (%) | (mA cm−2) | paper" | Group | Ref |
| −10, −20, −30 | SGL 25BC, 5% PTFE | Yes | 2, 6 | 21 | 10 | No | Rice | This paper |
| −30 | SGL | Yes | 1, 2, 4 | 100 | 10, 50, 100, 200 | No, "boundary condition" | Gasteiger | 40 |
| −30 | Toray | Yes | ? | 21 | 40 | No | Wang | 41 |
| −20 | Toray | ? | 10 | 21 | 20 | No, "rapid ice... preventing water migration" | Weber | 6 |
| −10, −20 | Thick Carbon Paper | Yes | 13 | 21 | 40, 80, 120 | "Interface... CL/ MPL... −10°C" | Tabe | 42 |
| −8.5, −10, −19 | SGL 24BC | Yes | 22 | 21 | 20 | Yes, "significant... GDLs...higher (than) −10°C" | Borup | 43 |
| −10, −15, −20 | SGL 24BC | Yes | 200 | 21 | 50, 100, 200 | Yes, "higher or equal to −10°C" | Oberholzer | 44 |
| −10 | 0 | 0 | ? | 21 | 0.5 V | Surface only CL | Ishikawa | 45 |
| −10 | SGL 25BC, 5% PTFE | Yes | ? | 21 | 0.5 V | Yes | Ishikawa | 46 |
| −10, −20, −30 | 0 | 0 | ? | 21 | 0.3 V, 0.5 V | Surface only CL | Ishikawa | 47 |
| −10 | Toray TGP-H-060, 10% PTFE | 0 | 32 | 100 | 150 | Yes, "at −10 °C" | Büchi | 48 |
| −10, −20, −30 | Toray TGPN-060, 20% PTFE | 0 | 105 | 100 | 100, 200, 300 | Yes | Büchi | 49 |
For the three subzero temperatures studied herein, stages (i)-(iii) mirror one another for −10°C and −20°C (Figure 4). For both CL fabrication methods, the more negative temperatures cause reduced amount of non-frozen water and water mobility resulting in decreased water storage capacity. The WFT performance at −30°C was significantly reduced for both fabrication methods. Balliet and Newman's cold-state model attributes this to non-linear increases in PEM and CL ohmic resistances below −20°C.9
The work by Thompson et al. has demonstrated that PEM thickness and the anode CL do not significantly contribute to differences in the water storage capacity.32 To confirm the absence of PEM type/thickness, an additional baseline Sprayed CL was applied to Nafion NR-212 to directly compare to Decal CLs. Figures 5A and 5B compare the membrane dependence of the WFT profiles for the baseline CLs versus time on load for both voltage and high frequency resistance, respectively. For the Sprayed CLs the initial voltage for the Nafion NR-212 PEM was on average 57 ± 9 mV lower than that of Nafion HP, attributed to ohmic losses due to PEM thickness (average initial HFR difference was 0.44 ± 0.18 m Ω cm2). The additional lowering of the Decal CL's initial voltage for the identical NR-212 PEM may also be a result of activation losses due to differences in catalyst type and/or less optimized CL structure restricting  . The HFRs (Figure 5B) follow similar trends in which there was initially a decrease as the PEM becomes hydrated, associated with a rise in the voltage (Figure 5A), however the NR-212 PEMs are on average 0.18 ± 0.02 mΩ cm2 higher in minimum resistance while the HP PEM attains a minimum resistance 7.3 ± 0.5 min sooner. The maximum voltage under load was 53 ± 5 mV higher for the HP PEM. The profiles for the Decal and Sprayed CLs with NR-212 for first 20 min of time on load are nearly identical, with the voltage and corresponding resistance being slightly better for the Sprayed CL. Within stage (iv) of the WFT the resistance starts to rise attributed to electrical resistance due to ice lens formation either in the cathode CL or at either interface. The rise in resistance for the Decal CLs associated with the extended decline in voltage is assumed to be due to ice lens formation at the cathode CL//PEM interface due to hot pressing resulting in lower interface connectivity.35 The amount of product water produced prior to shutdown was identical for the Sprayed CLs, supporting independence on PEM type. Mishler et al. found only minor differences in water storage capacity between MEAs prepared with Nafion NR-211 and NR-212 (25.4 and 50.8 μm, respectively).13 Tajiri et al. found that for an initial water content between λ = 2 and λ = 4, negligible difference in water storage capacity was obtained for a single (30 μm) and double (60 μm) thickness GoreTex membrane with identical CLs.36
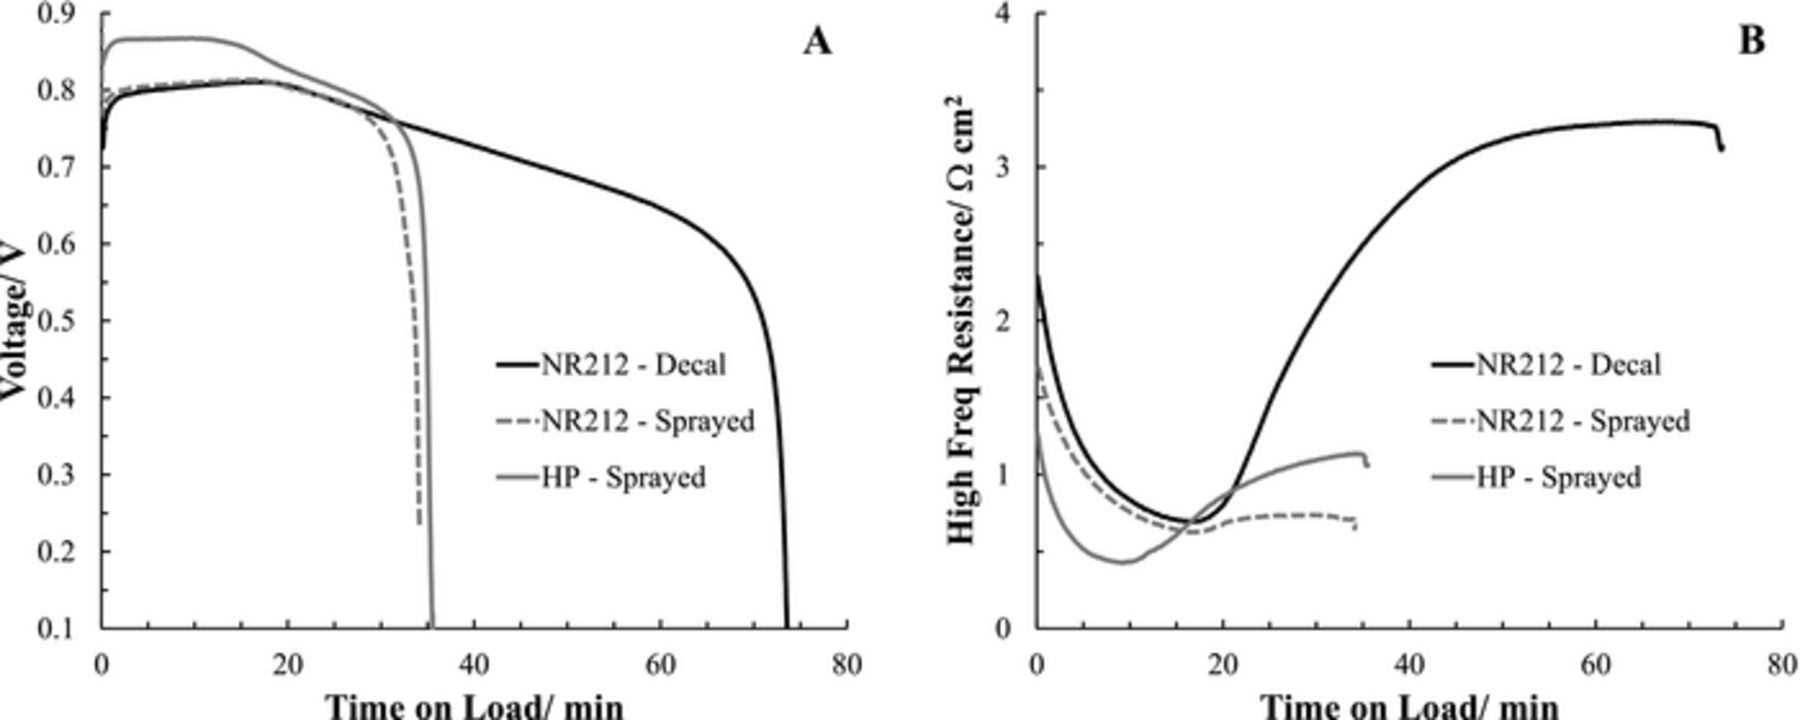
Figure 5. Membrane dependent isothermal water fill tests (H2/Air at 10 mA cm−2) of baseline catalyst layers. Prior to freeze preconditioned to λinitial = 3.2. All catalyst layers were 30wt% 1100 EW. A) Voltage and B) high frequency resistance versus time on load.
Ionomer comparison
The mobility and availability of non-frozen water within the hydrophilic portions of the ionomer decrease non-monotonically with temperature. A temperature comparison (−10°C, −20°C, and −30°C) of the WFT tests preconditioned to λinitial of 3.2 for the various CL types investigated within this study are summarized in Figures 6A and 6B, for the initial on-load voltages and the water storage capacities, respectively. All the initial on-load voltages (Figure 6A) were reduced with decreasing temperatures. The 30wt% 1100 EW baseline cathode CLs maintain an equidistant on-load voltage difference for both the Decal and Sprayed CLs, with the Decal having elevated values. Both CL preparation methods are equally negatively impacted by temperatures below than −20°C, attributed to reduced  mobility because of reduced curvature induced freezing point depression within the nanoporous agglomerate structures. The water storage capacity (Figure 6B) was corrected in accordance with the temperature dependent model of Ge and Wang; assuming at most 30% evaporative water removal at −10°C and less than 6% at −30°C.37 The water storage capacity was greatest for the Decal baseline CL and the loss was exacerbated below than −20°C in comparison with the Sprayed baseline CL. Thompson et al. observed that at −30°C there was a reduction in the ability of the CL pore structure to depress the freezing point of water.38 The water storage capacity predicted37 for the PEM and CLs for λinitial of 3.2 are 1.99 and 0.91 mg cm−2, for the baseline Decal and Sprayed CLs, respectively. Representative watermarks are shown in Figure 6B for these model predicted water storage capacities. At −20°C the Decal CL produced 1.7 mg cm−2 in excess of the storage capacity while the Sprayed only had 0.69 mg cm−2. The location of the additional water storage capacity, in excess of that predicted by the model, could be in either the GDL or at the cathode CL interfaces (facing GDL and/or PEM). As the GDL material is identical for both assemblies it is assumed to be equivalent and minimal for both, see Table II. The differences in surface structure at the CL interfaces has been demonstrated to store product water during WFTs. Mench's group has shown MPL/CL water accumulation ranging from 0.9–3.1 mg cm−2.39 Thus, some fraction of the unaccounted product water is assumed at the CL//GDL interface for both CL types. It is possible that the surface roughness is greater for the Decal, but improbable due to compression hot pressing during transfer to the PEM. Thompson et al. investigated −20°C isothermal WFTs that demonstrated at low current densities (10 mA cm−2) through cyro-SEM analysis that the cathode CL hydrates uniformly32 and that ice is formed within the cathode CL from the PEM to the GDL.40 The evidence suggests that the additional storage capacity is at the PEM//CL interface for the Decal CL due to poor adhesion.

Figure 6. Freeze temperature dependent isothermal water fill tests (H2/Air at 10 mA cm−2) at an initial water content of λinitial = 3.2. (A) Initial voltage on-load and (B) total water storage capacity prior to freeze-out.
Decreasing the EW of the ionomer in the Sprayed CL did not significantly impact either the initial on-load voltage or the water storage capacity, Figures 6A and 6B, respectively. This result is not in-line with the Authors' original hypothesis that increasing the ionic exchange capacity by lowing the EW would improve subzero WFTs. The reason for the 830 EW not having a higher water storage capacity was most likely linked to its 72% lower ECSA (Table I) limiting full utilization of the CL. For the Decal CLs, decreasing the EW and the wt% resulted in an adverse reduction of the initial on-load voltage and the water storage capacity. The 1000 EW at 20wt% did slightly outperform the 1100 EW at 20wt%. Table I links the poor performance of the CLs to the high  of the 1100 EW 20wt% CL and the low ECSA of the 1000 EW 20wt% CL.
The impact of the anode on the water storage capacity was investigated by testing a Decal CL with 20wt% 1100 EW on the anode and the baseline CL on the cathode, Figures 6A and 6B. Both the initial on-load voltage and water storage capacity were found to mirror the standard 30wt% 1100 EW anode results, thus confirming the minimal water storage capacity of the anode during a WFT.
A λinitial (1.8, 2.4, and 3.2) comparison of the WFTs at −20°C for the various CL types investigated within this study are summarized in Figures 7A and 7B, for the initial on-load voltages and the corrected water storage capacities, respectively. All the initial on-load voltages (Figure 7A) increased with increasing λinitial, while the water storage capacity decreased (with the exception of the Decal 20wt% 1000 EW cathode CL). The Sprayed CL with the lower 830 EW has slightly improved initial on-load voltage than the baseline 1100 EW. The Sprayed CLs have a nearly linear increase in the initial on-load voltage with increasing λinitial, while the Decal CLs have a non-linear decrease exacerbated when the λinitial was below 2.4. This could possibly be attributed to improved encapsulation of the Sprayed Pt/C agglomerates with ionomer during fabrication leading to increased freezing point depressed liquid water at −20°C. Both Decal 20wt% CLs had lower initial on-load voltages compared to the 30wt% 1100 EW, while the 1000 EW showed less of a drop at λinitial at 1.8 than 1100 EW.
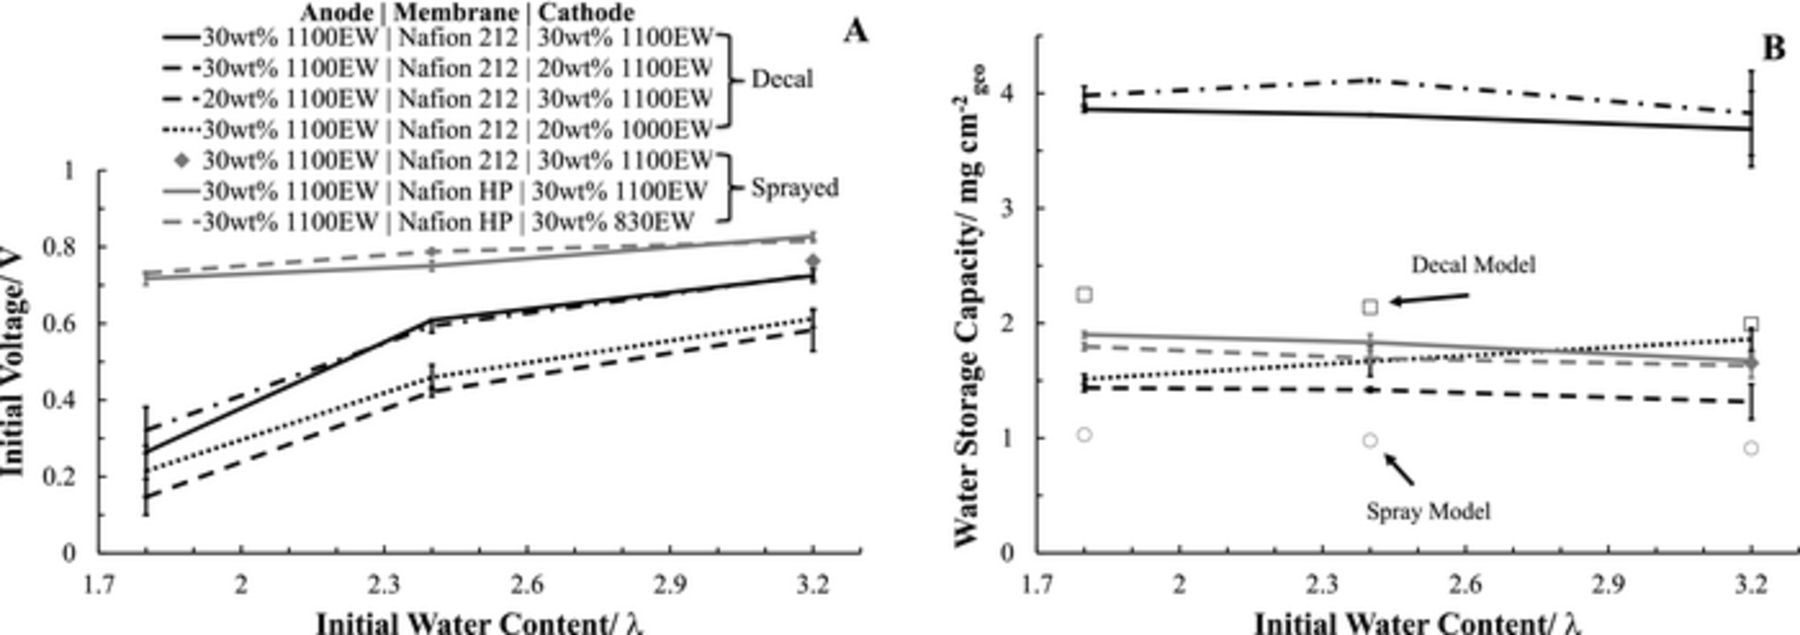
Figure 7. Initial water content dependent isothermal (−20°C) water fill tests (H2/Air at 10 mA cm−2). (A) Initial voltage on-load and (B) total water storage capacity prior to freeze-out.
Reducing the λinitial should allow for higher water uptake capacity.41 In Figure 7B the difference CLs tested herein only exhibit a slight increase in the water storage capacity with lower λinitial, except for the Decal 20wt% 1000 EW which showed the opposite trend.36 For the two baseline CL fabrication methods, with 30wt% 1100 EW in the cathode CL, the one that performed best in the nominal polarization curves at 80°C (Figure 1) had the 2–2.5x lower water storage capacity at −20°C irrespective of λinitial (Figure 7B). Within Figure 7B are the model predicted λinitial dependent water storage capacities for the two baseline CL types. The non-conformity of the λinitial water storage capacity trend of the Decal 20wt% 1000 EW cathode CL may be attributed to poor connectivity of ionomer domains between the agglomerates.
Conclusions
The cathode CL constituents and fabrication method significantly impact both nominal operational performance and subzero water storage capacity. At operating conditions, the open circuit voltages for all the CLs were similar (0.986 ± 0.013 V), however the polarization curves under load exhibited dependence on cathode CL fabrication method, ionomer wt% and ionomer EW. The baseline CLs with 30wt% 1100EW performed better than other respective compositions, with the Spray at 500 mA cm−2 being 50 mV higher than the Decal. Tafel analysis performed on polarization curves with O2 showed 82 ± 3 mV decade−1 suggesting performance kinetic were the same for all CLs. The polarization performance of the Sprayed CLs correlated strongly with the  and ECSA, with the decreasing EW increasing acid content but adversely disrupting the electronic continuity between agglomerates of the CL.
Isothermal water fill tests showed significant differences in voltage profile and water storage capacity for CL preparation method, ionomer wt%, and ionomer EW. For the same temperature/initial water content, the initial on-load voltages for the Decal CLs were ∼100 mV lower which may cause additional ohmic heating. At −10°C, the baseline Decal CL had a 2x greater time on load before freeze-out than the baseline Spray CL. This might be attributed to ohmic heat induced water redistribution and/or ice lens formation at the cathode CL/PEM interface. The membrane thickness had negligible impact on the water fill capacity. The initial on load voltage decreased with decreasing subzero WFT temperature and λinitial, suggesting improved ionomer encapsulation of agglomerates during the Spray process. However, the baseline Decal CLs still had significantly higher water storage capacities compared to the baseline Spray CLs.
Acknowledgments
Funding for this work was supported by the Powe Junior Faculty Enhancement Award 2009 provided by Oak Ridge Associated Universities and the Center for Manufacturing Research at Tennessee Technological University.