Abstract
Here, we present a new method for studying and gaining new insights into microarc oxidation (MAO) and its corresponding nonequilibrium-state electrode reaction kinetics. We observed that the fundamental condition of microdischarge formation was the resistance nonequilibrium in the oxide film caused by the existence of a defective region. Specifically, the current always first passed through a path with the lowest resistance. After the first discharge, a ceramic phase (e.g., α-Al2O3) was formed, which changed the conductive properties of the defective region, and the resistance in the defective region was subsequently increased, which sent feedback to the next current distribution. This fundamental and inherent law rendered controlling and predicting the microarc system kinetics by the external environment difficult. Therefore, we developed a microarc algorithm and proposed a feedback coefficient k, which determines whether the anode current distribution is inclined to or deviates from the equilibrium state. Finally, we analyzed the k-frequency relationship and used frequency to experimentally describe various kinetic behaviors of MAO.
Export citation and abstract BibTeX RIS

This is an open access article distributed under the terms of the Creative Commons Attribution 4.0 License (CC BY, http://creativecommons.org/licenses/by/4.0/), which permits unrestricted reuse of the work in any medium, provided the original work is properly cited.
Microarc oxidation (MAO) is an environmentally friendly technology for surface treatment of valve metals. Theoretically, in MAO, plasma is formed by increasing the electrical field energy between a cathode and an anode on a solid–liquid interface. A single microdischarge provides a highly ionized, high-temperature transient field characterized by a micro- or nanoscale spatial distribution and a microsecond-scale temporal distribution.1–5 Although MAO was found in the 1930s, its kinetics have yet to be revealed,6,7 and they are still a topic of empirical research. The spontaneous evolution of the microdischarges renders physical-state plasma hardly controllable or predictable by the environment. Moreover, MAO can be affected by many external factors such as the processing time, power supply parameters (current density, voltage, pulse width, pulse width interval, and single pulse waveform), electrolyte system (solute variety, solute concentration, and solution temperature), and base-metal-doped components (different grades of alloy).2,3 The action mechanisms of these factors are still unknown. These influence factors, sometimes even with an extremely tiny change, considerably affect the final film layer structure. Therefore, MAO should be studied from a systemic kinetics theory perspective that facilitates summarizing these influence factors. MAO can be technically controlled and predicted through theoretical guidance. Although the MAO technique can be applied to the surface processing of valve metals and preparation of compound coating,8 its potential is limited to the uniform growth of ceramic layers. If the microdischarge can be precisely controlled and predicted by the environment, just like traditional plasma, its unique space-time distributions enhance the potential and applicability of the MAO technique.
MAO contains abundant discrete microdischarges, but no macroscopic quantity from the electrode system can describe the space-time distribution of each microdischarge or the high energy difference among microdischarges. In this study, MAO kinetics was investigated from the perspective of statistical mechanics. Oxidation films on anode surfaces can be considered numerous microdistricts, which can be idealized as geometrical structures of any shape and very small size. A microdistrict (geometrical structure) represents the microcosmic material information of oxidation films. For instance, an MAO film contains diverse crystal structures, microcracks, and impure crystals.7 Therefore, among all microdistricts of an oxidation film, certain microdistricts have numerous lower-resistance microcracks and/or impure crystal boundaries. Other microdistricts contain a lower amount of microcracks and/or impure crystal boundaries, or even only pure valve metallic oxides, which indicate the higher resistances in these microdistricts. The method of ideally dividing an oxide film into microdistricts essentially involves partitioning an electrode system into subsystems and then statistically analyzing their characteristics.
If the resistance distribution among different microdistricts in the anode is uniform, the current distribution is equal and stable throughout a constant and uniform electrical environment. Under the condition of a uniform and steady current distribution, the electrode reaction kinetics can be fully adjusted and predicted by the macroscopic electrical environment. In this instance, the electrode reaction rate and measurable macroscopic quantity from the electrode system are time- invariant. If such a resistance distribution is nonuniform and if the electrical environment is constant, the reaction in any microdistrict has a feedback to the next-time current distribution among all microdistricts. The reason is that the increase in oxide resistance ΔR affects the spatial-temporal distribution of the next-time electrode reaction. In a nonequilibrium state electrode reaction, the spatio-temporal distribution of the electrode reaction is determined not only by the electrical environment, but also by the law that the current always first passes through the lowest resistance path. We find that MAO is developed and evolves according to this law. The self-organization behavior of the currents in different microdistricts causes the microdischarge group to evolve orderly with time, with changes such as an increase in the microdischarge size and occurrence of a spark discharge. The porosity of the structure and the growth pattern of the ceramic layer both evolve with the microdischarge group. The self-organization behavior cannot be described by the theory of the current electrode reaction kinetics.
Several methods have been established for studying the self-organization behavior, and such methods include control theory,9 synergetics,10,11 and complex system science.12 These methods are highly complex and applicable to only specific areas, except for the electrochemical system field. The self-organization system is still a considerably immature and leading theme in system science. According to the mathematical idea of cellular automata proposed in 1948,13 a system can be divided into infinitely small cells. Although one cell reaction provides a feedback to all cells, only the quantitative feedback relation between one cell and a few of its adjacent cells must be established, and thereby analyze the whole-system kinetics law. A microdistrict in an oxide film is equivalent to a cell. Therefore, this idea simplifies the statistical analyses of resistance distribution among numerous microdistricts.
In this work, we created a microarc system comprising 6061 aluminum alloys as the anode and stainless steel as the cathode. A high-frequency power supply (pulse width Don: 1–10000 μs; pulse frequency f: 100–100000 Hz; peak current Ip: 200 A; peak power Pp: 500 kW; peak voltage Up: 2000 V; duty cycle D: 1%–98%) provided an electrical environment between the anode and the cathode. The electrolyte was composed of a NaOH and (NaPO3)6 solution at a certain ratio. First, phenomenology was used to reveal the different kinetics laws and self-organization of MAO systems. Subsequently, the internal spontaneous behavior and feedback mechanism of MAO systems were qualitatively analyzed. The feedback mechanism was used to establish an MAO-system kinetics model (the microarc algorithm), and on the basis of this model, a feedback coefficient k was proposed, and its relationship with external physical factors was established. Next, k was used to quantitatively analyze the laws of anode resistance/current distribution, the microdischarge space-time distribution and its energy evolving laws, the ceramic-layer growing pattern, and micropore structure evolving laws. Finally, through experiments, different MAO kinetics laws as well as corresponding technical application were studied through a frequency-based regulation of k.
Experimental
Equipment and software
The power supply (MAO-4) was developed by Xi'an University of Technology. The output power was modulated in constant current mode. The pulse power outputs unipolar square waves. A JSM-7500 field emission scanning electron microscope (SEM, Japan) and a Cannon 1DS mark III digital single-lens reflex camera were used to record the surface morphology and microdischarges. The number of pores, average area, pore area variance, and porosity of the scanned images were detected through Image Pro Plus 7.0. Experimental data curves were plotted using Origin 8.0 and Matlab 7.0. The microarc algorithm was implemented in Matlab7.0.
Sample preparation
The substrate, 6061 Al alloy, was composed of the following elements: Cu: 0.15–0.4; Mn: 0.15; Mg: 0.8–1.2; Zn: 0.25; Cr: 0.04–0.35; Ti: 0.15; Si: 0.4–0.8; and Fe: 0.7 (mass fraction, %). The samples were round-shaped 6061 Al alloy thin sheets with a 50-mm diameter and 4-mm thickness. The electrolyte system of the 6061 Al alloy substrate comprised 0.0725 mol/L NaOH and 0.121 mol/L (NaPO3)6. The electrolyte temperature was maintained at 25°C through a cooling instrument. First, electrodeposition films were prepared by anodizing the Al alloy at a power of f = 1 kHz, D = 20%, and Ip = 20 A. The power was then stopped at the beginning of plasma formation. The samples were ready after pretreatment, and the SEM was used to observe the surface morphology in the central part of each sample; in this part, the effects of nonuniform radius of curvatures (ROCs) on electric field distributions were avoided. The initial time (t = 0) of kinetics was defined as the time at which plasma formation started. The abscissa of the kinetic curves of micropore density ρ, average area of single micropore E(S), variance between micropore areas D(S), and porosity K demonstrated the actual power-on time in the experiments. A notch was created on the center of a sample by using a drilling machine. The purpose of the notches was to generate a nonuniform ROC and electric field intensity (EFI) on the sample surfaces. In the experiments separately investigating the anode-cathode distance (ACD), the cathode was a needle-shaped structure, which was designed to generate a nonuniform ACD and EFI on the sample surfaces.
Self-organization in a microdischarge group
The critical characteristic of self-organization is a nonequilibrium state: When the external environment is constant, the measurable macroscopic quantity from the system is not time- invariant. In a nonequilibrium state (e.g. a tiny fluctuation breaks the systematic equilibrium), subsystems always cooperate with one another; hence, the entire system becomes orderly with time. In this instance, the kinetics predicted by external conditions is erroneous. The error in self-organization system forecasts was first proposed from the "butterfly effect."14 Therefore, to study whether self-organization occurred during microdischarges, the initial conditions (i.e., constant current, frequency, duty cycle, electrolyte temperature, and electrolyte component) were set constant. To clarify the internal evolution mechanism of a microdischarge group, we set these conditions constant; otherwise, the evolution of the microdischarge group may also change with time because of the perturbation or disturbance of the external conditions during the dynamic process. To validate the existence of self-organization, we specifically considered the differences in ROC/ACD among the sample surfaces. According to Gauss' law,15 theoretically, areas with smaller ROC/ACD have higher EFI/current density levels; therefore, according to a forecast, the microdischarges from these areas exhibit higher density and energy. On the basis of ROC and ACD, we used two methods to validate the existence of microdischarge self-organization. The following two conditions, if they are both satisfied, validate the existence of self-organization in a microdischarge group. (1) Under constant conditions, the sample surface was a flat area that demonstrated the same ROC, and the microdischarges spontaneously exhibited orderly structures with time. (2) Under constant conditions, the areas on the sample demonstrating smaller ROC/ACD caused wrong microdischarge predictions.
Emergence of orderliness in the microdischarge group
Figure 1 shows the microdischarges at different times (f < 10 kHz) during usual MAO processes. During the processing, the initial conditions were constant (i.e., duty cycle: D = 20%; pulse frequency: f = 1000 Hz; and peak current: Ip = 20 A), and the flat area in the middle part of the sample exhibited the same ROC and uniform electric field distribution (Figure 1a). The processing was completed without any perturbation or disturbance from the electrode structure or human factors. The microdischarge in the flat area, through continuous mutual swimming, caused the microdischarge group to exhibit spontaneous orderliness with time (Figure 1). Large-size microdischarges originated from the evolution of tiny microdischarges. Disordered and dispersed microdischarges occasionally emerged in a flower-like structure (Figure 1c). Although the number of microdischarges gradually decreased, each microdischarge changed from a white glow discharge (Figure 1a) to an orange arc discharge of high-temperature plasma (Figures 1b, 1c, 1d). The increasing coverage of microdischarges (Figure 1c) induced the oxide film porosity to increase. Similarly, as shown in Figures 2a, 2b, more microdischarge groups were orderly formed when the initial power frequency increased (f = 10–20 kHz); Figure 2a also illustrates a flower-like structure. The microdischarge group in Figure 2b shows a local cluster-like structure. These microdischarge group patterns also emerged without any perturbation or disturbance from the electrode structure or human factors. Moreover, these macroscopic patterns, with the microscopic swimming of each microdischarge, moved constantly along the sample surfaces. These phenomena confirm that in areas demonstrating the same surface ROC, microdischarges cooperate with one another to become orderly in a microdischarge group.
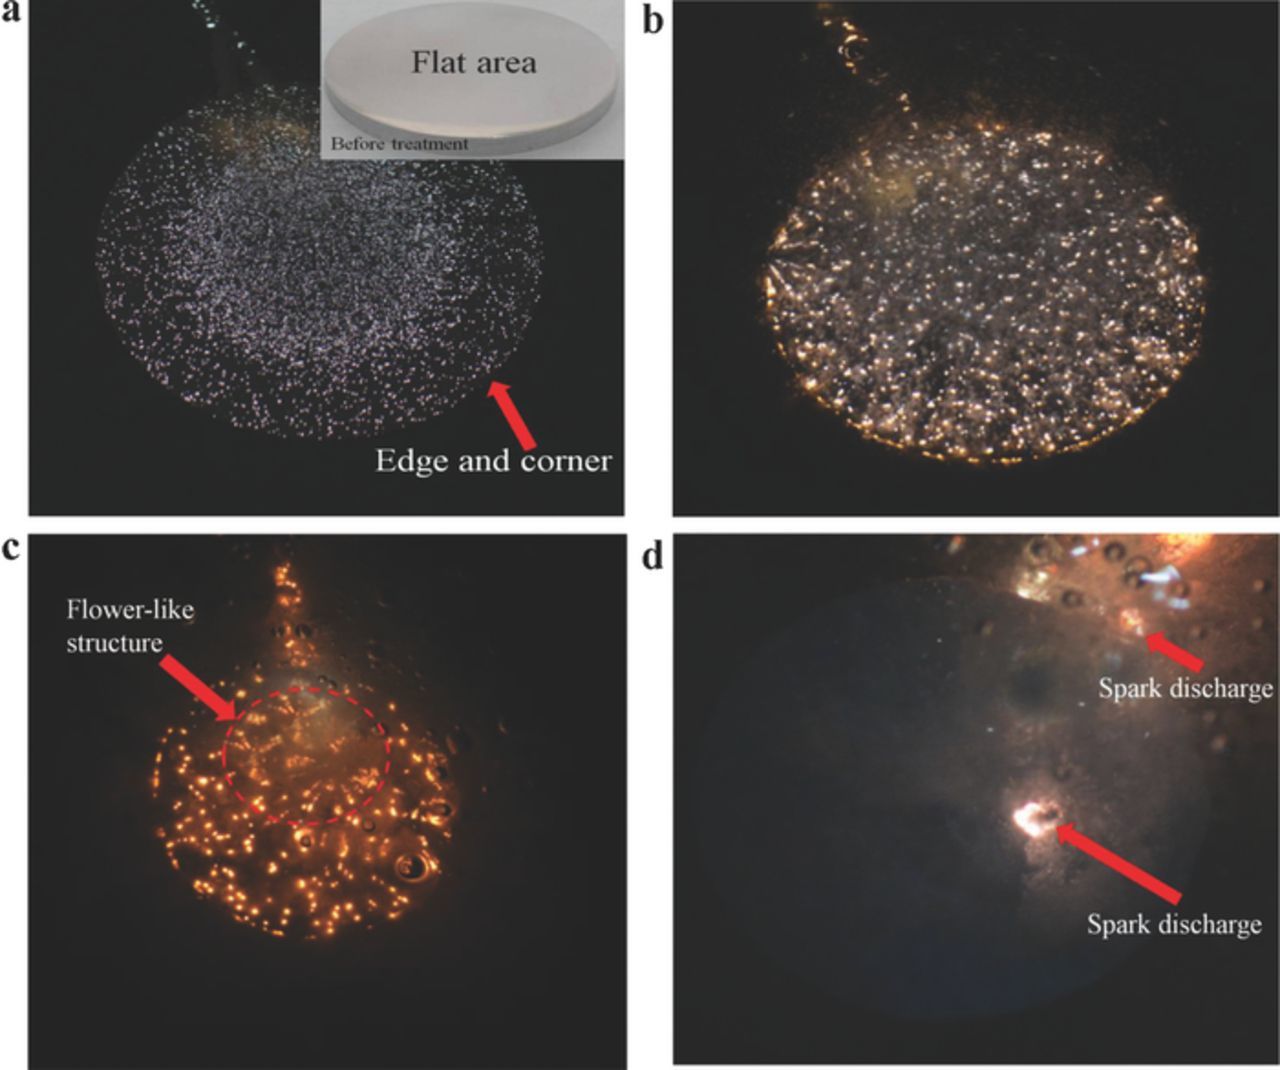
Figure 1. Microdischarges at a specific moment (nonequilibrium state; duty cycle: D = 20%; pulse frequency: f = 1 kHz; peak current: Ip = 20 A). (a) t = 15 s. (b) t = 70 s. (c) t = 120 s. (d) t = 330 s.
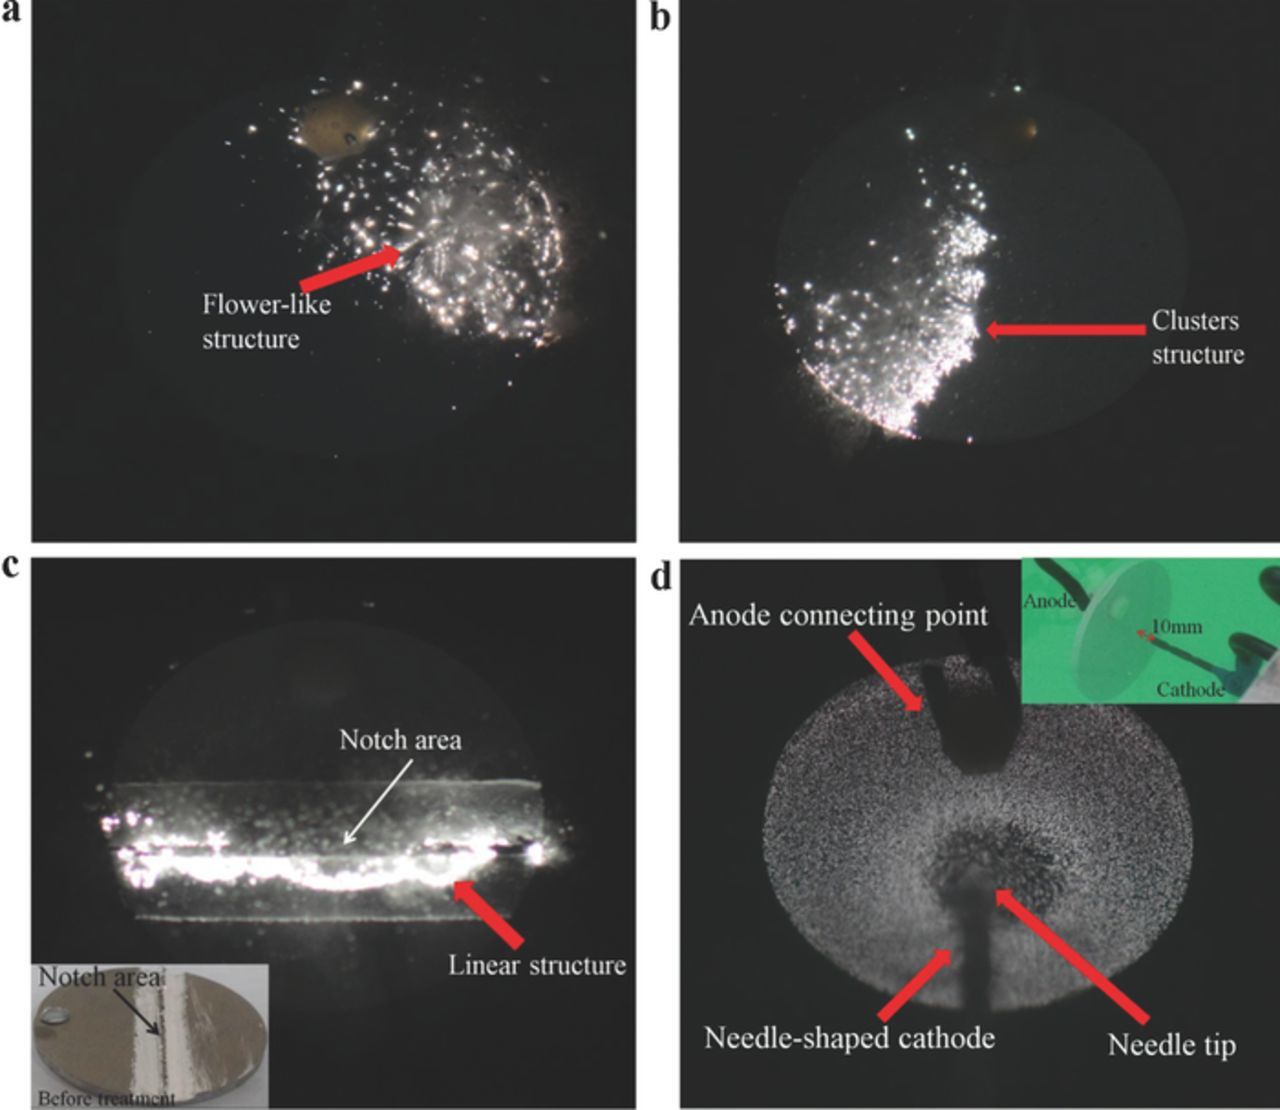
Figure 2. Microdischarges on the oxide film at different frequencies (nonequilibrium state; duty cycle: D = 20%; peak current: Ip = 20 A). (a) f = 10 kHz and t = 30 s; the dispersed and disordered microdischarges united to form flower-like patterns, and the pattern moved constantly along the surfaces. (b) f = 20 kHz and t = 15 s; a cluster of dispersed microdischarges spun periodically and in an anticlockwise direction on the surface. (c) f = 10 kHz and t = 15 s; the dispersed and disordered microdischarges united to form a line-shaped pattern, and the pattern moved constantly along the surfaces. (d) f = 1 kHz and t = 15 s; needle-shaped cathode, and the distance from the needle tip to the sample center was 10 mm. The microdischarge was sparse in the central area but dense in the other areas.
Errors in microdischarge forecast caused by electrode structure
Geometric areas with a smaller ROC (e.g. the margins in Figure 1a and the intentionally notched area in the middle part of Figure 2c) demonstrated higher EFI and current density levels. These areas were predicted to have higher microdischarge intensities, and the microdischarge did occur at an early stage. Nevertheless, after a certain processing time, the discharge did not occur in these districts (Figure 1a and Figure 2c). However, microdischarges assembled to the sample center (Figure 1a) and the flat areas behind the notches (Figure 2c), whereas the discrete microdischarges were evenly distributed in a linear structure (Figure 2c). In addition, similar to the prediction error in Figure 2d, we specifically designed a needle-shaped cathode structure, in which the pinpoint was 10 mm away from the sample center. The sample center corresponding to the cathode pinpoint exhibited a smaller ACD, and thus higher EFI/current density levels, than did the surrounding areas. According to the prediction, the microdischarge from the central area had a higher density and energy. Nevertheless, the central area showed an extremely sparse microdischarge, whereas the surrounding areas emitted small-density microdischarges (Figure 2d). These results revealed that areas with an extremely small ROC/ACD are ineffective in controlling or predicting the space-time distribution and energy of microdischarges. These phenomena confirm that the space-time distribution and the microdischarge energy in an MAO system are characterized by nonequilibrium self-organization behaviors.
Another kinetic law of MAO: Equilibrium state
As shown in Figures 3a–3c, when the initial power frequency increased to f = 50 kHz, the space-time distribution and energy of the microdischarges were both governed by another kinetics law, namely the equilibrium state, which is completely different from self-organization. In the flat areas having the same surface ROC, the microdischarge distribution was uniform, discrete, and disorderly (Figure 3a), but in the notched areas having an extremely small ROC, the microdischarge distribution, as predicted, was controlled within the notched area (Figure 3b). At the center of the sample corresponding to the cathode pinpoint, as predicted, the microdischarge was fixed at the point with the smallest ACD (Figure 3c). These phenomena reveal that the kinetics of an MAO system does not follow only one law or the nonequilibrium state. The kinetic laws of an MAO system can be controlled through the regulation of power frequency.
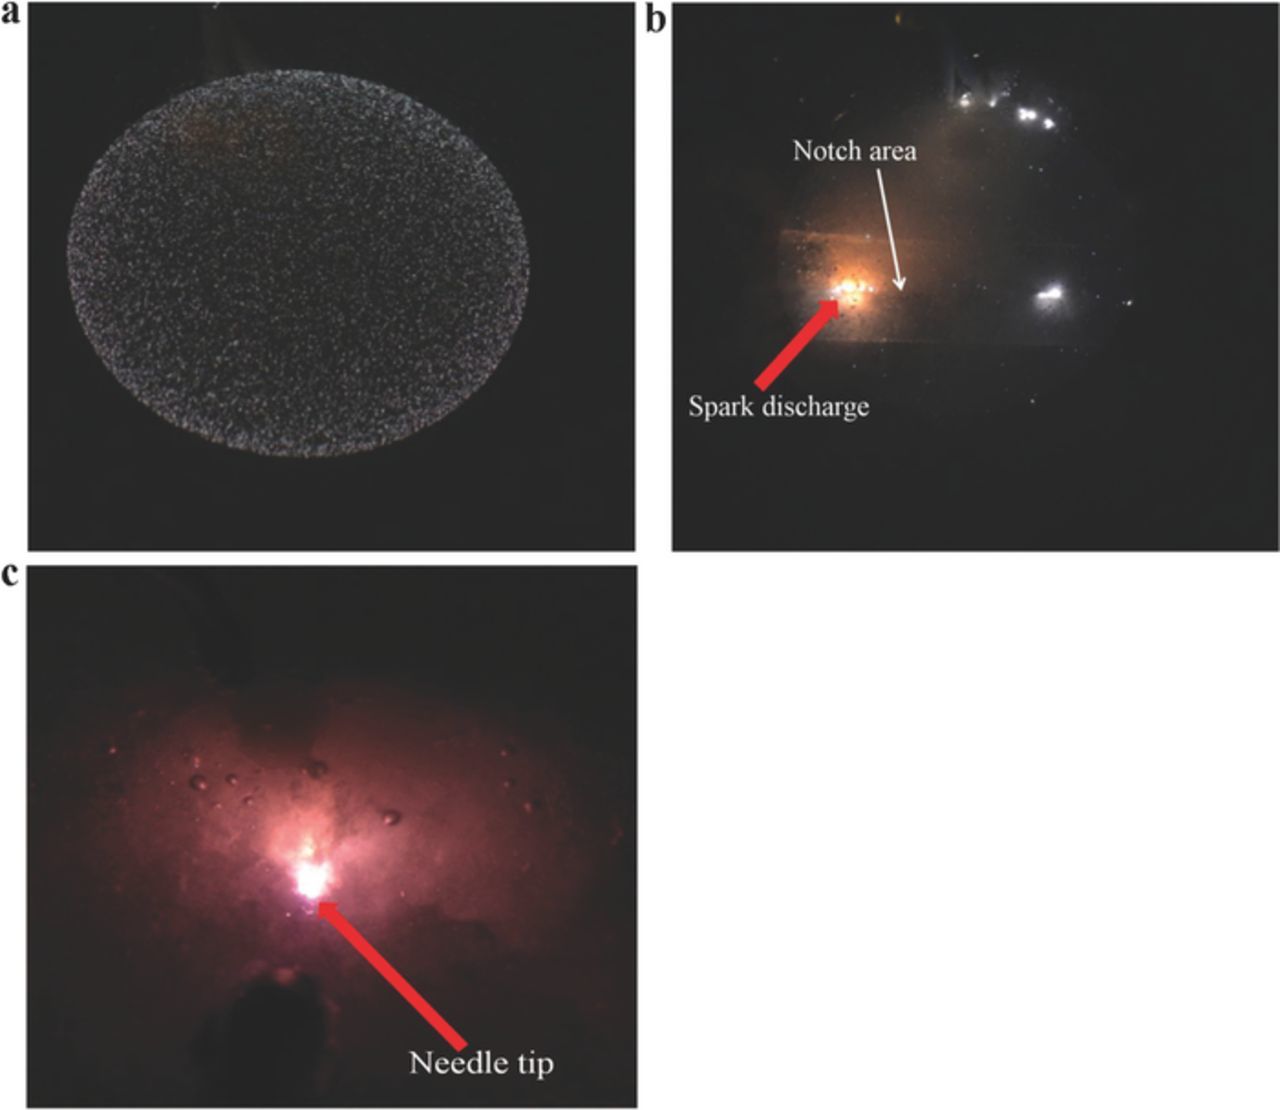
Figure 3. Microdischarges on the oxide film at f = 50 kHz (equilibrium state; dutycycle: D = 20%; peak current: Ip = 20 A). (a) f = 50 kHz and t = 1 s; the microdischarges were distributed discretely and uniformly. (b) f = 50 kHz and t = 2 s; streamer sparks arose at the notched center. (c) Needle-shaped cathode, and the distance from the needle tip to the sample center was 10 mm. f = 50 kHz and t = 150 s; streamer sparks arose at the needle tip.
Qualitative Theoretical Analysis of Self-Organization in MAO System
Theoretically, the resistances in the microdistricts of an oxide film should be equal. However, electric conduction defects are formed in the oxide film because of the presence of impure grain boundaries and microcracks.16,17 Defective microdistricts trigger the disequilibrium of a resistance distribution, thus resulting in a nonuniform current distribution. As we previously reported, the current caused a creeping discharge when a defective district demonstrated a relatively strong current intensity compared with other microdistricts.18 Therefore, a nonuniform current distribution (nonequilibrium state) is the fundamental condition for the formation of microdischarges.
The schematic diagrams in Figures 4a, 4b illustrate how the discharge-material interaction sent feedback to the next current distribution. Because of the thermal transmission of a microdischarge (R1 channel) at time Tn (Figure 4a), the defective district of an oxide film was melted and then cooled and solidified in an electrolyte after a short discharge. Hence, a crystal structure was formed (e.g., α-Al2O3 or γ-Al2O3), leading to a resistance increase in the original defective district.16 The current preferentially passed through a defective district with relatively low resistance, leading to the formation of a new microdischarge (R2 channel) at time Tn+1 (Figure 4b) and a nonuniform micropore distribution. The micropores in areas A and B possibly originated from the former discharge and new discharge, respectively (Figure 4c). Their micropore distributions were different because the discharge in area A exerted a feedback effect on the current distribution in area B. During the formation of microdischarges, the micropores always extended along the lowest-resistance path (Figure 4d).
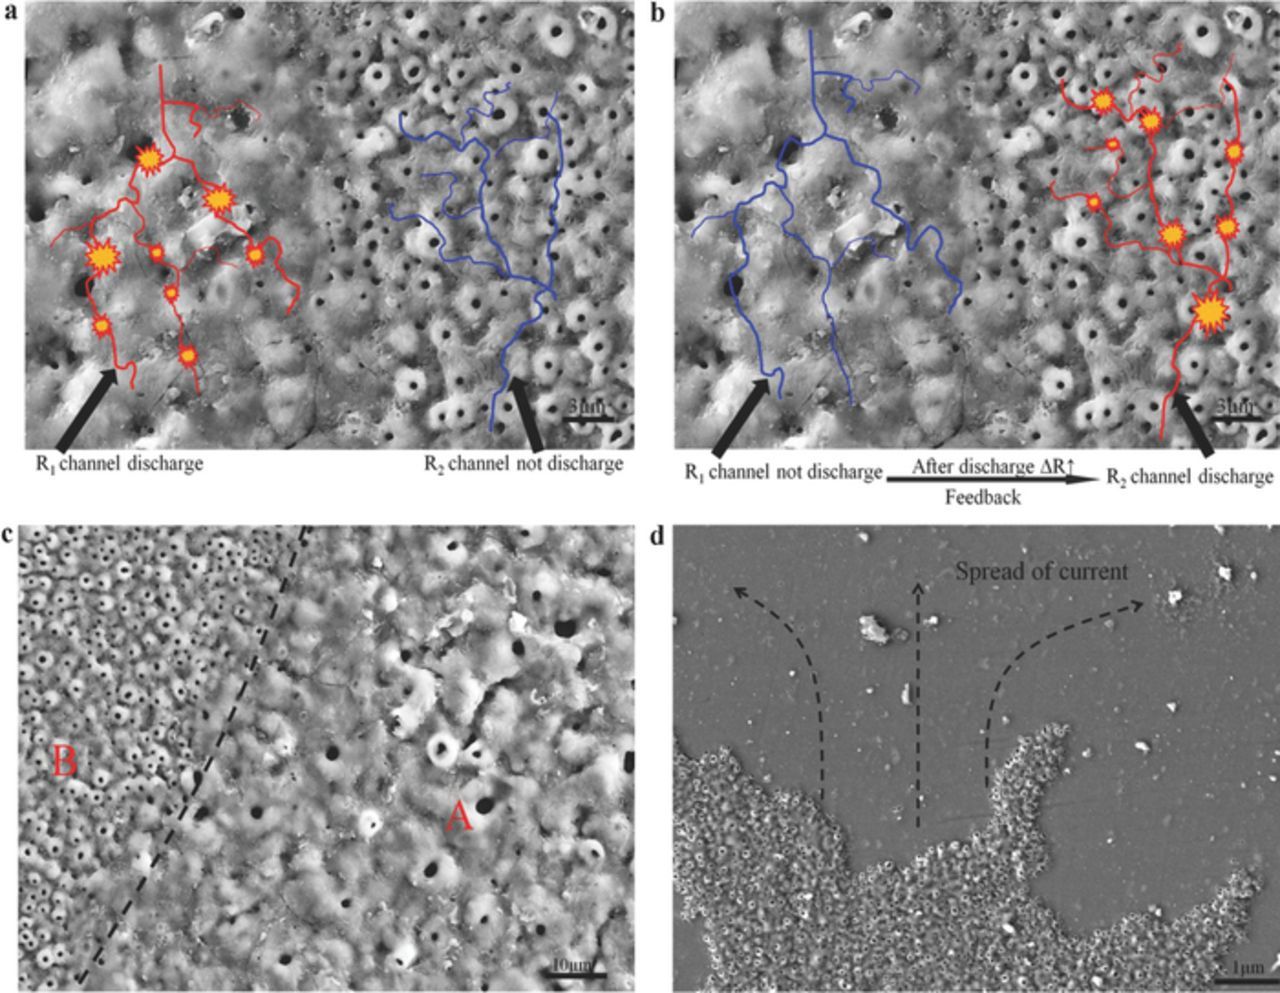
Figure 4. Schematic of the distribution and evolution of micropores on the oxide film surface. (a) At Tn, R1 < R2 and R1 was discharged. (b) At Tn+1, the resistance increased by ΔR after discharging in channel R1; possibly R1 > R2, and R2 was discharged. (c) Overlapping coefficient between areas A and B was extremely low. (d) Gas and/or discharged micropores always extended along the lowest-resistance path in microdischarges formation.
A microarc system is an open system with current-supplied power. If it is an isolated system, the current distribution is dispersed uniformly to reach a disorderly equilibrium state, according to the second law of thermodynamics. Because of the existence of defective microdistricts in the oxide film, the nonuniform resistance distribution drives the current at the anode to a nonequilibrium state. When sufficient current is accumulated in the defective microdistrict, plasma appears. The resistance of the defective microdistrict changes (denoted as ΔR) after the formation of an insulative ceramic phase (e.g., α-Al2O3; note: a ceramic phase probably includes α-Al2O3, γ-Al2O3, β-Al2O3, amorphous Al2O3 grains, and other complexes). ΔR exerts a feedback effect on the next-time current distribution. The preceding analyses indicate that the emergence and evolution of the microdischarge group is intelligent and self-adaptable.
Apart from the mutual self-feedback mechanism during the reconstruction of the current and material, the external electric field could not fully control or predict the microarc system kinetics. Both the EFI and current density levels were high in geometric areas having a small ROC (e.g., the margins in Figure 1a and the intentionally notched area in the middle part in Figure 2c). Therefore, the microdischarge intensities in these geometric areas were predicted to be higher. Nevertheless, after a certain processing time, no discharge occurred in these areas (Figure 1a and Figure 2c). The reason for the prediction error is as follows: Although the areas with a lower ROC demonstrated a higher initial current density compared with other areas, the defects (such as microcracks) in these areas crystallized after discharge. Therefore, the resistance in these areas increased, whereas that in other flat areas was relatively low. Because the difference in resistance between these areas with different geometrical structures increased and because the current constantly first passed through the lowest-resistance path, the spontaneous current attraction in the lower-resistance areas outweighed the control of current distribution in the areas with a lower ROC. Because of the spontaneous behavior, a higher amount of current naturally converges in the other flat areas next time, and the discharge is consequently transferred to the central flat area shown in Figure 1a and the flat areas shown in Figure 2c. As mentioned, the microdischarges from the central area (pinpoint) also migrated to and accumulate in the surrounding areas (Figure 2d). These results are inconsistent with the electric field distribution predictions, and even the notching process could not enable fix the microdischarges.
Clearly, the time-space distribution of the discharges was unpredictably orderly. The pattern in Figure 1c and Figure 2a was not caused by the surface geometry, but by the emergence of microdischarge groups without any external perturbation. This pattern moved constantly along the surfaces, and this orderly movement was first called self-organization in the theory of dissipative structures. The occurrence of self-organization reveals the limitations of the external environment in predicting and controlling reaction kinetics.10
Quantitative Theoretical Analysis of Self-Organization in the Microarc System
Microarc algorithm
In the microarc algorithm, an oxide film can be considered a series of parallel-connected cylindrical resistance channels (e.g., microdistricts; Figure 5b). The size of each microdistrict can be considered to be infinitesimal, and its shape can be considered to be of any geometrical shape such as the cylindrical shape shown in Figure 5a. The initial scale of microdistricts, or the area scale of the oxide film, is N × N. Here, we set N = 128 to reduce the computational complexity; hence, the matrix pattern outputted from the microdischarges was square shaped. Randomly selecting N through cellular automata does not affect the kinetics laws. A higher N indicates a higher matrix scale as well as a higher self-similar pattern structure or pattern fractal dimension.19 We used N = 128 because this study was aimed at revealing the mechanism and dynamics laws of pattern formation induced by microdischarges. The position of a microdistrict is marked as (x,y), and the resistance of a defective district is distributed randomly and discretely in the oxide film; therefore, N × N microdistricts can be initially assumed as a series of resistance Ri (i = 1, 2, ...). The value of Ri is assigned randomly. For example, the random distribution of Ri is expressed by the sample space symbol Ω, and Ω = {P(R1 = 2) = 25%, P(R2 = 3) = 25%, P(R3 = 4) = 25%, P(R4 = 5) = 25%}, indicates that the microdistrict resistance is assigned 4 values, namely 2, 3, 4 and 5 Ω, with each value accounting for 25% of the total number of microdistricts (128 × 128). These resistance values were randomly positioned automatically. In the cellular automata, this positioning may be random; alternatively, 128 × 128 resistances were selected, and each type of resistance accounted for 1% of the total number of microdistricts and was assigned a position in the 128 × 128 microdistrict matrix. The assignment of various initial resistances was equivalent according to the laws of dynamics. The dynamics laws of the cellular automata depend on only the updating rule of the cell matrix.19
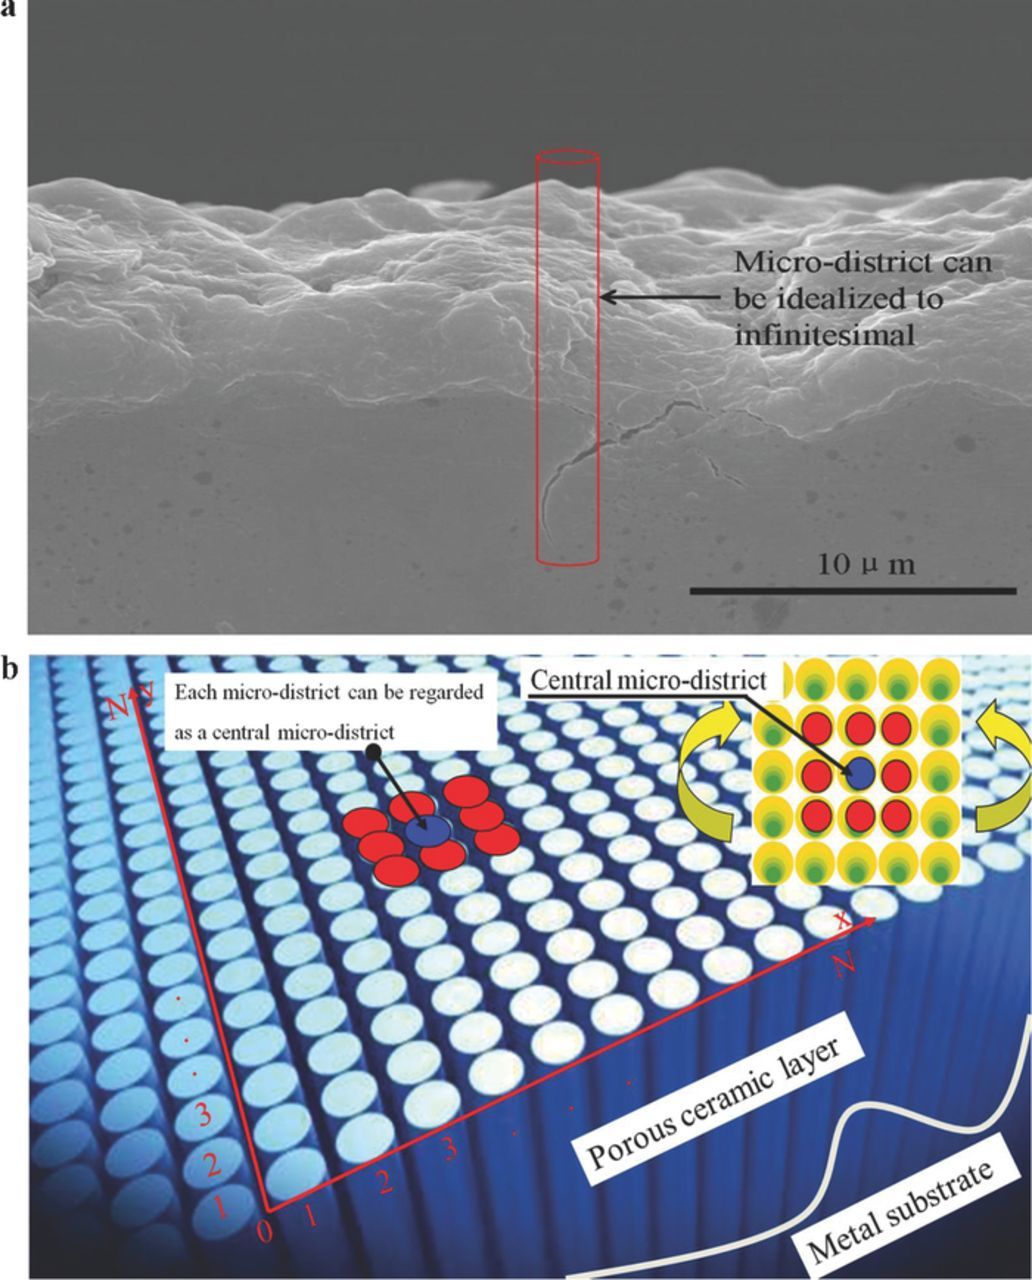
Figure 5. Microarc algorithm model. (a) Sectional view of the oxide film, and an ideal microdistrict in the oxide film. (b) Microarc algorithm model in microarc oxidation.
Updating rule of the microarc algorithm
The resistance distribution state of the oxide film was updated after each discharge. The discharging microdistrict must be a defective district with relatively low resistance.  is the average of the resistances of a central microdistrict R(x,y) and eight adjacent microdistricts.19,20 Although the discharge of one microdistrict exerts a feedback effect on the discharges of other microdistricts, as reported, the effect of one microdistrict on eight adjacent microdistricts is equal to its effect on all microdistricts.19–21 In Figure 5b, the blue microdistrict is the central one and is surrounded by eight red microdistricts. An oxide film comprises numerous microdistricts, and each microdistrict can be considered a central microdistrict surrounded by eight adjacent ones.
The difference in the degree of resistance between the microdistrict at (x,y) and eight adjacent microdistricts was defined as  . According to Ohm's law,22 if the difference is low, or even if
  , the central microdistrict is nondefective and its current is sufficiently weak to cause a discharge. Specifically, if α(x,y) <η (η is the threshold and η > 0), the microdistrict does not discharge; if α(x,y) ≥ η, it is a defective district that can discharge, just like the oxidation film containing impure crystal boundaries or microcracks. The power-supplied current density can be determined from η, and this is because a higher η indicates a lower current density (and vice versa). If the central microdistrict (x,y) can discharge at the nth time, its resistance change after discharge is ΔRn(x,y).
Figure 6 illustrates a qualitative description of the occurrence of ΔRn(x,y). The central blue microdistrict in Figure 6a is surrounded by eight adjacent red microdistricts, and it contains more microcracks or impure crystal boundaries compared with the red microdistricts (Figure 6b). Therefore, this central microdistrict has a relatively low resistance and accumulates more current to undergo a discharge. The current passing through this central microdistrict induces a discharge, but it did not pass through any site in this microdistrict. Because valve metallic oxides are insulative, nearly all the current is accumulated in the microcracks of the central microdistrict (Figure 6b). The current causes the filament current in the microcracks to break down (red channel in Figure 6c),18 and this breakdown process induces electrolyte pyrolysis as well as gas overflow and partial ionization in the microcracks because of the extremely high heat effect corresponding to this process. Specifically, the microcracks constitute a small-scale high-temperature, high-pressure field, which melts the microcracks. However, not all the microcracks in Figure 6b are necessarily melted, and this is because the amount of oxides melted in the microcracks is determined according to the integral from the temperature T of the high-temperature, high-pressure field and pulse width Don. The black broken lines in Figure 6c indicate the amount of melted microcracks. Not all the melted microcracks are crystallized, because the crystallized amount is controlled by the integral from the electrolyte temperature T0 and pulse width interval Doff. The yellow broken lines in Figure 6c indicate the total amount of crystallized microcracks. Compared with valve metallic oxide crystals, microcracks can be considered good conductors; therefore, ΔRn(x,y) can be determined according to the final amount of crystallized microcracks (yellow stripes in Figure 6c) and the conductivity of the crystallized product. Subsequently, ΔRn(x,y) can be estimated through a quantitative analysis.
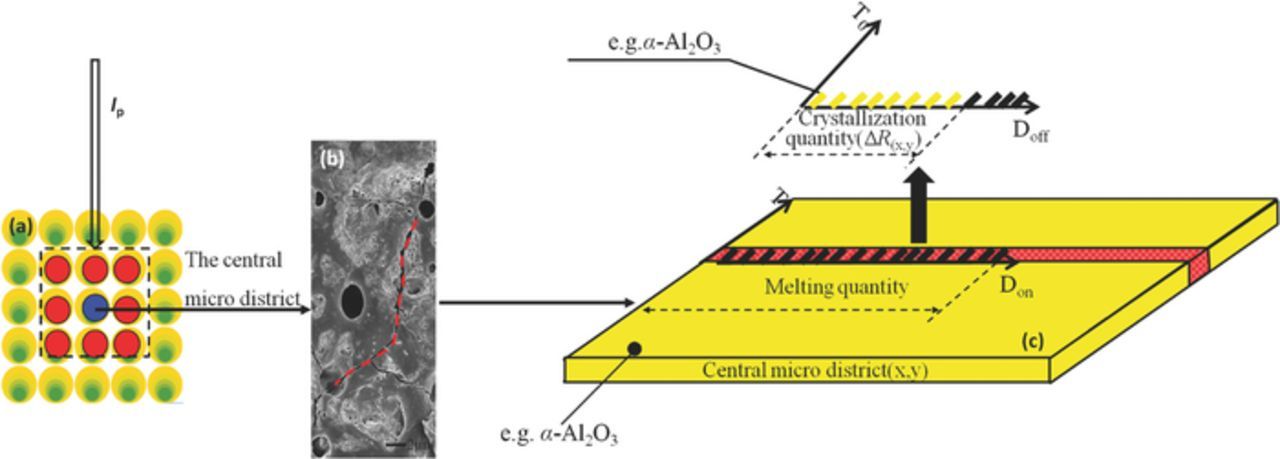
Figure 6. Schematic of the computation of the postdischarge ΔR(x,y) in a central microdistrict.
To compute ΔRn(x,y) (i.e., the amount of microcrack crystallization in Figure 6b), the current I(x,y) acquired by the central microdistrict (microcrack) must be calculated first (Figure 6a). In the cellular automata, the central microdistrict (x,y) and its eight adjacent microdistricts can be considered a subsystem (dashed frame in Figure 6a).19 The total current intensity Ip supplied to all microdistricts is equivalent to the current intensity supplied to each subsystem. Because each central microdistrict is parallel-connected with its eight adjacent microdistricts, the actual current I(x,y) can be determined according to Ip and αn(x,y). A higher αn(x,y) value indicates that the central microdistrict has a lower resistance than those of the adjacent microdistricts; therefore, this microdistrict acquires more current. Moreover, a higher Ip value indicates that the central microdistrict acquires more current.
We can use I(x,y) to calculate the gas and/or microdischarge temperature T of the central microdistrict. Establishing the quantitative relationship I(x,y) - T is extremely difficult, the I(x,y)-induced microdischarge undergoes two physical processes successively: anodic solid filament breakdown and bubble breakdown.18 Almost all the current I(x,y) passes through the microcracks and causes a solid electric breakdown of the filament current (red path in Figure 6c).18 Because of its extremely high heat effect, the filament current thermally emits conduction-band electrons from the microcracks. The thermally emitted electrons acquire sufficient kinetic energy/temperature Te through electric field acceleration during their parabolic motion on the oxidation film surfaces. When colliding with gas molecules, the electrons transfer a part of Te to the ions that were ionized after the collision, increasing the kinetic energy/temperature Ti of the ions. Because the ion has higher mass than electron, Ti can be used to determine the temporary heat effect T during the microdischarge. A higher I(x,y) indicates greater concentrations of thermally emitted electrons and local gas molecules, which results in a higher frequency of collision between thermionics and gas molecules/ions and the transfer of more kinetic energy/temperature from electrons to ions.
Next, the amount of microdischarge-induced heat is also affected by the working time in a single pulse. Moreover, the amount of melted microcracks in a pulse is determined by Don. Finally, the amount of solidified oxides engendered by cooling crystallization during Doff can be computed. Therefore, Don and Doff can be used to compute the total amount of microcrack crystallization after the discharge (yellow stripes in Figure 6c), which resistance can be determined by the corresponding crystal conductivity σ.
The relationship between ΔRn(x,y) and αn(x,y) can be expressed as follows:
![Equation ([1])](https://content.cld.iop.org/journals/1945-7111/163/5/C184/revision1/d0001.gif)
Resolving Eq. 1 is difficult or even impractical. According to the first-order approximation of Taylor's formula of multivariate functions,23 here, Ip, Don, Doff, and σ are constants. Notably, in addition to α-Al2O3, the microcracks generate γ-Al2O3, amorphous Al2O3, or complexes after a single microdischarge, and the crystallization even introduces new microcracks and impure grains. Moreover, σ is estimated from the weighted electroconductivity of these components, and it varies as the contents of these components change. However, no new types of material appear after microcrack crystallization, provided that the base-metal-doped components and electrolytic solution are unchanged. Therefore, σ is considered to be nearly constant.
Eq. 1 can be rewritten as follows:
![Equation ([2])](https://content.cld.iop.org/journals/1945-7111/163/5/C184/revision1/d0002.gif)
In Eq. 2, g(Ip, Don, Doff, σ) can be replaced with k, which is ΔRn(x,y)/αn(x,y). k is defined as the increase in ΔR per α, where α indicates the difference in the degree of resistance between the central microdistrict and the surrounding microdistricts. k measures the feedback effect of the microdistrict discharge on the next-time current distribution.
When α(x,y) is unchanged, a higher resistance increment ΔR(x,y) after one discharge indicates a higher k. Three external physical factors affect ΔR(x,y): product conductivity (σ), current density (Ip), and discharging time (Don, Doff). Specifically, although α exerts a higher effect on the current in the central microdistrict, Ip can still modestly affect its intensity and microdischarge temperature. With a higher Ip, the increase in the current in the central microdistrict results in an increase in the microdischarge temperature. Therefore, the heat absorption per unit time, amount of melted oxides per unit time, and final ΔR(x,y) per unit time in the microcracks increase. Because σ is a self-attribute factor, the value of σ after a microdischarge in the central microdistrict is jointly determined by the substrate metals (e.g., metals that are not valve metals), plasma type, electrolytic solution (e.g., a solution that dissolves oxidation products), and other factors. Don and Doff are time-dependent factors. Adjusting the microdischarge time through the pulse power can precisely change the melted amount and solidified amount from microcracks, thereby changing ΔR(x,y). Obviously, when a single pulse engenders a shorter microdischarge lifetime, the melted amount and consequently ΔR(x,y) decrease. When Doff is narrower, the microcrack-melted solidified amount and then ΔR(x,y) decrease considerably.
In conclusion, k is monotonically related to Ip, Don, Doff, and σ: when Ip, Don, and Doff decrease, an increase in σ results in a decline in k (and vice versa).
Results and Discussion
The difference in the degree of resistance E(α) among the microdistricts is a statistical arithmetic average of α(x,y) among all central microdistricts. E(α) reflects the degree of disequilibrium of a resistance distribution in an oxide film, and it indicates the degree of disequilibrium of the current distribution. The value of E(α) was updated after each discharge according to the microarc algorithm. E(α) and k were computed from a continuous positive sequence of a microdistrict resistance matrix by using a computer. First, a matrix of the initial resistance distribution in a microdistrict was established. Because the defects in the oxide film were random at an initial discharge, each microdistrict was randomly assigned with a resistance value. The E0(α) value at the 0th discharge was then computed. Subsequently, at the first discharge, the microarc algorithm was used to determine which microdistrict was defective for the discharge, and the resistance increment from this defective district after the first discharge was then computed: ΔR(x,y) = k·α(x,y). Next, the resistances in all microdistricts were computed after the first discharge, after which E1(α) was computed. Through this approach, the En(α) curve could be deduced after continuous updating. Different k values were used to plot the E(α)-n curve on the computer. Resolving the analytical expressions of E(α) and k is difficult because only the identified defective microdistrict can discharge and update the resistance. So far, no traditional mathematical method can enable fully differentiating or analyzing self-organization systems.19
Current distribution in the electrode tends to reach the uniform state at k < 3.3
E(α) reflects the degree of nonequilibrium of the resistance distribution in an oxide film, and it is used to measure the degree of nonequilibrium of the current distribution. When k is < 3.3, the E(α)-n curve is approximately bell-shaped (Figure 7a). The E(α) value changed in a nonlinear power-law manner by rapidly increasing and dropping as the number of discharges n increased. When the difference in resistance in each microdistrict reached equilibrium, the current was dispersed quickly with the attenuation of E(α). A lower k indicates that a uniform current distribution is achieved faster (Figure 7a).
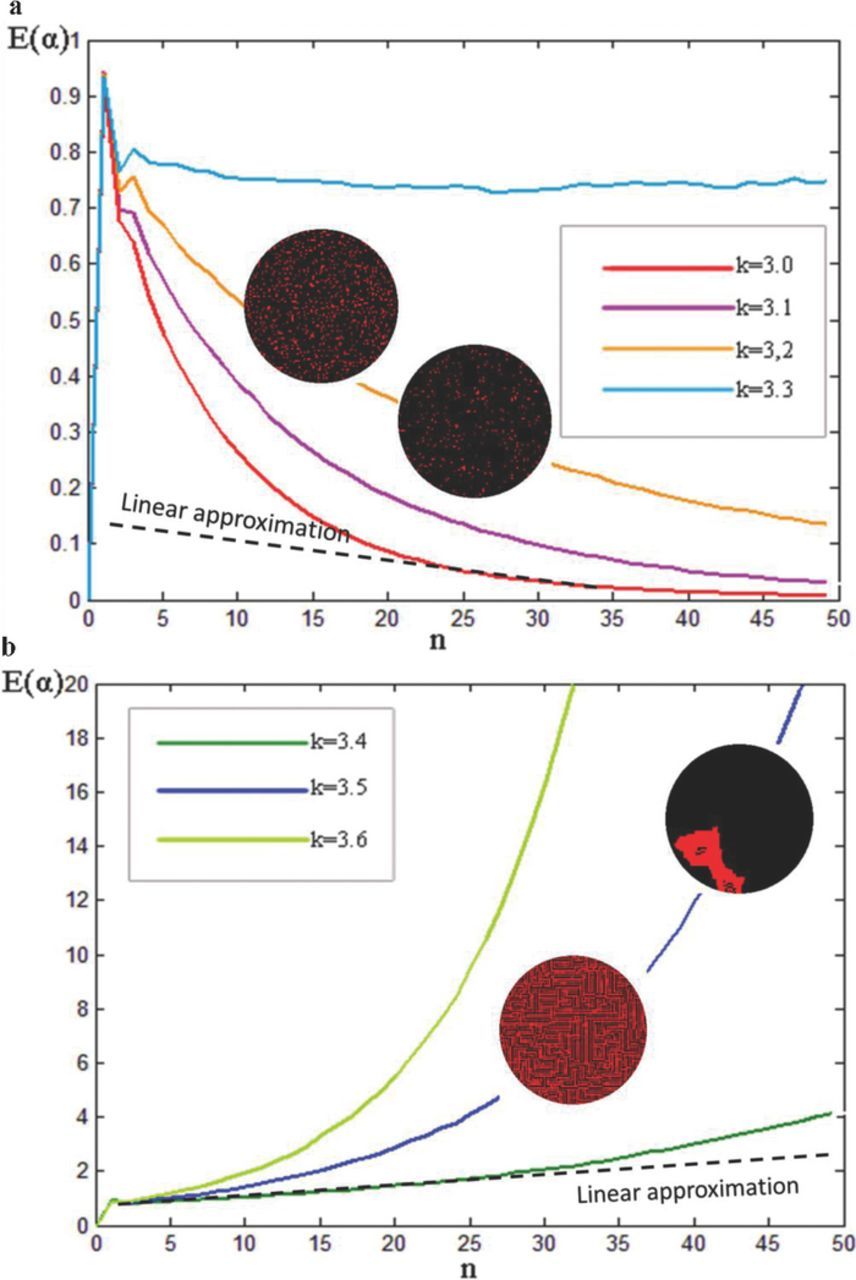
Figure 7. Dynamic curves of E(α) vs time a various k values (computational results). Ω = {P(R1 = 2) = 25%, P(R2 = 3) = 25%, P(R3 = 4) = 25%, P(R4 = 5) = 25%}, η = 0.001, and unit cell scale = N × N (N = 128). (a) k ≤ 3.3, (b) k > 3.3.
A uniform spatial-temporal distribution and energy of the microdischarges were achieved because the current was dispersed and tended to reach a uniform distribution (Figure 3a and Figure 7a). The images on the curve in Figure 7a depict the computed microdischarge matrix patterns, and the red dots in these images represent the discharge points, whereas the black dots represent nondischarge points. Clearly, the microdischarge group gradually disappeared because the current was limited in each microdistrict. In this instance, the ceramic layer could hardly grow. However, when an area on the sample surface exhibited a smaller ROC, such as the notched area in the central part of the sample in Figure 3b, this area demonstrated a higher EFI compared with other flat areas. The plasma was fixed to the notched areas and hardly evolved with time. Because of the change in resistance after the discharge, even the microdistricts in the notched area exerted a feedback effect on the current distributions in all microdistricts. Nevertheless, the resistances in the microdistricts in both the notched and flat areas tended to reach an equilibrium state (Figure 7a). When the resistance distribution of the microdistrict became uniform with time, the external electrical field distribution became the only factor determining the current intensity in each microdistrict. The microdischarge was spatially distributed at a smaller scale compared with the arc discharge, and it also had a higher heat effect than did the glow discharge. In particular, we could fully adjust and predict the spatial-temporal distribution of the microdischarges by referring to the surface electrical distributions in different geometric areas. At k < 3.3, the plasma could be used to achieve a millimeter/micrometer-scale machining of electrode materials or to implement other potential millimeter/micrometer-scale high-temperature plasma technology (Figures 3b and 3c). We will discuss this issue in detail in Equilibrium state and the use of the MAO technique section.
Current distribution in the electrode deviates from the equilibrium state at k > 3.3
At k > 3.3, E(α) increased with time according to a power-law function (Figure 7b). The current distribution in the anode reached a nonequilibrium state as the discharge time increased, or specifically, the current tended to diverge from the equilibrium state. When the k value increased, the MAO system diverged faster from the equilibrium state (Figure 7b). The increase in the difference in the resistance distribution in the oxide film enabled the defective districts to acquire more current, enhancing the microdischarge energy (ordered energy of microdischarges), microdischarge size, and between-spot link (ordered structure of the microdischarges in Figure 7b). The images on the curve in Figure 7b depict the computed microdischarge matrix patterns, and the red dots represent the discharge points, whereas the black dots represent nondischarge points.
Current distribution in the electrode deviates from the equilibrium state and microdischarge temperature
In MAO, the plasma heating effect is the main heat transfer mechanism, which occurs through the collision between ions (e.g., O2−)/gas molecules (e.g., O2) and oxide grains. Therefore, plasma containing higher-temperature ions or gas molecules exhibits a high capability of transferring heat to oxide grains. In thermodynamics, plasma is divided into three categories.24 (1) Plasma under complete thermodynamic equilibrium (also known as high-temperature plasma): In such plasma, the electron temperature (Te)/ion temperature (Ti) and gas molecule temperature (Tg) are fully consistent; specifically, Te = Ti = Tg (>10000 K). Such plasma possesses extremely high thermal effects, with an example being solar plasma. (2) Plasma under local thermodynamic equilibrium: Because of the presence of boundary effects, (Te)/(Ti) and (Tg) are seldom consistent at any position; therefore, Te ≈ Ti ≈ Tg (3000 – 4000 K). Such plasma also has high thermal effect, such as arc discharge. (3) Plasma under thermodynamic nonequilibrium: The nonequilibrium thermodynamic properties of such plasma are attributed to the high electron temperature (>10000 K) and approximately normal levels of internal Ti and Tg. This type of plasma exhibits extremely low heat effects, such as a semiconductor corroded by glow discharge.25
At k > 3.3, the current in a defective district was enhanced as E(α) increased (Figure 7b), generating considerable Joule heating and vaporizing numerous electrolytes. Numerous gas molecules aggregated on the surface defects because gas bubbles were not sufficiently large to escape from the electrolyte. Finally, an air layer with high molecule concentration (ng) was formed under high pressure. The impact frequency γ between plasma electrons and gas molecules is γ = ng·σg·ve, where σg is the collision cross-sectional area of gas molecules, determined according to the gas type, and ve is the movement rate of electrons relative to the gas molecules,25,26 determined according to the local electric field strength on surfaces. In the MAO system, the type of gas generated at the anode did not change with time; therefore, σg was constant. When the current distribution considerably diverged from the equilibrium state as E(α) increased (Fig. 7b), γ increased with the enhancement of the current and ng at the defective microdistrict. Therefore, a considerably higher amount of kinetic energy was transferred from the electrons to positive ions and neutral gas molecules in the plasma, resulting in Te decreasing but Ti and Tg increasing. Eventually, Te, Ti, and Tg tended to be equal, forming a local thermodynamic equilibrium and high-temperature plasma. These results are consistent with the observation from Matykina et al. regarding the variation of electron temperature with time.27 In MAO, the heat for phase transitions is mainly provided by the collision between molecules/ions in a plasma and the oxide on a substrate. Therefore, the microdischarge temperature T can be defined according to Tg/Ti in plasma, such as the temperature T of O2/O2−. Because of the photon radiation derived from the combination of electrons and ions in the plasma, Te decreased as the collision frequency increased, and the proportion of photons consequently decreased. With time, the microdischarge converted from white at high frequency to red at low frequency (Figures 1a–1d). In the microarc system, the increase in E(α) enhanced the current intensity in the defective district. At the initial stage of MAO, the competition for the current among different microdistricts was not severe. The glow discharge of cold plasma was formed in a halo state on the sample surface from the beginning of plasma formation. At this moment, Te was considerably higher than Ti and Tg, but no microarc was formed yet. As the current distribution diverged from the equilibrium state, the plasma was transferred rapidly from the glow discharge to the arc discharge in the physical defective district (Figure 1b). Subsequently, when E(α) increased considerably, the current intensity at the defective district was strengthened according to the power law (Figure 7b). Numerous large arcs appeared in the microarcs, indicating that the plasma entered the arc stage (Figure 1c). Finally, the current was monopolized at certain defective districts, and a streamer spark discharge was randomly formed on the film surfaces (Figure 1d).
Current distribution in the electrode deviates from the equilibrium state and ceramic layer growth
As the current distribution diverged from the equilibrium state, the ceramic layer first grew in the deposition layer on the surfaces of the substrate metal. At this moment, the degree of disequilibrium of the current distribution in the film layer was extremely low. Therefore, despite the low temperature on each gas and/or microdischarge stage (glow discharge stage), the melted oxide grains were not rapidly scattered by the gas and/or plasma shock wave. After the melted oxides were solidified, the high bonding force and compactness between the grains were still maintained. The gas and/or microdischarge did not engender a large-scale formation of micropores. This process is attributable to the growth of the initial transition layer of the ceramic layer.
When the processing time increased, the current distribution in the oxide film was disequilibrated further (Figure 7b). In particular, as the discharge number increased, the current intensities in certain microdistricts were enhanced because of the continuous self-feedback. At this moment, both the temperature and pressure of the current-induced gas and/or microdischarge in the microdistricts increased slightly (the microarc discharge stage), reducing the interparticle binding force and compactness in the compacted layer during oxide solidification compared with those in the transition layer; the micropore size and between-size difference also increased. Moreover, at a high temperature, the number of thermally stable crystal-phase structures began to increase (e.g., α-Al2O3), whereas the microarc discharge generated in microdistricts with strong current induced the growth of the compacted layers. Currently, certain microdistricts in the film layer exhibited strong currents, whereas the remaining microdistricts demonstrated weak currents; hence, the gas and/or discharge from the microdistricts with weak currents did not generate high temperature or pressure. Therefore, the weak currents in these microdistricts continued to enhance the growth of the transition layer, or even the weaker currents were dissipated as Joule heat to the electrolytic solution, increasing the power consumption.
At a later processing stage, the current distribution in the film layer was highly unbalanced (Figure 7b). In particular, in a small part of microdistricts, the current was largely accumulated to form high-temperature, high-pressure gas and/or microdischarges. The gas and/or plasma shock wave rapidly dispersed the molten oxides, and therefore, the ceramic grains formed during oxide solidification were also discretely sputtered out of the micropores, or even directly scattered to the electrolytic solution. The arc discharge generated by these strong currents is responsible for the growth of loose layers at the late stage. Hence, a higher number of microdistricts could produce only a soft or even zero discharge because of extremely weak currents. These weak currents were still responsible for the growth of the compacted layers and the transition layer, and a larger amount of microdistrict currents was dissipated as Joule heat to the electrolytic solution. The energy consumption was abruptly increased at the later stage.
As the current distribution diverged from the equilibrium state, the ceramic layer on the base metal grew, from inside to outside, a transition layer, compacted layers, and a loose layer.
Regulation of micropore structure and ceramic layer growth
With the growth of the ceramic layer, the anode current in the oxidation film diverged from the equilibrium state. The k coefficient controls the direction and speed of divergence from an equilibrium state, and it is determined by Ip, Don, Doff, and σ, which essentially affect the growth of a ceramic layer and the kinetic laws of microporous structural evolution by changing k. According to the monotonicity of k with Ip, Don, Doff, and σ and the derivation of k, reducing Ip, Don, or Doff or increasing σ results in a reduction in k. In particular, Don and Doff can be used to precisely and quantitatively control k.
One of the methods of regulating micropore structure and ceramic layer growth is to control the speed of divergence from the equilibrium state in an oxide film. Another method is to control the processing time. When k > 3.3, a lower k value indicated that (1) the speed of divergence from an equilibrium state was lower; (2) the gas and/or microdischarge temperature and pressure in addition to the size and difference in ceramic-layer micropores did not increase too rapidly; and (3) the ceramic layer within the same processing time became more compacted. However, under constant external conditions, these parameters finally increased with time and became irreversible; this is because the number of discharges required to stabilize E(α) was limited, and the randomness of the initial resistance distribution destroyed the steady-state of E(α) (See Characteristic critical point of the microarc system at k = 3.3 section). A higher k value resulted in a faster divergence of the current distribution from the equilibrium state, thus increasing the growth rate of the ceramic layer. Within the same period, the compactness of the ceramic layer and the bonding force of oxide grains decreased.
Characteristic critical point of the microarc system at k = 3.3
We determined that a k value of 3.3 was critical, and at this value, E(α) stabilized and fluctuated within a short period (Figure 7a). However, E(α) was in a stable state only within approximately 100 discharges. When k was closer to 3.292, E(α) was in a stable state for a longer period, but only within 1000–1600 discharges (Figure 8a). The discharge number corresponding to the steady-state E(α) was determined according to two factors. (1) Figure 8a shows two E(α)-n curves (blue and red) at k = 3.292; however, this figure shows that the E(α) curve and destabilization time are not fully overlapped, signifying that the number of discharges required to maintain a steady state is correlated with the randomness of the initial resistance distribution. (2) The destabilization speed at k = 3.291 or 3.293 was also faster than that at k = 3.292, indicating that the number of discharges required to maintain a steady state is also associated with k. This result indicates that the microarc system demonstrates both randomness and regularity. The instability of E(α) is unavoidable due to the randomness of the initial resistance distribution. We made this conclusion in reference to Boltzmann's explanation of the second law of thermodynamics.28 However, this problem has yet to be completely resolved.29 Destabilization reveals that under constant external conditions, MAO always approximates an irreversible direction with time. Because of the destabilization of E(α), the microdischarge group broke down, and numerous microdistricts were not discharged, despite the current flow. Nevertheless, the currents in these microdistricts were dissipated as Joule heat into the electrolytic solution. The utilization rate of the power supply always decreased, and under the condition of limited power, even the processing time was unlimited, but the thickness of the ceramic layer was limited.
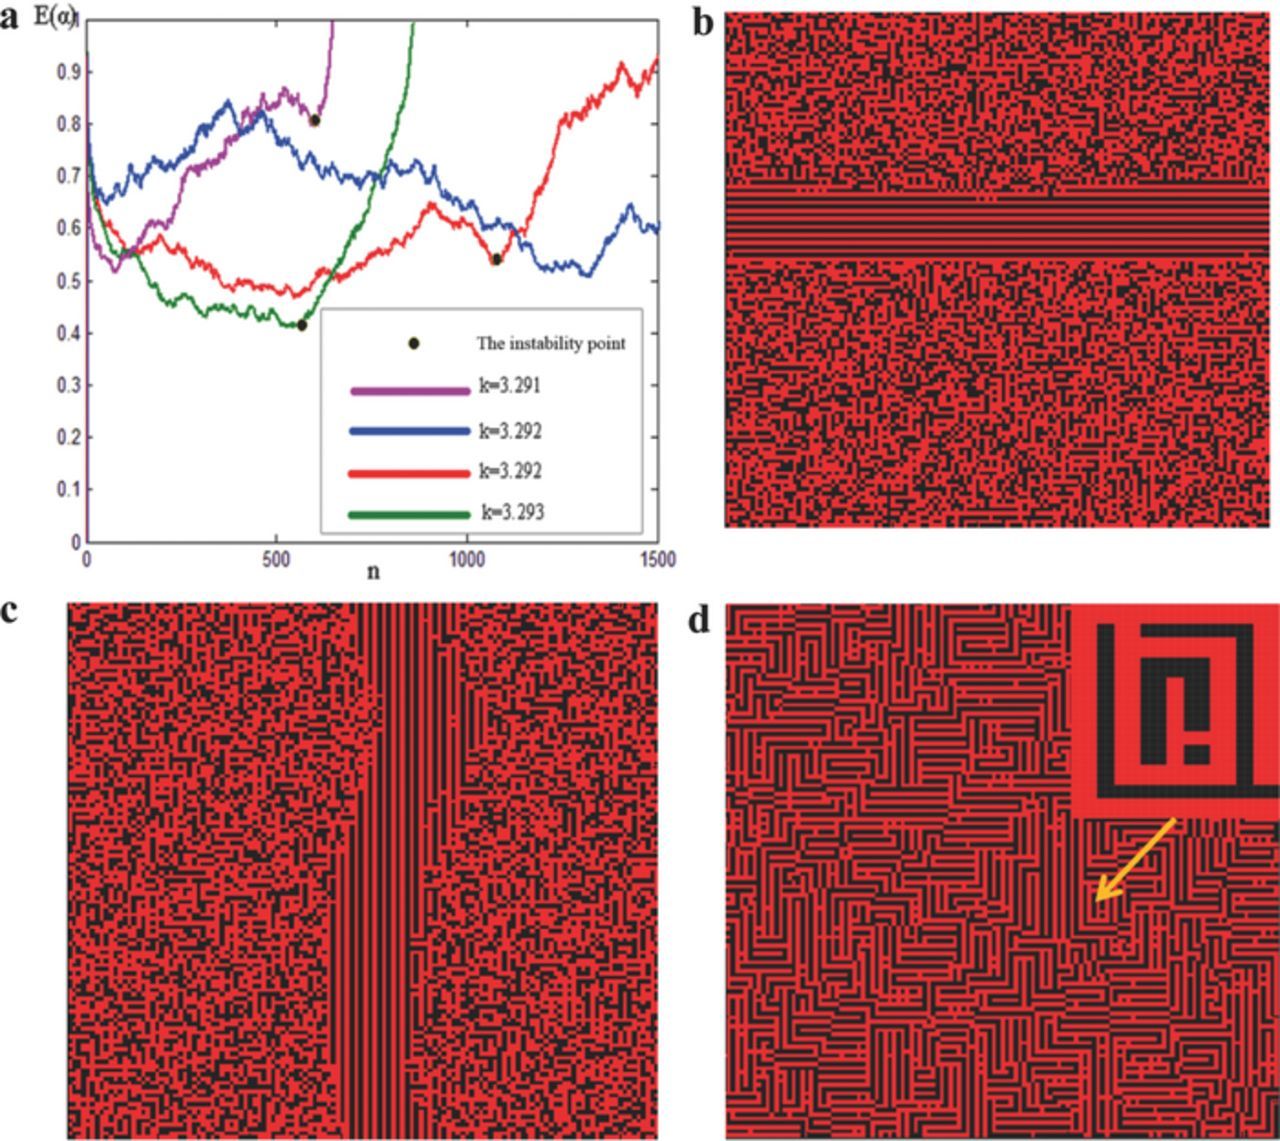
Figure 8. Conditions of k in a stable state and the orderliness of arc spots after loss of stability (computational results). Ω = {P(R1 = 2) = 25%, P(R2 = 3) = 25%, P(R3 = 4) = 25%, P(R4 = 5) = 25%}, η = 0.001, the unit cell scale is N × N (N = 128). The red dots represent the discharge points, whereas the black dots are the nondischarge points. (a) k corresponding to the steady condition of E(α); (b) and (c) orderliness of the arc spots after E(α) lost stability; (d) Arc spot group formed a more complex self-similar structure with the increase of E(α).
When the number of discharges n exceeded the instability point, the microdischarge group generated an orderly construction (Figures 8b, 8c). With the fluctuation development, the microdischarges formed a much more self-similar orderly construction (Figure 8d). Figures 8b–8d illustrate the computed microdischarge matrix patterns, and the red dots represent the discharge points, whereas the black dots represent nondischarge points. Clearly, the root cause of the orderly structure formed by the microdischarge group is the deviation from the equilibrium-state current distribution. The highly self-similar orderly construction is attributed to the macroscale behavior of the microdischarge groups. Because each gas and/or microdischarge was distributed in an extremely large space (at a micro/nanoscale), which is not small compared with the entire surface of the oxide film, the macroscale complex orderliness (e.g., stripe patterns) did not affect the micropore distribution in the ceramic layer.
Micropores are a product of gas and/or microdischarge, but if microdistrict products are formed in an extremely small space (at a nanoscale), such as particle deposition, the local topography of the film may become an orderly pattern. To study the anodic electrodeposition at an early MAO stage, we determined that the deposition layer exhibited a stripe pattern as the processing time was prolonged (Figure 9). Because anodic deposition and MAO may share a specific current self-feedback mechanism to a certain extent, the current converged on a defective district produced more Joule heat. Joule heating induced the formation of metallic oxides or complexes through a thermochemical effect, and because of the insulation of valve metal oxides and complexes, the next-time current also preferred other defective microdistricts demonstrating relatively low resistance. The oxide deposits also became an orderly structure as the microdistrict current distribution deviated from the equilibrium state. Moreover, when the processing time was prolonged and the current distribution was forced to deviate from the equilibrium state, the oxide grains were arranged in an increasingly obvious orderly structure (Figures 9b–9d). The scale of sedimentary oxide grains was spatially smaller than the microdischarge space scale; therefore, the grain scale and fineness in the deposition layer were higher than the gas and/or microdischarge space scale, and the large-scale or macroscopical orderliness may affect the small-scale or microcosmic orderliness. With the growth of the deposition layer, the microdischarge groups were induced to a certain extent under the nonequilibrium state when the macroscopic resistance and unbalanced degrees of current distributions in the deposition layer reached the threshold. Notably, the stripes illustrated in Figure 9a were caused by the sample preparation and polishing processes. The stripes were arranged irregularly after the grinding process; however, all the stripes in Figures 9b–9d are regular. Moreover, as the processing time was prolonged, more stripes were formed, while the pores formed during gas escape were arranged linearly.
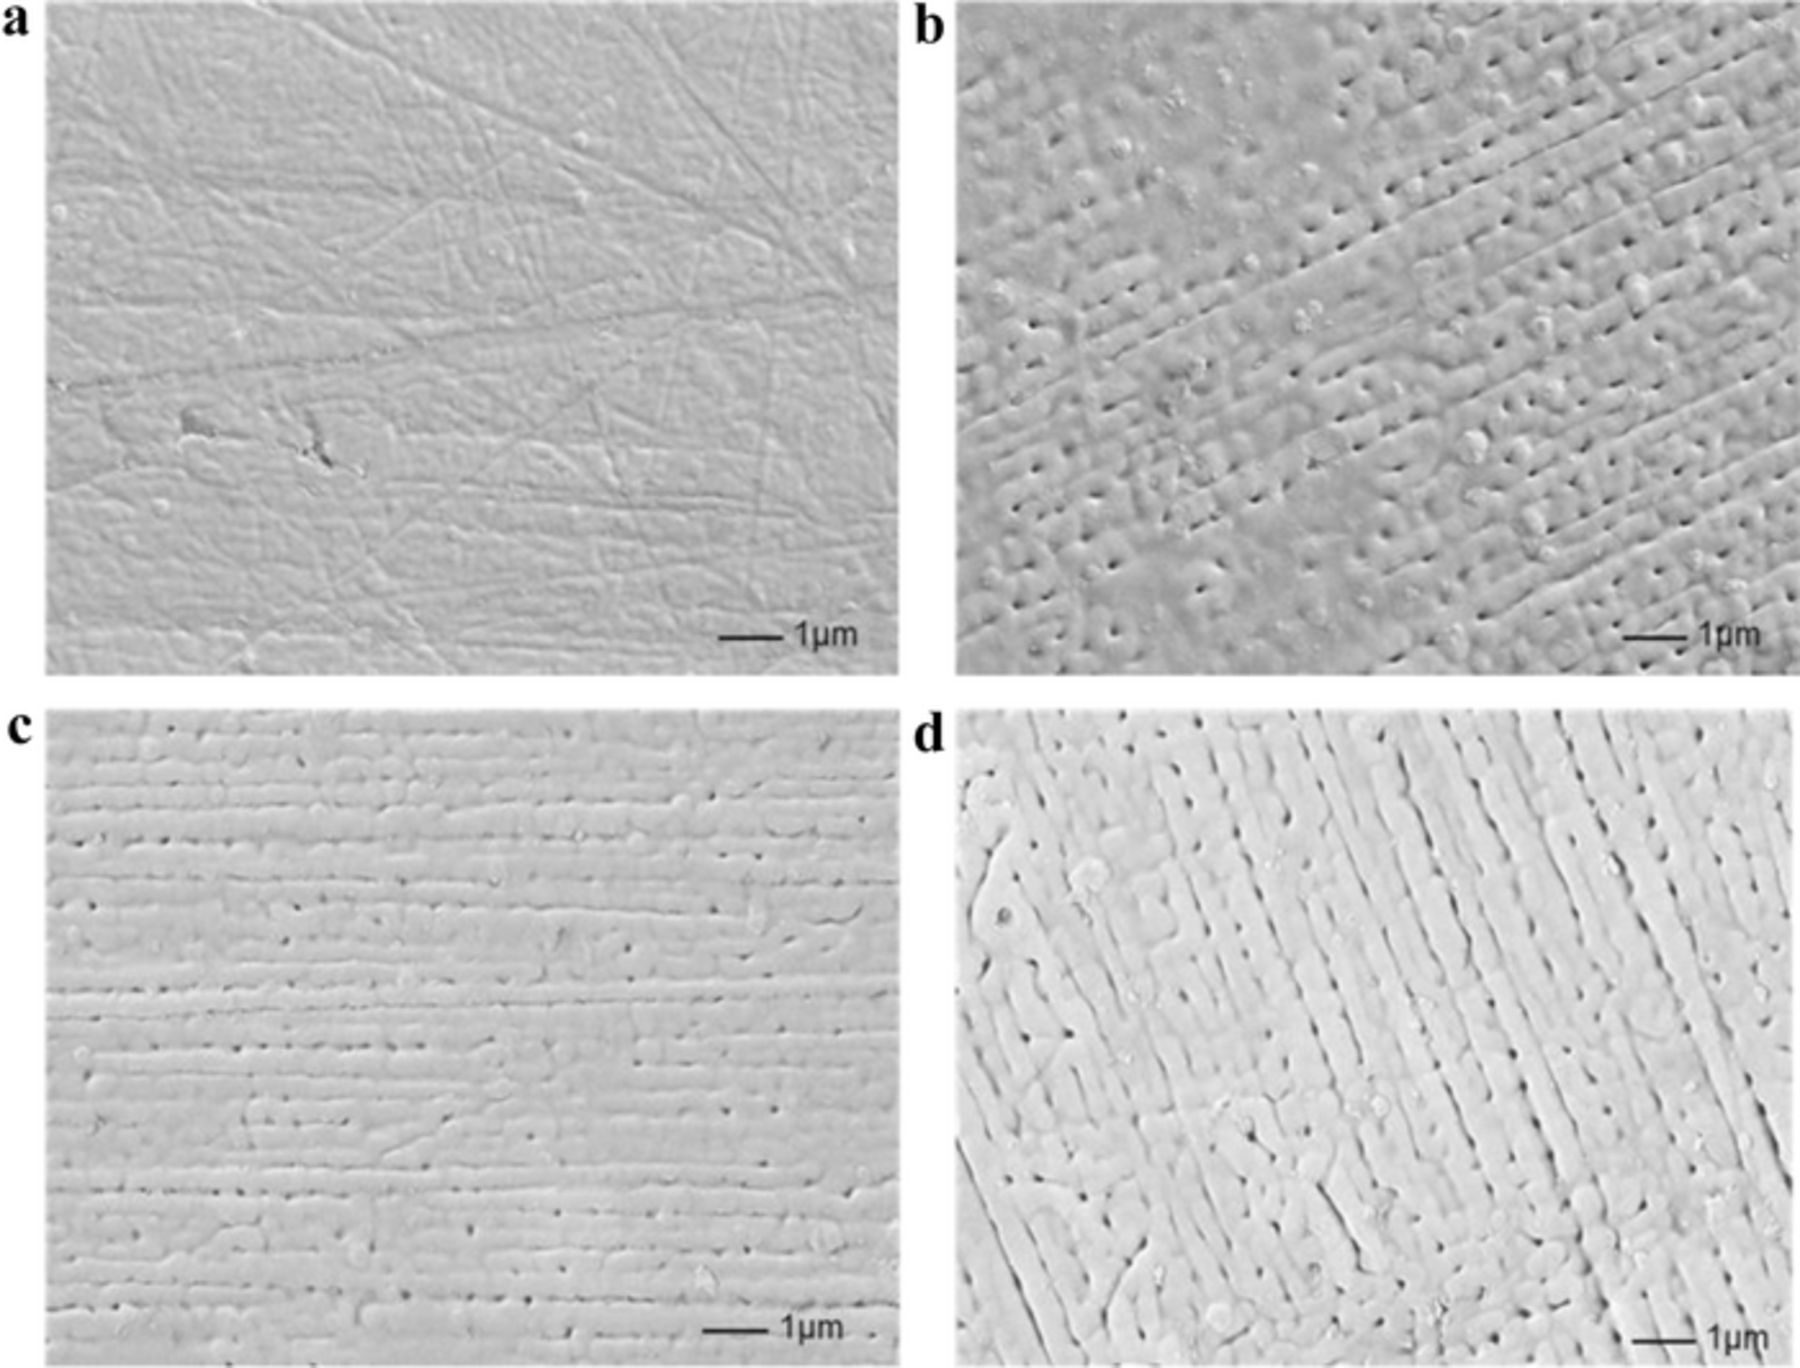
Figure 9. Orderly patterns formed during the sedimentation of oxides and complex grains in the growth of the deposition layer before microarc oxidation. Ip = 20 A, D = 20%, f = 1000 Hz, electrolytic solution: NaOH (0.0725 mol/L), (NaPO3)6 (0.121 mol/L). (a) t = 9 s. (b) t = 18 s. (c) t = 24 s. (d) t = 27 s.
Relationship between the Frequency f and k
The value of k can be controlled by Don and Doff by changing the molten and solidified amounts of the oxide. Because the duty cycle of pulse power is D = Don/(Don + Doff), where Don + Doff is a pulse cycle, then Don = D/f, Doff = (1-D)/f. When D is constant, Don and Doff increase or decrease simultaneously with the change in the frequency f, and then k can be adjusted. When f is high and thus Doff and Don decrease simultaneously, the small amounts of the molten and solidified oxide result in low ΔR and k (Figure 6), and vice versa.
The current distribution determines the space-time distribution and energy at each gas and/or microdischarge, which in turn determines the microporous structure and growth pattern of ceramic layers. An electrolytic solution and its temperature subject a gas and/or microdischarge district to extremely high pressure and temperature gradients. The acting force includes the shock wave produced by the pressure gradient and the thermophoretic force (shrinkage force toward a low temperature) produced by the temperature gradient.30 These two forces promote the formation of micropores in gas and/or microdischarges. When the current distribution in an oxidation film is highly unbalanced, a defective microdistrict acquires a higher current intensity. In this defective microdistrict, the gas and/or microdischarge temperature and pressure, gas and/or microdischarge space scale, and the microporous scale after gas overflow and/or discharge increase. The microporous structure, like a camera film, can indirectly record the time-space distribution and energy of a gas and/or microdischarge. However, this recording is only indirect because the micropores generated during the previous gas and/or discharge are also recorded on the surfaces of the ceramic layer. In this study, we focused on dynamic laws; therefore, the dynamic laws of current and microdischarge space-time distributions can be characterized by those of micropore structures. Figure 10 illustrates the dynamic curves of the micropore density ρ, average area of a single micropore E(S), variance between micropore areas D(S), and porosity K under the same duty cycle D and various frequencies f.
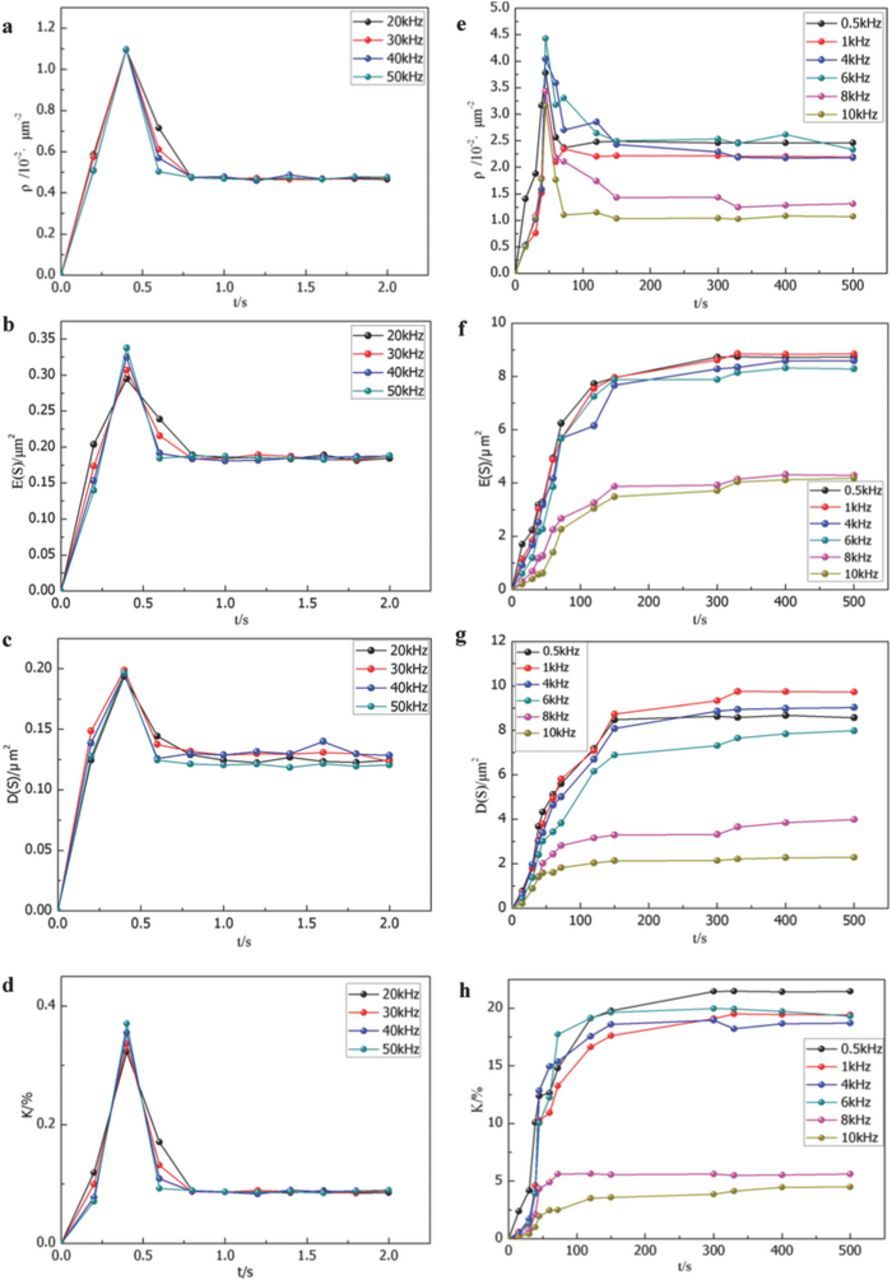
Figure 10. Dynamic curves of the micropore density ρ, average area of a single micropore E(S), variance between the area of the micropore D(S), and porosity K under the same duty cycle D and different frequencies f (D = 20%; peak current: Ip = 20 A). (a–d): 2 0 kHz ≤ f ≤ 50 kHz; (e–h): 500 Hz ≤ f ≤ 10 kHz.
At 20 ≤ f ≤ 50 kHz (Figures 10a–10d), ρ, E(S), D(S), and K were sharply attenuated after their initial surge, and the rates of change of the curves increased with f, indicating that at f > 20 kHz, the current and microdischarge distributions in the anode were uniform (Figure 3a). In addition, f > 20 kHz corresponded to the kinetics law at k < 3.3. Therefore, the k value gradually dropped as the frequency increased. When all microdischarges were extinguished, ρ, E(S), D(S), and K did not change anymore, and streamer sparks arose in the notched area (Figure 3b) or needlepoint area (Figure 3c).
At 500 Hz ≤ f ≤ 10 kHz (Figures 10e–10h), after the surge of ρ, the ρ-t curve dropped slightly and then stabilized, whereas the E(S), D(S), and K curves increased according to power functions. Therefore, at f < 10 kHz, the current distribution in the anode was in a nonequilibrium state and diverted from the equilibrium state, which increased the energy of the gas and/or microdischarge and the energy difference. At k > 3.3 and f < 10 kHz, the numerous micro-districts achieved uniform growth of ceramic layer through continued competition of current. The rates of change of the E(S), D(S), and K curves decreased as f increased. Specifically, a higher f resulted in a denser ceramic layer. E(S), D(s), and K were close to saturation and became stable after the gas and/or microdischarges were dissipated.
The range f = 10–20 kHz is at the theoretical critical point k ≈ 3.3. Within this range, the discrete microdischarge group exhibited a complex behavior. The dispersed and disordered microdischarges united to form a flower-like pattern observed in the microdischarge group (Figure 2a), a cluster of dispersed microdischarges that spun periodically and in an anticlockwise direction on the surface (Figure 2b), or even a line-shaped arc that could move up and down periodically near the notched area (Figure 2c).
Equilibrium State and the Use of the MAO Technique
In general, when the MAO technique is used, the geometrical structure on the sample surface is highly complex, including the mechanical gear and mechanical threads in complex samples, and the unavoidable burrs and mechanical scratches formed during sample processing. In such areas, both the ROC and ACD vary. For example, the ACD at the cathode tip and sample center are lower (Figure 11a), whereas the ROC at man-made notches was lower than that in flat areas (Figure 11c). The areas exhibiting a lower ROC or ACD had a higher EFI/current density, and they thus influenced the distribution and intensity of the gas and/or microdischarges.
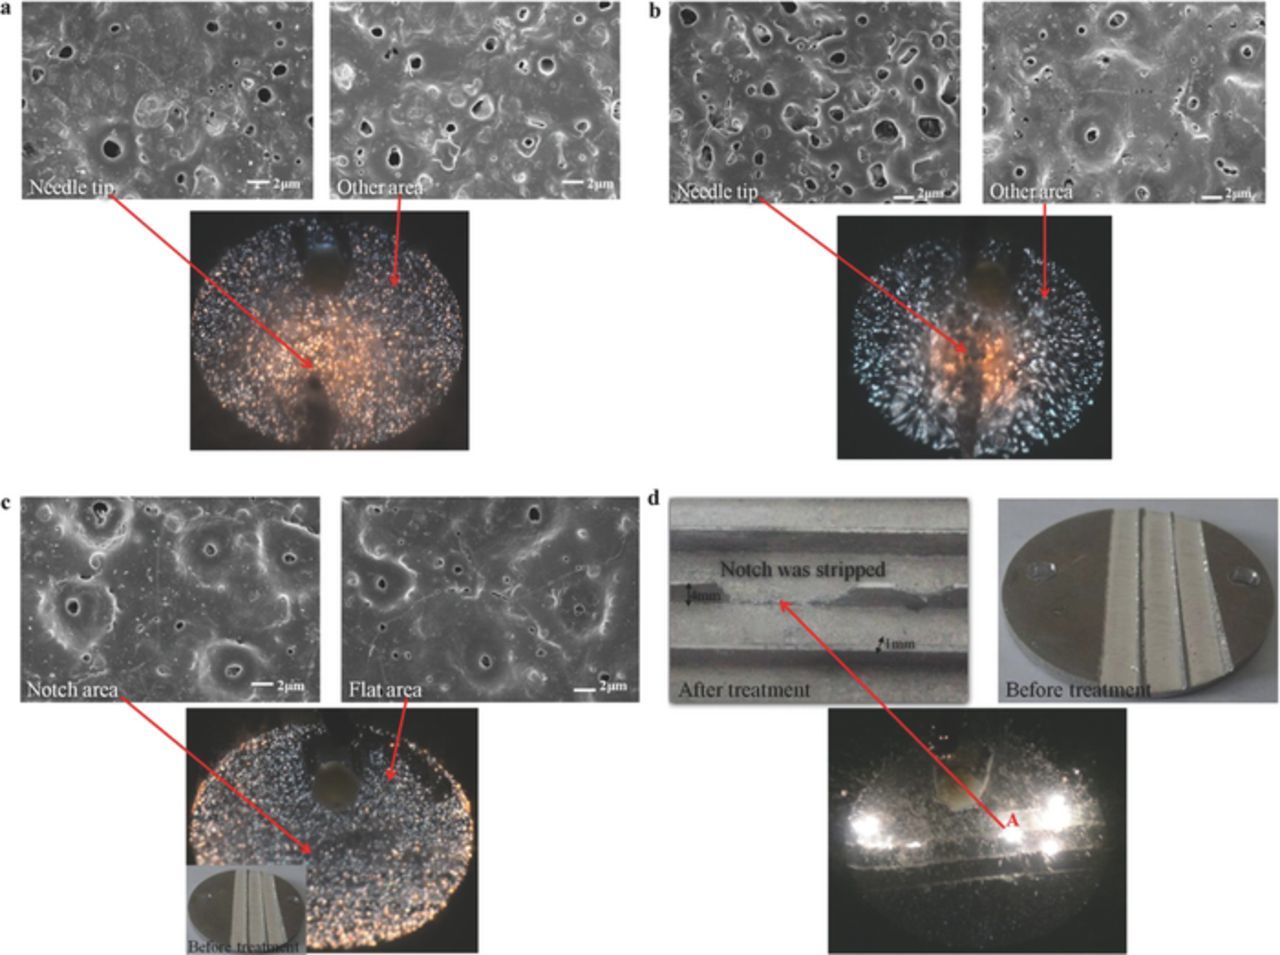
Figure 11. Comparison and application of equilibrium and nonequilibrium states of microarc oxidation. D = 20%, electrolytic solution: NaOH (0.0725 mol/L), (NaPO3)6 (0.121 mol/L). t = 30 s. (a) Flat anode surfaces, needle-shaped cathode, distance from needle tip to sample center = 10 mm, f = 1 kHz. Microdischarge and micropores were both distributed uniformly on the sample surfaces. (b) Flat anode surfaces, needle-shaped cathode, distance from needle tip to sample center = 10 mm, f = 50 kHz. Microdischarge from the areas corresponding to the cathode pinpoint was characterized by higher energy and porosity. (c) Flat cathode surfaces; four notches were created on the anode surfaces by the drilling machine. f = 1 kHz; the microdischarge and micropores were both distributed uniformly on the sample surfaces. (d) f = 50 kHz; the microdischarge occurred only at the notches, and it gradually migrated along the notches, which were exfoliated by the discharge.
When the MAO technique was used (f < 10000 Hz, k > 3.3), the resistance distribution was typically in the nonequilibrium state (Fig. 7b). Microdischarges preferentially occurred in areas with a lower ROC or ACD, which increased the resistance in these areas because the interaction between the microdischarges and materials induced defect crystallization. The resistance in other areas seemed relatively low. Because the difference in resistance between these areas with different geometrical structures increased and because the current always first passed through the lowest-resistance path, the spontaneous current attraction in the lower-resistance areas considerably outweighed the control of current distribution in the areas with a lower ROC/ACD. Because of the spontaneous behavior of the current, the current in other areas underwent a natural convergence, and the microdischarge always searched for the lowest-resistance path and was not affected by the distribution of the external electrical field. Although the geometrical structures on the sample surfaces may have different ROC and ACD, the ceramic layers always grew uniformly because the microdistrict crystallization continuously provided feedback to the current. As shown in Figures 11a, 11c, all the time-space distributions and energy of the microdischarges, micropore distributions, and porosities were approximately the same among areas with different ROC or ACD.
The nonequilibrium state is one of the reasons for the practicality of the MAO technique. However, the nonequilibrium-state MAO technique has limitations. For instance, we could not directly regulate the microdischarge by using the electrical field environment or design the self-defined ceramic layer growth. These problems can be resolved if MAO is in the equilibrium state.
Equilibrium state of MAO and the self-defined design of ceramic layers
When f > 20 kHz (k < 3.3), the resistance distribution in the oxidation films tended to be uniform (Figure 7a). Next, the electric field distribution of the sample surface became the only factor affecting the current distribution. The space-time distribution and energy at each microdischarge and the micropore structure were directly and significantly affected by ACD (Figure 11b). At the center of the sample surface corresponding to the cathode pinpoint, the microdischarge demonstrated a stronger energy and resulted in larger micropore sizes and higher ceramic-layer porosity compared with those in other areas.
As the resistance distribution approached uniformity, it approached the equilibrium state for most of time, such as the asymptote E(α) = 0 in the E(α)-n curves (Figure 7a). At the center of the sample surface corresponding to the cathode pinpoint, a lower ACD resulted in a stronger microdischarge compared with those in the other areas; however, numerous defective microdistricts still reached the critical current intensity and discharge (Figure 11b). Therefore, the microdischarge and micropore structures were spatially small and uniform, except for those in the surface areas corresponding to the cathode pinpoint (Figure 11b). When the processing time was prolonged, MAO gradually approached the equilibrium state, and a higher number of microdistricts could not discharge because of current scattering; therefore, the microdischarge was eventually fixed at the sample center corresponding to the cathode pinpoint (Figure 3c). Subsequently, an MAO method can be used to induce and control the high-temperature plasma at the millimeter/micrometer scale.
In the equilibrium state of MAO, the motion pattern of the cathode pinpoint, distance from the pinpoint to the sample, and total current density could be appropriately controlled. These methods enabled achieving a microdischarge space-time distribution and favorable energy in different areas on the sample surfaces, controlling the growing pattern of ceramic layers and micropore structures in different areas, and designing the self-defined ceramic layer growth.
Equilibrium state of MAO and micromachining
When the cathode surfaces were flat, the anode surfaces demonstrated different ROCs (Figure 11d). According to Gauss' law,15 the ROC has a more significant effect on the electric field intensity/current density in different areas on sample surfaces compared with ACD. By reasonably controlling the total current density, we could restrict all the microdischarges to the sample tips, but no discharge occurred in other areas because of current scattering (Figure 3b, Figure 11d). Specifically, when the discharge was locked in area A (Figure 11d), it may exfoliate the oxides in area A, whereas the gas and/or plasma shock wave washed the molten oxide grains into the electrolyte. Next, the ROC in area A increased and flattened (Figure 11d), causing the electric field intensity to accumulate in the tips demonstrating a lower ROC, and the discharge was also transferred to other areas with a lower ROC, further exfoliating the oxides. When the total current density from the power supply was suitably controlled, appropriately selecting Don and Doff facilitated controlling the postdischarge continuous state of the oxides, we were able to perform the millimeter/micrometer scale or possibly realizing the nanometer-scale polishing of anode materials in the MAO equilibrium state(Figure 11d).
Conclusions
We divided an oxidation film into several scattered microdistricts and statistically analyzed the electrode system. The concept of cellular automaton was used to create an MAO discrete kinetics model, a microarc algorithm. This algorithm was used to deduce the core parameter, namely the feedback coefficient k, controlling the direction and rate of anode resistance/current distribution.
The coefficient k is defined as the increase in ΔR in a defective microdistrict per α after one time discharge; specifically, k = ΔR/α, where α indicates the difference in the degree of resistance in a defective microdistrict relative to eight surrounding microdistricts:  . Moreover, this coefficient can be used to measure the feedback effect of each defective microdistrict discharge on the next-time current distribution. The k coefficient is determined by four factors, namely total power current density Ip, pulse width Don, pulse width interval Doff, and conductivity σ of the discharge product: k = g(Ip, Don, Doff, σ). In this study, Don and Doff were used to experimentally study k and MAO kinetics.
At k > 3.3 and f < 10 kHz, the degree of disequilibrium of the microdistrict resistance increased according to a power law. The current distribution in the anode tended to deviate from the equilibrium state. The process also caused the emergence of ordered energy (temperature rise in gas and/or microdischarges), ordered structure (microdischarges increase in size and link together) and orderly function (increase of ceramic layer porosity). The anode current distribution deviating from the equilibrium state was the root cause of the microdischarge orderliness and the growth of the uniform ceramic layer.
At k < 3.3 and f > 20 kHz, the disequilibrium of the microdistrict resistance decreased according to a power law. The current distribution in the anode was scattered uniformly and approached a uniform and steady state. The microdischarges were rapidly dissipated because the current was scattered uniformly. At this time, the microdischarges were different from those in a general MAO. The electrical environment enabled fully controlling the distribution and energy of the microdischarges. The microdischarges exhibited a smaller-scale spatial distribution compared with the arc discharge, and they also demonstrated a higher heat effect compared with the glow discharge. The equilibrium-state MAO technique facilitates inducing and controlling high-temperature plasma at the millimeter/micrometer scale.
At 10 kHz < f < 20 kHz and k ≈ 3.3, the microdischarge group was in a critically stable state and behaved in a complex manner after losing its stable state with time. The unstable phenomenon should be avoided when the MAO technique is used.
Acknowledgments
The authors thank Congjie Wang, Yanfeng Ge, Zheng Cao, Chao Zhang, and Long Zhang for their suggestions. We also thank our families for their encouragement and support.