Abstract
Mesoporous molybdenum disulfide (MoS2) with different morphologies have been prepared via hydrothermal method using different solvents, water or water/acetone mixture. The MoS2 obtained with water alone gave a graphene-like nanoflakes (g-MoS2) while the other with water/acetone (1:1 ratio) gave a hollow-like morphology (h-MoS2). Both materials are modified with carbon nanospheres as conductive material and investigated as symmetric pseudocapacitors in aqueous electrolyte (1 M Na2SO4 solution). The physico-chemical properties of the MoS2 layered materials have been interrogated using the surface area analysis (BET), scanning electron microscopy (SEM), transmission electron microscopy (TEM), X-ray diffraction (XRD), Raman, fourier-transform infrared (FTIR) spectroscopy, and advanced electrochemistry including cyclic voltammetry (CV), galvanostatic cycling with potential limitation (GCPL), repetitive electrochemical cycling tests, and electrochemical impedance spectroscopy (EIS). Interestingly, a simple change of synthesis solvents confers on the MoS2 materials different morphologies, surface areas, and structural parameters, correlated by electrochemical capacitive properties. The g-MoS2 exhibits higher surface area, higher capacitance parameters (specific capacitance of 183 F g−1, maximum energy density of 9.2 Wh kg−1 and power density of 2.9 kW kg−1) but less stable electrochemical cycling compared to the h-MoS2. The findings show promises for the ability to tune the morphology of MoS2 materials for enhanced energy storage.
Export citation and abstract BibTeX RIS

This is an open access article distributed under the terms of the Creative Commons Attribution Non-Commercial No Derivatives 4.0 License (CC BY-NC-ND, http://creativecommons.org/licenses/by-nc-nd/4.0/), which permits non-commercial reuse, distribution, and reproduction in any medium, provided the original work is not changed in any way and is properly cited. For permission for commercial reuse, please email: oa@electrochem.org.
One of the factors that determine the performance of any energy material, be it in catalysis, sensing, photochemistry or electric energy storage, is its morphology.1 This explains why different materials with different dimensions (zero-, one-, two- or three-dimensional nanostructures) give different physico-chemical properties and applications.2 Morphology has effects on the surface area, kinetics and thermodynamic properties of the materials.3 For example, it is has been known that graphene and carbon nanotubes give different catalytic properties due to their morphologies.4 Nanowires are known to enhance electron transport compared to nanoparticles of the same materials.5
Molybdenum disulfide (MoS2), which belongs to the family of transition-metal dichalcogenides (TMDs), has been receiving some research attention as a viable energy storage materials, both as supercapacitor and anode material for lithium-ion batteries.6,7 As an important inorganic layered materials, MoS2 has been shown to be an analogue of graphene,8 and useful as hydrogen storage,9 catalysis,10 supercapacitors,11 pseudocapacitors12 and anode material for lithium-ion batteries.13
One of the active research areas of MoS2 is in the fabrication of supercapacitors.14 In the last three years, it is interesting to observe that MoS2 has begun to attract interest even as full cell (2-electrode) configurations.12,15–20 The supercapacitor performance of MoS2 has been compared to that of the carbon nanotubes (CNT) array electrodes.6,21 Spherical morphology of the MoS2 remains the most investigated morphology for supercapacitor application. Recently, however, Li et al.7 showed that hierarchical hollow (rod-like) morphology of MoS2 (with acetylene black as conducting agent) can potentially serve as a viable anode material for lithium-ion batteries. Also, Qiu et al.22 showed that MoS2 with hollow microsphere morphology (using amorphous carbon as conducting agent) is a promising anode material for lithium-ion batteries. Due to the poor conductivity of the MoS2, most studies involves its use as energy storage electrode materials involved the modification with conducting materials such as CNT,11 polyaniline (PANI),23 polypyrrole (PPy),24 and reduced graphene (RGO),25 acetylene black7 and amorphous carbon.22
In our previous work,12 we reported how the presence of CNS is intrinsically linked to the pseudocapacitance of MoS2 with flower-like and spherical morphologies. The previous study suggested that different morphologies give different physico-chemical properties. The present work is aimed at answering the question of: "to what extent can the physico-chemistry and pseudocapacitance be influenced by changes in the synthesis methods and morphologies of MoS2"? Thus, in this work, we have introduced a facile synthesis method of preparing two different MoS2: i) graphene-like MoS2 nanoflakes, and ii) hierarchical hollow MoS2 morphology, by simply using water and water/acetone mixture in a one-pot hydro/solvothermal process. We explored the impact of the different morphologies on the pseudocapacitive properties of the MoS2 using a symmetric cell (2-electrode configuration) with carbon nanospheres (CNS) as a conducting agent. From our findings, we prove that the pseudocapacitive storage properties of the MoS2/CNS (especially, in terms of cycling stability and electronic conductivity) are strongly dependent on the morphology of the MoS2, the graphene-like nanoflakes showing better physico-chemical properties than the hierarchical morphology.
Experimental
Materials
All reagents were used as obtained without further purification: molybdenum trioxide, MoO3 (Analytical Reagent, Hopkin & Williams Ltd, London), potassium thiocyanate, KSCN (SAARCHEM Pty Ltd), sucrose, C12H22O11 (Sigma-Aldrich), acetone (C3H6O) and absolute ethanol (C2H6O) were purchased from the Associated Chemical Enterprises. All chemicals had purity higher than 99.99%.
Synthesis of graphene-like MoS2 (g-MoS2) and hollow MoS2 (h-MoS2)
The g-MoS2 sample was synthesized using a method by Matte et al. with few modifications.8 Briefly, 1 mmol (0.61 g) of MoO3 and 2.5 mmol (1.94 g) of KSCN were mixed in 30 ml of deionized water, rapidly stirred for 1 h and transferred into a 40 ml Teflon cup. The mixture is then heated with continuous stirring in a stainless steel autoclave for 24 h while maintaining a temperature of 180°C. A black precipitate is first retrieved from the solution, and washed with distilled water three times, then dried in vacuum at 60°C for 6 h. The hollow MoS2 rods were synthesized in a similar way, except the solvent used was a mixture of 15 ml de-ionized water and 15 ml acetone.
Mechanical exfoliation of MoS2 and CNS
First, carbon nanospheres (CNS) were obtained using the established method:26 In summary, a 0.3 M sucrose solution was transferred into a 100 ml Teflon-lined stainless steel autoclave and heated at 150°C for 5 h. Upon cooling to room temperature, the product (a black precipitate) was purified by Soxhlet extraction, extensive washing with ethanol and water, and then drying at 80°C in an oven. Each of the MoS2/CNS composite was obtained by mixing 1.1 g MoS2 sample with 0.08 g CNS in de-ionized water and ultrasonicating for an hour. The product was collected by centrifugation and dried in an oven overnight.
Characterization techniques
XRD patterns were obtained using the DMax/2500PC diffractometer (Co Kα radiation; K = 1.5418 Å) at 40 kV, 100 mA and a 2θ range of 10–90°. FTIR spectra were obtained from a Bruker Tensor 27 FTIR spectrometer. Raman spectra were obtained in air using a Horiba Jobin Yvon spectrometer equipped with an Olympus BX40 microscope attachment to focus the laser beam on a small selected area of the sample, a 30 mW green argon laser (λ = 514 nm) an excitation source, and a 1800 lines per mm grating monochromator with liquid nitrogen-cooled CCD. Brunauer Emmett and Teller (BET) analysis was carried out with Micromeritics TriStar II instrument. FESEM images were obtained from JEOL-JSM 7500F scanning electron microscope operated at 2.0 kV and FEI Nova Nanolab 600 SEM. Elemental composition was obtained using the Oxford INCA EDS software on the SEM. TEM images were obtained with FEI Tecnai T12 microscope operated at an acceleration voltage of 120 kV.
Fabrication of symmetric pseudocapacitor and electrochemical measurements
The symmetric pseudocapacitors were carried out with Swagelok cells (MTI, Inc., USA). Nickel foam (Celmet: thickness = 1.6 mm, surface area 7500 m2, cell size = 0.5 mm, 48–52 cells per inch) was used as substrate and current collector. Prior to use, the nickel foam was thoroughly cleaned by sonicating in 1 M HCl solution for 30 min, washing with copious amount of distilled water, and finally drying under vacuum. The electrode materials were prepared by first thoroughly mixing the active materials (either MoS2/CNS or MoS2), carbon black as the conducting agent, and polyvinylidene fluoride (PVDF) as the binder (80:15:5 weight ratio) using pestle and mortar with few drops of anhydrous N-methyl-2-pyrrolidone (NMP) to produce a homogeneous paste. The resulting slurry was coated onto the nickel foam substrate with a spatula. The electrode was then dried at 60°C overnight in a vacuum oven. For complete impregnation, the assembled cells were left for 12 hours prior to testing. The average mass of the active material for the symmetric electrode was ca. 7.4 mg. A 1 M Na2SO4 solution was used as the electrolyte while a porous filter paper (Whatman) served as the separator. The measurements were carried out in 1 M Na2SO4 aqueous electrolyte. All electrochemical measurements; cyclic voltammetry (CV), galvanostatic cycling with potential limitation (GCPL), and electrochemical impedance spectroscopy (EIS) were performed at room temperature using computer-controlled Multi-channel potentiostat/galvanostat Bio-Logic VMP3 work station driven by EC-Lab v10.40 software with Z-fit tool for EIS data analysis. EIS measurements were carried out in the frequency ranging from 10 kHz to 10 mHz at the open circuit voltage with AC voltage amplitude of 1.5 mV.
The supercapacitive properties of the symmetric cells, specific capacitance (Csp), maximum power density (Pmax) and energy density (Esp) were calculated from the charge-discharge curves using the following Equations 1–5.27,28
![Equation ([1])](https://content.cld.iop.org/journals/1945-7111/163/9/A1927/revision1/d0001.gif)
![Equation ([2])](https://content.cld.iop.org/journals/1945-7111/163/9/A1927/revision1/d0002.gif)
![Equation ([3])](https://content.cld.iop.org/journals/1945-7111/163/9/A1927/revision1/d0003.gif)
![Equation ([4])](https://content.cld.iop.org/journals/1945-7111/163/9/A1927/revision1/d0004.gif)
![Equation ([5])](https://content.cld.iop.org/journals/1945-7111/163/9/A1927/revision1/d0005.gif)
where i (A) represents the applied current, ΔV (V)/Δt (s) is the slope of the discharge curve and m (g) the total mass of the two electrodes, C (F) is the calculated capacitance, V (V) is the maximum voltage obtained during charge, and Rir is the internal resistance estimated from the voltage drop at the beginning of the discharge curve, while the ΔVir is the voltage drop.
Results and Discussion
Material characterization
MoS2 was synthesized by direct reaction of molybdenum trioxide and potassium thiocyanate in a one-step hydrothermal process. Figure 1 outlines the morphology of MoS2 in the as-synthesized condition. SEM and TEM micrographs reveal a 2-dimensional graphene-like nanoflakes. Figure 2 shows the EDS mapping, clearly providing the images of the elemental distribution of the MoS2. Microscopic investigations were conducted to study the morphological evolution of graphene-like MoS2 and hollow tubes. Figure 3 shows the morphologies of hollow MoS2 obtained from TEM and SEM. Evidently, the hollow structures have a diameter range between 100 and 250 nm and a length of up to 1 μm. These rods are composed of nanosheets with estimated thickness of 4 nm. Few rods with open ends were seen in Figure 3a. The different contrast (shown by the TEM images) between the center of the rods and the edges suggests a porous internal.
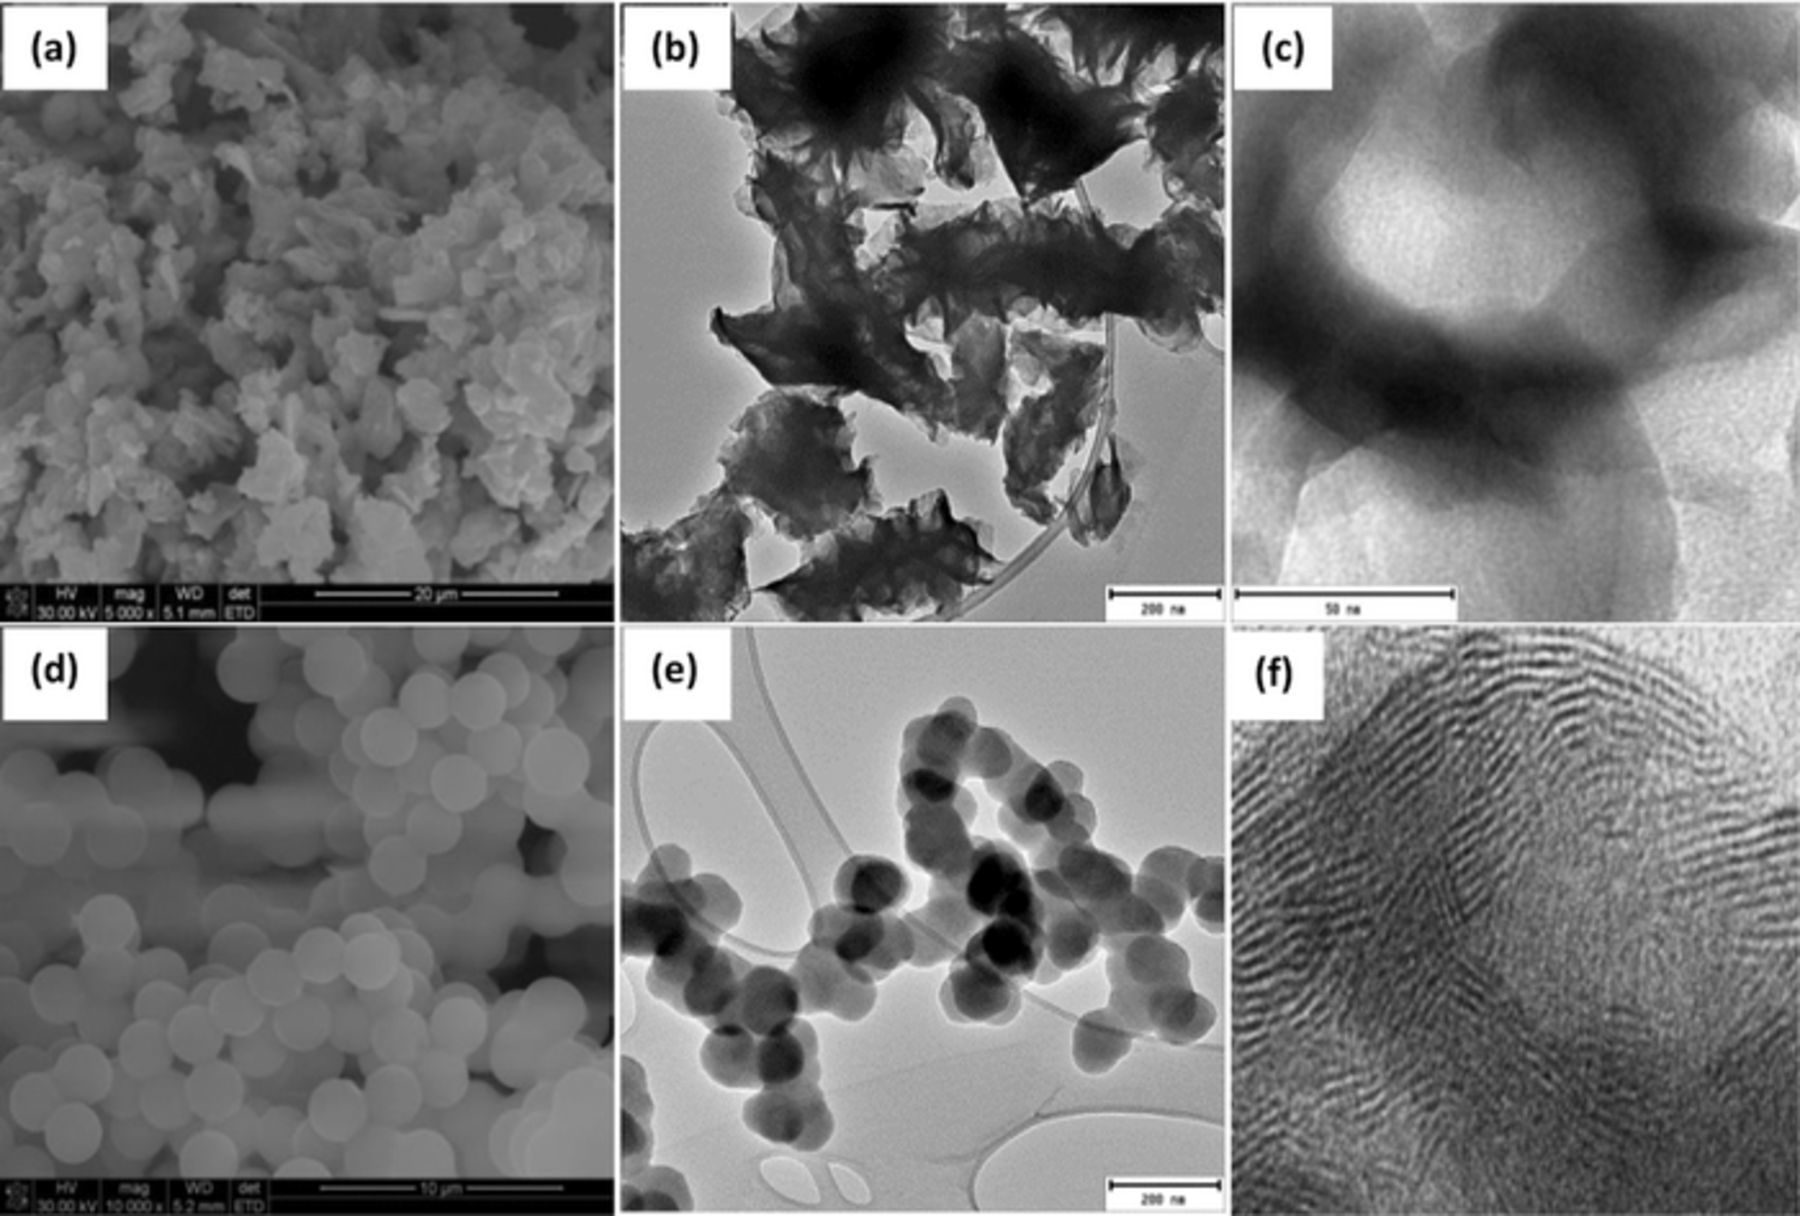
Figure 1. SEM (a,d) and TEM (b,c,e,f) images of g-MoS2 (a,b,c), CNS (d,e), and d-spacing of g-MoS2 (f).
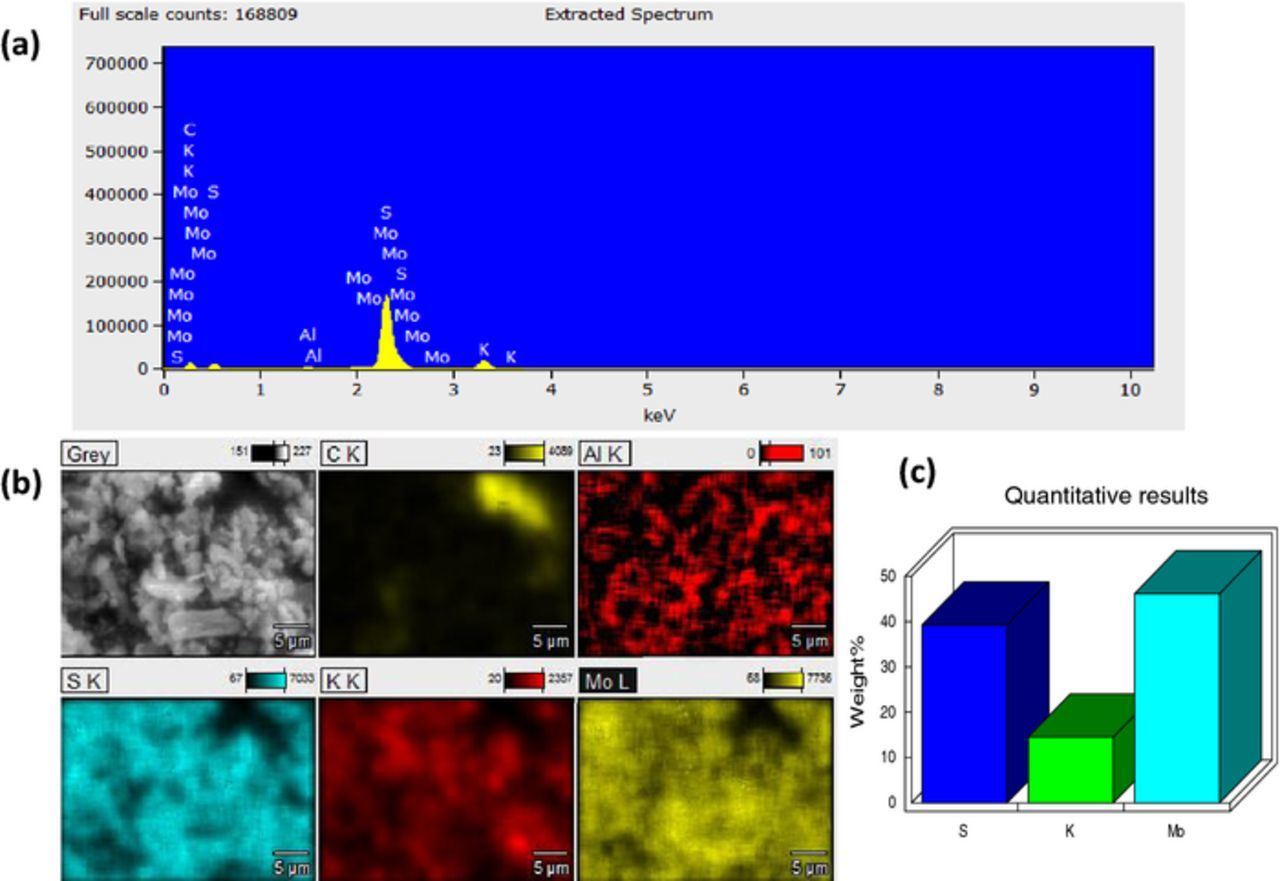
Figure 2. (a) EDS spectra and elemental composition of g-MoS2, (b) EDS mapping of the Mo, S and K in g-MoS2, and (c) bar chart representation of the elemental composition of the g-MoS2.
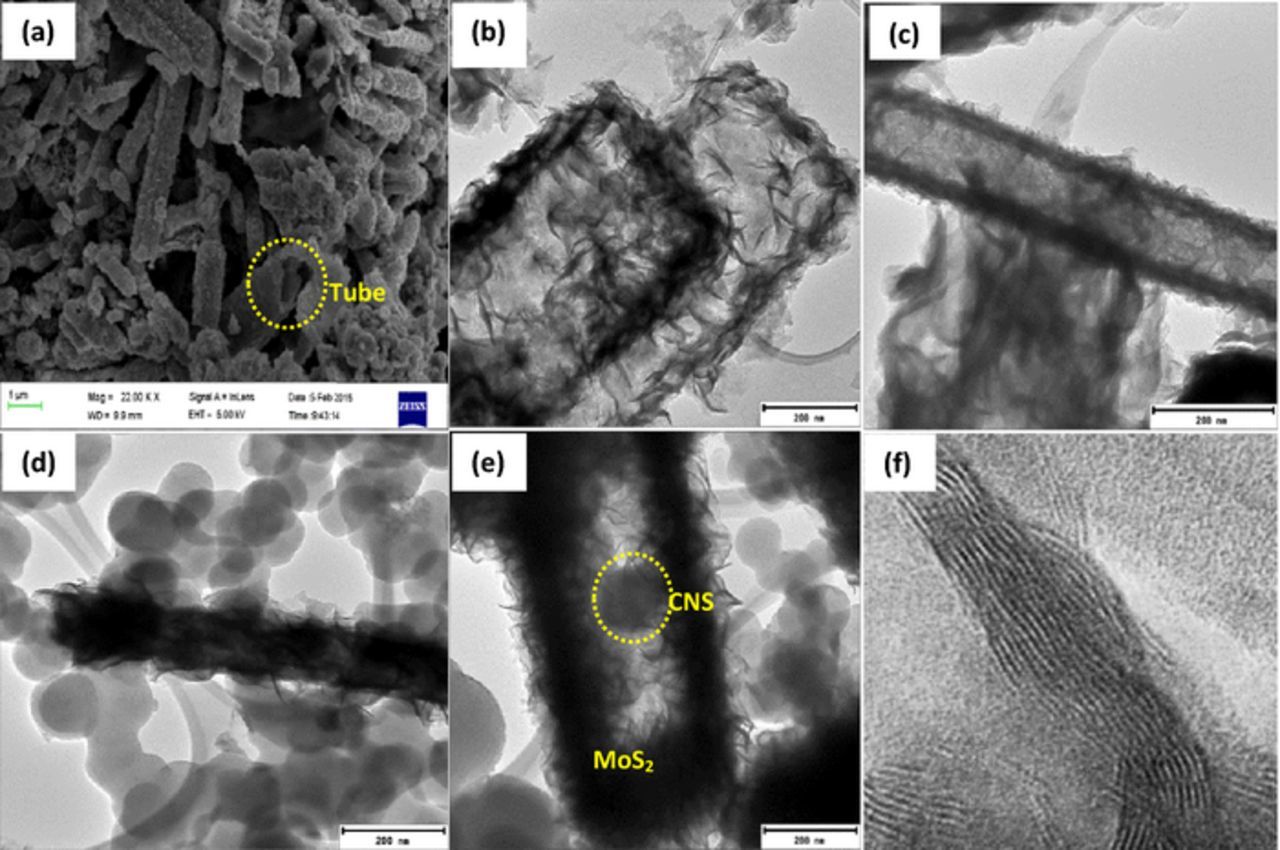
Figure 3. SEM (a,d) and TEM images (b,c,e,f) of h-MoS2 (a,b,c), h-MoS2/CNS (d,e) and d- spacing of h-MoS2 (f).
The elemental composition of the as-synthesized g-MoS2, obtained from the EDS (Figure 2 and summarized in Table I) show S (35), K (6.61) and Mo (58.37) weight %. Also, for the h-MoS2 (Figure 4) the values were S (39.29), K (14.55) and Mo (46.16) weight %. Intuitively, the the results suggest that the stoichiometry is MoS1.75 for the g-MoS2 and MoS2.25 for the h-MoS2 which, within the limits of errors, satisfactorily confirm the stoichiometry of the MoS2. The impurity 'K' is attributed to the starting precursor KSCN.
Table I. Concentration of Mo, S and K, calculated from EDS.
| S (K) | K (K) | Mo (L) | ||||
|---|---|---|---|---|---|---|
| Sample | Weight % | Atomic % | Weight % | Atomic % | Weight % | Atomic % |
| g-MoS2 | 35.02 | 58.42 | 6.61 | 9.04 | 58.37 | 32.54 |
| h-MoS2 | 39.29 | 58.95 | 14.55 | 17.9 | 46.16 | 23.15 |
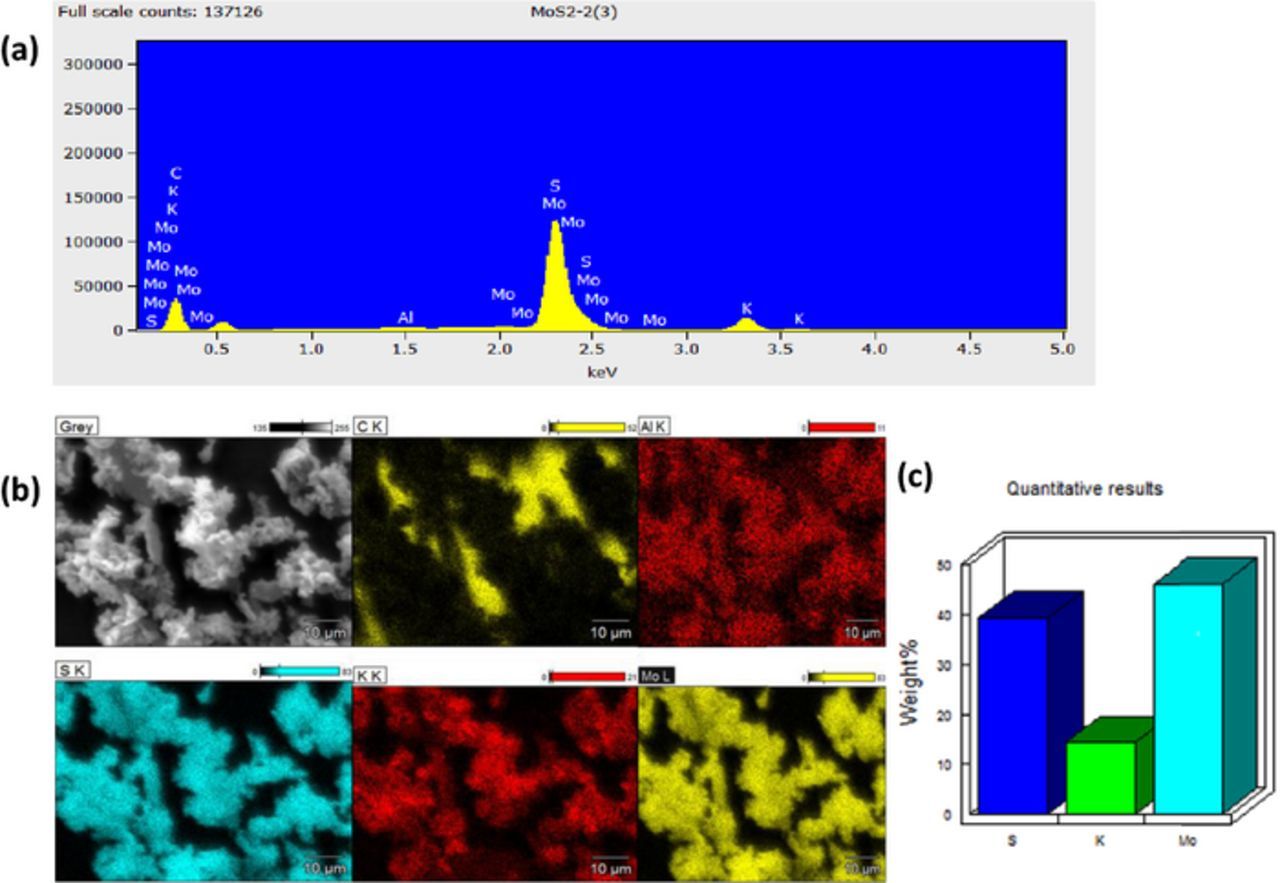
Figure 4. (a) EDS spectra and elemental composition of h-MoS2, (b) EDS mapping of the Mo, S and K in h-MoS2, and (c) bar chart representation of the elemental composition of the h-MoS2.
Figure 5 compares the spectroscopic data (XRD patterns, Raman and FTIR) of the two as-synthesized MoS2 materials. The XRD peaks (Figures 5a–5c) observed at about 16.7°, 39° and 69° for g-MoS2, and 16.7°, 38° and 68° for the h-MoS2 are attributed to (002) (103) and (201) planes. Both MoS2 materials exhibit similar XRD patterns in terms of peak positions and in good agreement with the hexagonal structure. The spectral data provide critical information. For example, it is observed that the transformation of the g-MoS2 to h-MoS2 leads to decreased (002) peak intensity, an indication that the transition to h-MoS2 leads to a dramatic suppression of the growth of the MoS2 layers. Secondly, as depicted in Fig. 5b, there is a slight shift (∼4°) to the higher 2θ, which is an indication of a lattice contraction for the g-MoS2. Thirdly, the peaks of the g-MoS2 are generally broader than those of the h-MoS2, the full-widths at half maximum (FWHM) for the g-MoS2 being larger than those of the h-MoS2, which is indicative of the average particle size of the g-MoS2 being smaller than that of the h-MoS2. The average particle was estimated by Scherrer formula and found to be 11.05 and 14.63 nm for g-MoS2 and h-MoS2, respectively. This finding means that the surface area of the g-MoS2 will be larger than that of the h-MoS2.
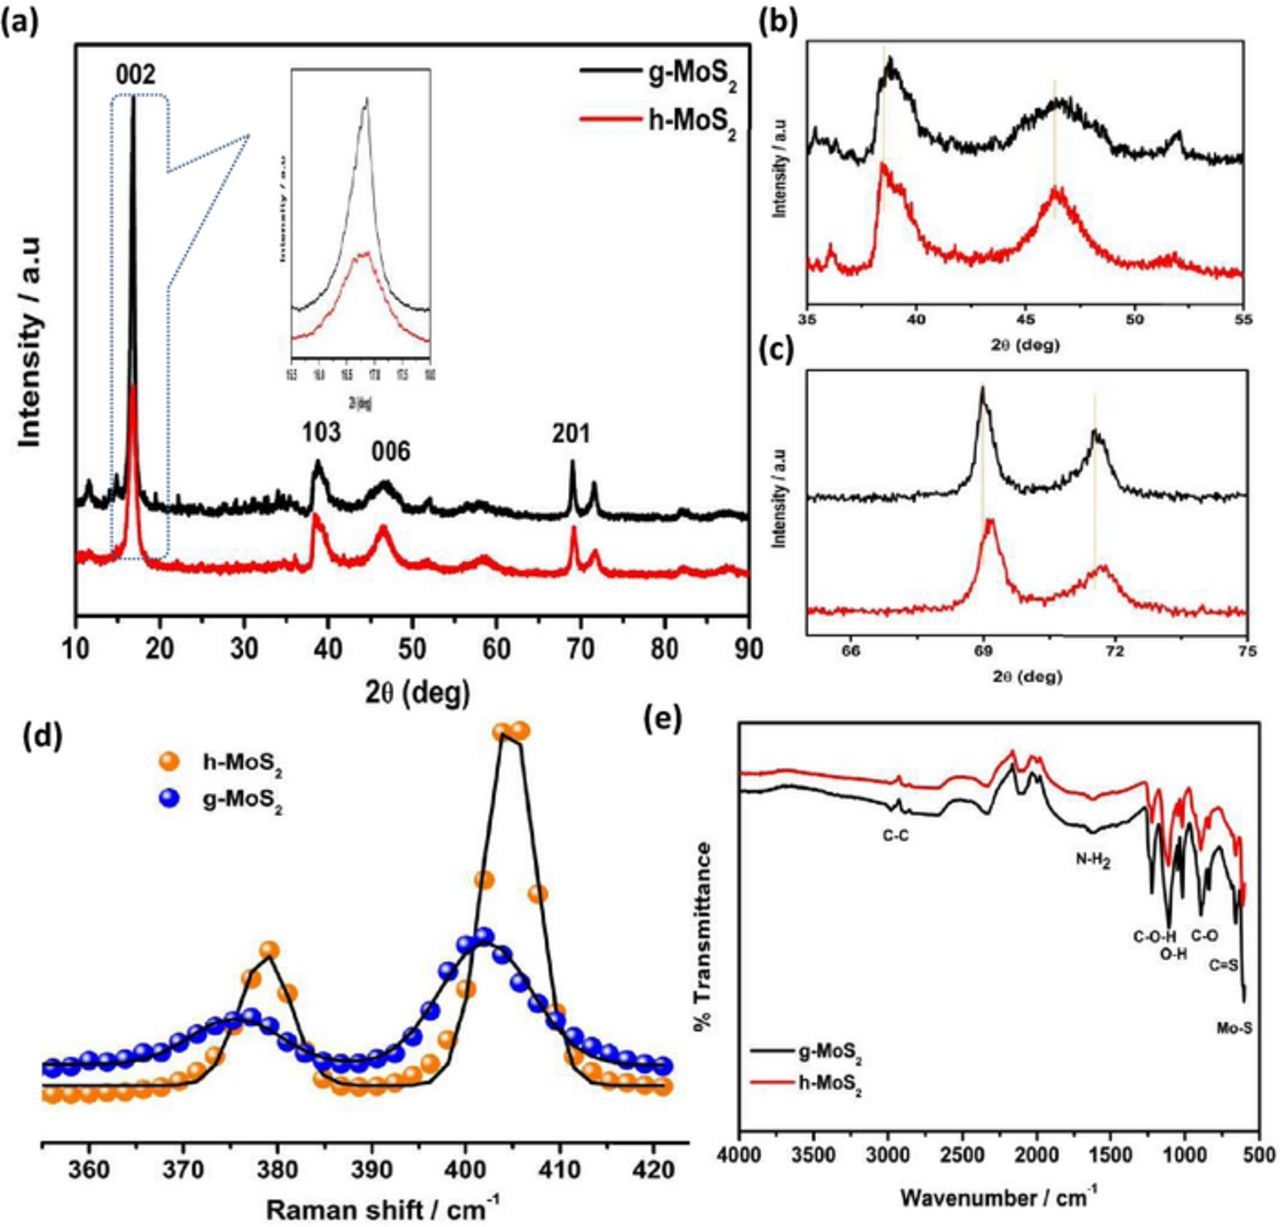
Figure 5. XRD pattern of g- and h- MoS2 (a) and their magnified view (b,c) Raman spectra of g-and h-MoS2 (d) FTIR spectra of g-and h-MoS2 (e).
Raman spectra of the two MoS2 materials (Fig. 5d) show the characteristic E2g and A1g bands, respectively located at 377 and 402 cm−1 for the g-MoS2 and at 379 and 405 cm−1 for the h-MoS2. The E12g mode is related to the in-layer displacement of the Mo and S atoms, while the A1g mode is associated with the out-of-layer symmetric displacements of the S atoms along the c axis.29 According to Lee et al.,30 the frequency difference between E12g and A1g modes could serve as a convenient and robust diagnostic of the layer thickness of MoS2 samples. From the Raman data, there is a slight difference for the |E12g – A1g| value (cf. 25 cm−1 for the g-MoS2 and 26 cm−1 for the h-MoS2), which suggests that the h-MoS2 has a higher number of layered MoS2 sheets than the g-MoS2. However, the FWHM is clearly larger for the g-MoS2 than that of the h-MoS2. The broadening of the Raman bands is associated with phonon confinement, and indicative of the fact that the lateral dimensions of the g-MoS2 layers are more in the nano-dimension than that of the h-MoS2. Simply stated, the average particle size of the g-MoS2 is smaller (hence larger surface area) than that of its h-MoS2 counterpart, in excellent agreement with the XRD data. Also, it may be concluded here that use of acetone/water mixture in the synthesis process promotes the formation of more MoS2 layers compared to the use of water alone that promotes the formation of smaller nano-sized MoS2 materials.
The FTIR data (Fig. 5e) are consistent with the expected functional groups, including the NH2 in-group deformation at 1583 and 1518 cm−1, N-C-N asymmetric stretching at 1466 cm−1, stretching vibrations of O-H bonds at 1231 cm−1, the C-O-H stretching mode at 1092 cm−1, the C-S stretching vibrations of L-cysteine at 729 cm−1, the weak Mo-S vibration peak around 600 cm−1, and the C=C symmetric and asymmetric stretching vibrations at 2892 cm−1 and 2971 cm−1.
Surface area from the BET (five-point analysis) summarized in Table II shows that the g-MoS2 has a higher specific surface area (15.3 m2 g−1) than its h-MoS2 counterpart (9.94 m2 g−1). This result is in excellent agreement with the findings from the XRD and Raman analyses. The dramatic reduction of the surface area of the h-MoS2 due to the employment of water/acetone mixture in the synthesis protocol can be explained by the transformation of the morphology. The BET shows that g-MoS2 and h-MoS2 are mesoporous materials, with the pore size of the former being larger (∼43 nm) than the latter (∼27 nm).
Table II. BET results showing porous texture of the as-synthesized materials.
| SABET | Pore Volume | Pore Size | |
|---|---|---|---|
| Sample | m2/g | cm3/g | nm |
| g-MoS2 | 15.3 | 0.09 | 42.91 |
| h-MoS2 | 9.94 | 0.07 | 27.18 |
Electrochemical properties
Figure 6 compares typical cyclic voltammograms (CV) and charge-discharge (GCPL) evolutions of the individual CNS, g-MoS2 and h-MoS2 obtained from 3-electrode configuration in 1 M Na2SO4 at 5 mVs−1. Evidently, g-MoS2 exhibits higher capacitance compared to the h-MoS2 and CNS. The h-MoS2, however, showed high potential window. The specific capacitance of 32, 16.4 and 3.4 Fg−1 obtained for g-MoS2, h- MoS2 and CNS at a current density of 0.1 Ag−1. The observed capacitance at higher current density is much better when compared to literatures.15–22,26 For example, Bissett et al.15 reported a value of 3.40 F g−1 for MoS2 in 1 M Na2SO4, while Winchester et al.18 reported ∼3.1 mF cm−2 in 6 M KOH. Figure 7 shows that the electrochemical data of the symmetric cells (full cells) obtained from the CNS-based composite materials, the g-MoS2/CNS and h-MoS2/CNS. There are three key findings here that should be emphasized. First, the g-MoS2/CNS can be cycled at high current densities (0.1–2 Ag−1) while the h-MoS2/CNS can only be cycled at lower current densities (0.07–0.5 Ag−1). Second, at the same scan rate, the g-MoS2/CNS gave higher current response compared to the h-MoS2/CNS. Third, the g-MoS2/CNS exhibits much higher capacitance (e.g., ∼200 Fg−1 at 0.1 Ag−1) compared to the h-MoS2/CNS (∼30 Fg−1 at 0.1 Ag−1). Table III summarizes the values of capacitance (F g−1), maximum energy (Wh kg−1) and power densities (W kg−1) of the symmetric cells. The maximum values for the g-MoS2/CNS system are 183 F g−1, 9.2 Wh kg−1 and 2907 W kg−1. For the h-MoS2/CNS system, the values are 70 F g−1, 7.81 Wh kg−1 and 1364 W kg−1. The high performance of the g-MoS2/CNS symmetric cell may be related to the high surface area of the g-MoS2 material. As evidenced by TEM, the two different morphological evolutions play a vital role in differentiating the capacitive performances. The rod-like structure of h-MoS2 shows different contrast between the center of the rods and the edges suggests internal porosity.
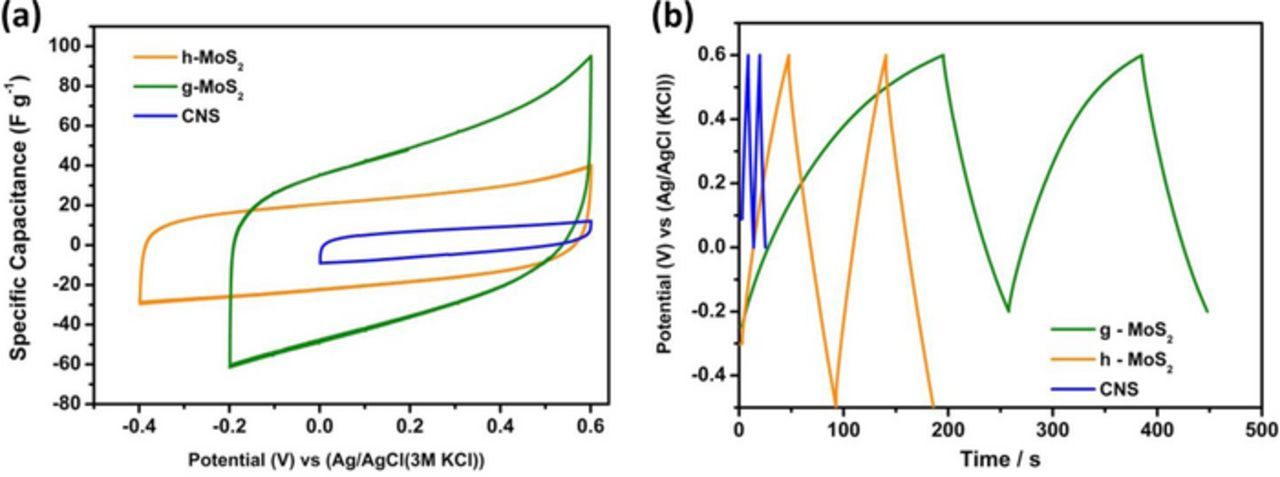
Figure 6. Typical CV (5 mV s−1) (a) and charge- discharge (0.1 A g−1) (b) profiles of three-electrode configurations of g-MoS2, h-MoS2 and CNS.
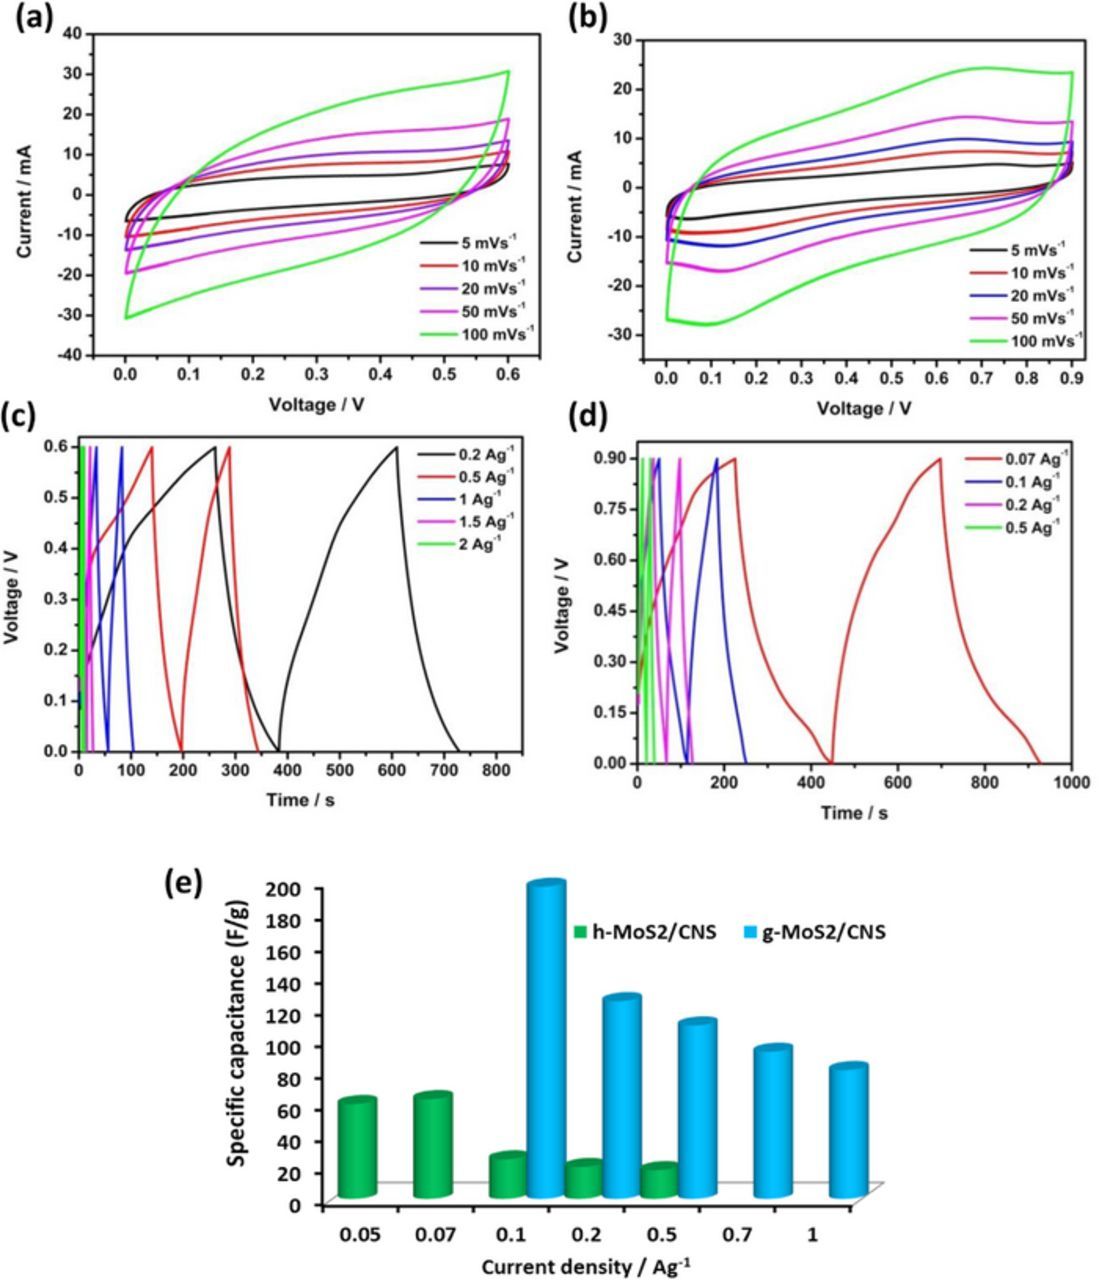
Figure 7. Typical CV (a,b) and charge- discharge (c,d) profiles of symmetric cells obtained from g-MoS2/CNS (a,c) and h-MoS2/CNS (b,d) composites, capacitance against different current density (e).
Table III. Comparison of electrochemical capacitive parameters of various MoS2-based supercapacitors.
| Aqueous Electrolyte | Electrode material | Device configuration | Voltage window (V) | Csp / F g−1 | Esp/ Wh kg−1 | Pmax/ W kg−1 | Ref. |
|---|---|---|---|---|---|---|---|
| 1 M Na2SO4 | g-MoS2/CNS | Symmetric | 0.6 | 183 | 9.17 | 2907 | This work |
| 1 M Na2SO4 | h-MoS2/CNS | Symmetric | 0.9 | 70 | 7.84 | 1360 | This work |
| 1 M Na2SO4 | MoS2 | 3-electrode | 0.7 | 92.85 | 7.25 | 186.5 | 22 |
| 1 M Na2SO4 | MoS2/r-GO | 3-electrode | 0.6 | 253 | 12.65 | 300 | 26 |
| 1 M Na2SO4 | MoS2/MWCNT | 3-electrode | 1.0 | 452.7 | - | - | 11 |
The electrochemical cycling stability of the MoS2-based symmetric pseudocapacitor were first tested using the traditional long-term repetitive cycling at 1 A g−1 (Fig. 8). From Fig. 8, the g-MoS2/CNS-based symmetric pseudocapacitor showed initial capacitance of ∼35 Fg−1 and 28 Fg−1 at the end of the 2000th cycle (i.e, about 20% loss of capacitance). On the other hand, the h-MoS2/CNS system started with about 17 Fg−1 at the zeroth cycle and 15 Fg−1 at the 2000th cycle (i.e., ∼12% loss in capacitance). The coulombic efficiency of the systems (η / %) was obtained from Equation 6
![Equation ([6])](https://content.cld.iop.org/journals/1945-7111/163/9/A1927/revision1/d0006.gif)
where td is the discharge time and tc the charge time.
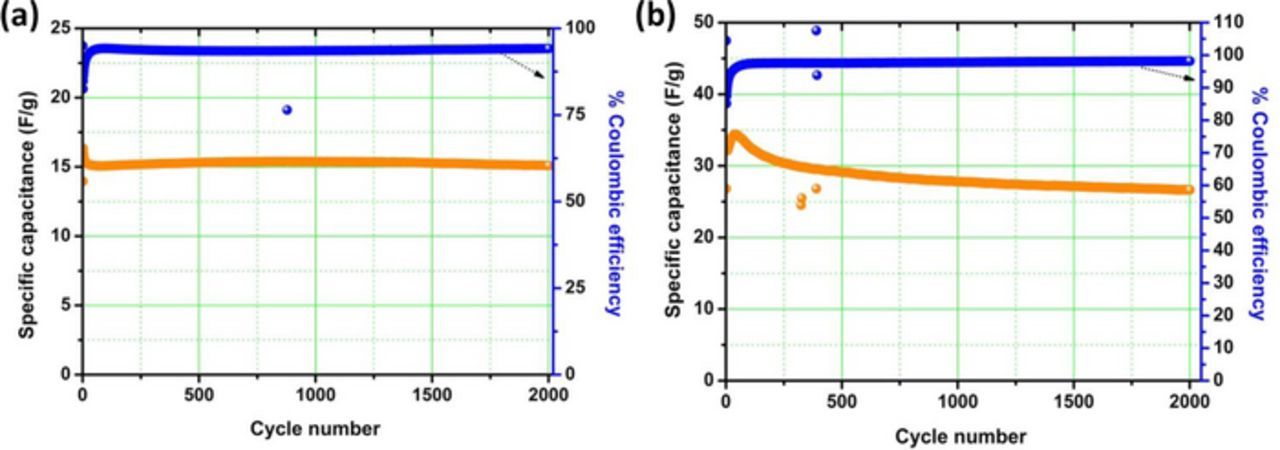
Figure 8. Electrochemical cycling test of symmetric pseudocapacitors based on (a) h-MoS2/CNS and (b) g-MoS2/CNS materials. All data were obtained in 1 M Na2SO4 solution at 1 A g−1.
From Fig. 8, the coulombic efficiency for each of the system was about 80% between the zeroth and 50th cycle, but then stabilized at 100% from the 50th to the 2000th cycle. The result indicates that the MoS2-based symmetric pseudocapacitor require sufficient amount of cycling time to equilibrate prior to a stable power generation.
Figure 9 compares the Nyquist and Bode plots of the two systems, satisfactorily fitted with the Voigt RC electrical equivalent circuits (Fig. 9e). The circuit comprises the series resistance (Rs), charge-transfer resistance (Rct) and constant-phase elements (CPE or Q). As shown in Table IV, the Rs values for the h-MoS2/CNS system before and after 2000th cycle are 0.78 Ω and 0.81 Ω, respectively. For the g-MoS2/CNS, the Rs values before and after 2000th cycle were 0.37 Ω and 0.66 Ω, respectively. The combined Rct values for the h-MoS2/CNS before and after cycling were 2.28 Ω and 5.01 Ω, respectively. For the g-MoS2/CNS, the equivalent values were 5.65 Ω before and 19.2 Ω after the 2000th cycle. The result shows that the h-MoS2/CNS-based cell is more stable than the g-MoS2/CNS, which corroborates the cycling performance described in Fig. 8. Also, the n values are generally greater than 0.5, which proves the pseudocapacitive properties of the MoS2-based symmetric cells.
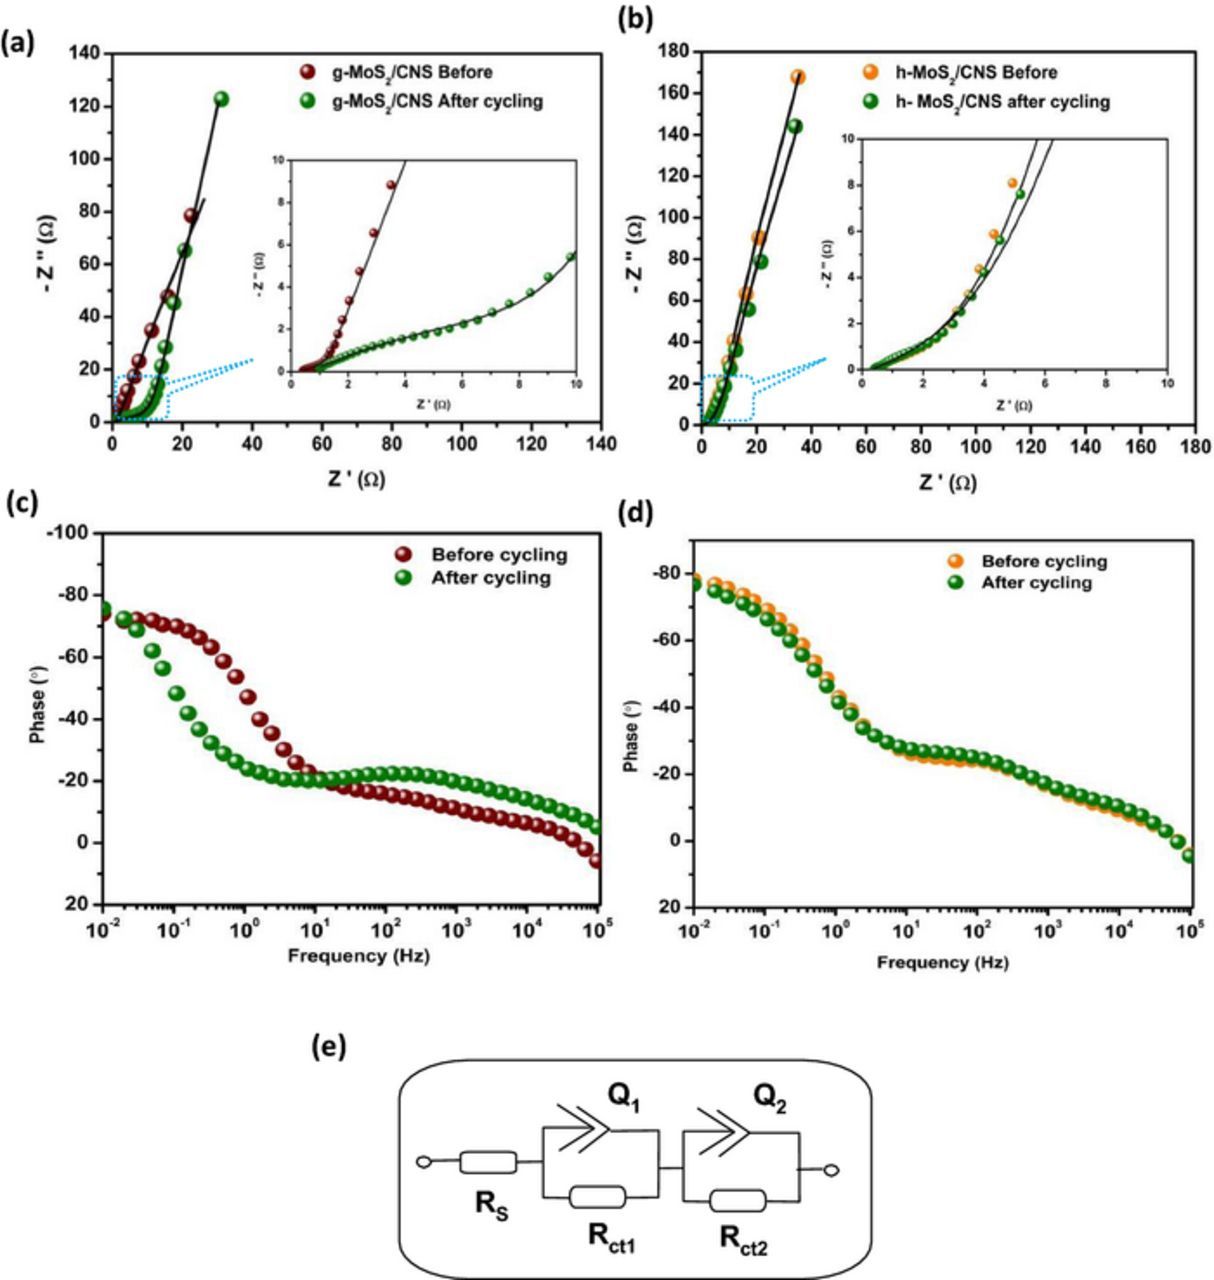
Figure 9. Nyquist plots (a,b) and Bode plots (c,d) for g-MoS2/CNS (a,c) and h-MoS2/CNS (b,d) the MoS2/CNS before and after 2000 cycling tests. (e) is the Voigt electrical equivalent circuit used in fitting the Nyquist plots.
Table IV. Cycling performance of MoS2/CNS based symmetric pseudocapacitors in 1 M Na2SO4. EIS data before and after 2000 cycling experiments were fitted with the Voigt equivalent circuit shown in Fig. 9e.
| h-MoS2/CNS | g-MoS2/CNS | |||
|---|---|---|---|---|
| Parameter | Before cycling | After cycling | Before cycling | After cycling |
| Rs / Ω | 0.78 ± 0.13 | 0.81 ± 0.32 | 0.37 ± 0.09 | 0.66 ± 0.23 |
| Q1 / mF.s(α−1) | 0.33 ± 0.17 | 0.54 ± 0.62 | 0.08 ± 1.22 | 0.17 ± 0.06 |
| n1 | 0.72 ± 0.21 | 0.63 ± 0.21 | 0.83 ± 0.27 | 0.92 ± 0.33 |
| Rct1 / Ω | 0.64 ± 0.11 | 2.44 ± 0.38 | 0.94 ± 0.01 | 4.63 ± 1.24 |
| Q2 / mF.s(α−1) | 0.25 ± 0.07 | 1.47 ± 0.14 | 0.12 ± 0.73 | 0.31 ± 0.07 |
| n2 | 0.87 ± 0.24 | 0.82 ± 0.17 | 0.82 ± 0.29 | 0.36 ± 0.27 |
| Rct2 / Ω | 1.64 ± 0.16 | 2.57 ± 1.24 | 4.71 ± 0.21 | 14.57 ± 2.28 |
| Phase angle | −80° | −80° | −78° | −78° |
| Knee frequency | 10 Hz | 10 Hz | 10 Hz | 1 Hz |
From the Bode plots (Figs. 9c, 9d), the phase angles are approximately −80°, which is lower than −90° for an ideal capacitance, confirming the pseudocapacitive behavior of the systems. The maximum frequency at which the supercapacitor exhibits its dominant properties is known as its knee frequency (fo, ϕ = 45°). The knee frequency describes the power capability of the supercapacitor; the higher it is, the faster the supercapacitor can be charged and discharged. From the Bode plots, it is observed that the fo values for the g-MoS2/CNS are 10 Hz (time constant = 0.1 s) before cycling and 1 Hz (time constant = 1 s) after the 2000th cycle. For the the h-MoS2/CNS, the fo value remained at 10 Hz even after the 2000th cycle, which confirms the high cycling stability of the the g-MoS2/CNS system.
Conclusions
This work describes the synthesis and electrocapacitive properties of two variants of mesoporous molybdenum disulfide (MoS2). The main difference in the hydrothermal synthesis of these materials is the use of either water or water/acetone mixture. The first variant is the graphene-like nanoflakes (g-MoS2) obtained with water, while the second is the hollow-like morphology (h-MoS2) obtained with water/acetone. Both materials have been modified with conductive carbon nanospheres and studied as symmetric pseudocapacitors in aqueous electrolyte (1 M Na2SO4 solution). The physico-chemical properties of these materials (morphology, surface areas and structural parameters) strongly correlate with their electrochemical capacitive properties. The g-MoS2 with higher surface area and larger pore size gave higher specific capacitance (183 F g−1), maximum energy density (9.2 Wh kg−1) and power density (2.9 kW kg−1). Sulfur is known for its poor cycling performance, which is the key problem in the realization of lithium-sulfur battery. Thus, one may speculate that the poor cycling performace of the g-MoS2 to be due to its slightly higher sulfur content than in the h-MoS2 (as intuitively provided by the EDX data). But this speculation must be properly investigated in the future to arrive at any foolproof conclusion. However, these findings have opened doors for future research on tuning the morphology of MoS2 materials for enhanced energy storage.
Acknowledgments
This work was supported by the University of the Witwatersrand (Wits) and CSIR, South Africa. The support of the Wits Materials for Energy Research Group (MERG) toward this research is gratefully acknowledged. Opinions expressed and conclusions arrived at are those of the authors and are not necessarily to be attributed to MERG. TNY Khawula thanks MERG for postgraduate bursary. K Raju thanks the CSIR for postdoctoral fellowships. CSIR is a partner in the CREATe-Network project being funded by the European Commission under the Marie Skłodowska-Curie Actions Research and Innovation Staff Exchange (RISE).