Abstract
Cells containing LiNixCoyMn1-x-yO2 (NCM) materials with very high nickel content suffer from cathode material degradation upon cycling, especially when operating these cells at higher voltage. While the cathode particle degradation is a problem other issues contribute to electrochemical performance loss. Graphite/LiNi0.8Co0.1Mn0.1O2 cells have been cycled to different upper cutoff voltages and investigated with electrochemical impedance spectroscopy (EIS), gas analysis with online electrochemical mass spectroscopy (OEMS), nuclear magnetic resonance (NMR) spectroscopy, gas chromatography with MS (GCMS) and inductively coupled plasma MS (ICP-MS). Increased gas evolution was observed when the upper cutoff voltage was increased from 4.2 to 4.6 V. An increase in O2 evolution upon cycling as well as an increase of CO2 upon increasing the voltage, have been observed. More electrolyte decomposition products are observed on the anode for cells cycled to higher voltage. An increased amount of nickel has been detected on the graphite electrode in accordance with an increased reaction of the cathode surface with the electrolyte leading to transition metal dissolution. Finally, an increase in carbonate solvent transesterification products has been observed.
Export citation and abstract BibTeX RIS

This is an open access article distributed under the terms of the Creative Commons Attribution 4.0 License (CC BY, http://creativecommons.org/licenses/by/4.0/), which permits unrestricted reuse of the work in any medium, provided the original work is properly cited.
The state-of-the-art cathode materials LiNixCoyMn1-x-yO2 (NCM) offer good specific capacities with a stable cycling behavior.1 However, the most used NCM LiNi1/3Co1/3Mn1/3O2 with a specific discharge capacity of ∼160 mAh g−1 does not fulfill requirements of contemporary Li-ion batteries, especially for the automobile market.2 Most NCM materials do not offer high capacity and have high cobalt content which is a problem in terms of the high cost and global availability of cobalt. Increasing the nickel content leads to higher capacity and lower cobalt content and is thus a logical modification of NCM cathodes.3 LiNi0.5Co0.2Mn0.3O2 (NCM523) is already commercialized and shows good cycling behavior with an increased capacity of ∼175 mAh g−1.2 NCMs with higher amounts of nickel, such as LiNi0.6Co0.2Mn0.2O2 (NCM622) or LiNi0.8Co0.1Mn0.1O2 (NCM811) have the capability of reaching higher specific capacities (∼190 and 200 mAh g−1, respectively).2 However, to significantly increase the capacity and the energy of cells containing these materials, the operating voltage also needs to be increased, resulting in new challenges. Increasing the nickel content above 60%, e.g. up to 80% for NCM811 (LiNi0.8Co0.1Mn0.1O2), especially in combination with increasing the upper cutoff voltage leads to degradation of the active material and significant capacity fading as previously reported.1,4–6 As it is well known for LiNiO2, cation mixing can take place in nickel rich NCMs due to the similar ionic radius of Li+ and Ni2+ ions.4 Hence, less electrochemically active lithium is available and the transformation toward the Fm3;−m phase is more likely. In any case, structural changes from layered (R3;−m) to disordered spinel (Fd3m) and even further to the rock salt phase (Fm3;−m) are observed upon cycling, mainly on the surface layers accompanied by less electrochemically active lithium being available which leads to capacity fading.7 The instability of NCMs at high potential or high state of charge (SOC), evidenced by O2 evolution from the NCM surface and electrolyte oxidation (marked by CO2 and CO evolution) has been ascribed in the literature to three different possible mechanisms: i) to the presence of reactive Ni4+, leading to O2 evolution when being reduced to more stable Ni2+;1 ii) to the release of reactive singlet oxygen at ca. 80% SOC (occurring at different potentials, depending on the nickel content of the material) and its reaction with the electrolyte; or, iii) to the reaction of electrolyte on the NCM surface, due to a lowering of the Fermi level into the O-p band with increasing nickel content.8–11 In addition, gas evolution (CO2) caused by decomposition of residual lithium compounds on the material's surface can take place.4 Upon delithiation and lithiation there is a substantial change of the c axis of NCM causing high strain in the material and leading to micro cracks in the particles.1 The described problems of the cathode material lead to cell failure not only due to the cathode material itself, but also by increased reactions with the electrolyte which have an influence on the electrolyte degradation and further reactions with the anode solid electrolyte interphase (SEI). Operating the cells under extreme conditions, such as increasing the cutoff voltage, accelerates and increases the detrimental processes.12,13
This study focuses on the effect of high cutoff voltage for Graphite/NCM811 cells. The decomposition reactions in the electrolyte are investigated and the interactions of different reactions are discussed. Since one of the main drawbacks of nickel rich NCMs at high voltages is gas evolution, the gas evolution occurring upon cycling has been investigated. These observations are correlated to the electrochemical cycling, changes to the electrolyte and the deposition of reaction products on the anode surface. Both the composition of the anode SEI and the presence of transition metal deposition on the anode have been investigated. Furthermore, the degradation reaction of the electrolyte itself, namely the reaction of the carbonate solvents (transesterification) has been investigated. While the initial goal of the investigation was to understand the correlation between carbonate solvent transesterification and gas evolution to utilize transesterification products as early indicator for long term gas evolution problems, the correlation between transesterification and gas evolution is unclear.
Experimental
Cell building
NCM811 electrodes and graphite electrodes were provided by a commercial supplier with electrode compositions of 93 wt% NCM811, 3 wt% conductive carbon Super C65, and 4 wt% polyvinylidene difluoride (PVDF) for NCM811 electrodes and 95.7 wt% graphite, 0.5 wt% conductive carbon Super C65, and 3.8 wt% binder (sodium carboxymethyl cellulose and styrene butadiene rubber) for Graphite electrodes. All electrodes were dried at 110°C for 48 h under vacuum.
Cells were assembled in an Ar filled glove box with ≤0.1 ppm H2O. For all electrochemical tests 2032 coin cells were built. Three layers of separator consisting of Celgard 2500, Whatman GFD and another layer of Celgard 2500, were used to minimize damage of the electrode surface by removing the separator for ex-situ analysis of the electrodes.
Full cells have been prepared with 1.54 cm² cathode electrodes (∼10.3 mgNMC/cm²) and 1.77 cm² anode electrodes (7.1 mgGr/cm²). The separators were drenched with 90 μL LP57 (1M LiPF6 in Ethylene Carbonate (EC): Ethyl Methyl Carbonate (EMC) 3:7 (v:v)) as electrolyte.
Electrochemical investigation
All electrochemical investigations were conducted at 25°C.
Galvanostatic cycling was performed on an Arbin BT2040 battery cycler at C/20 (1 cycle), C/10 (2 cycles) and, C/5 (2 cycles) for formation between 4.2 or 4.6 V and 3.0 V, followed by 100 cycles at C/2 between 4.2 or 4.6 V and 3.0 V at CC (reference always toward nominal capacity of 150 mAh g−1). In addition, symmetrical cells of NCM811/NCM811 or graphite/graphite cells were investigated. Graphite/NCM811 cells with the same active material mass loading were cycled for one cycle with the same protocol, then the cell was disassembled in inert atmosphere, electrodes were washed once with EMC and dried in the glove box atmosphere. Afterwards, symmetrical cells were built with the same setup as described for full cells. Potentiostatic electrochemical impedance spectroscopy (EIS) of full cells and symmetrical cells was performed on a Biologic VSP between a frequency range of 300 kHz and 10 mHz and a sinusoidal amplitude of 10 mV. EIS measurements were repeated two times with a 30 min OCV step in between each measurement. The measurements were conducted in triplicate and are comparable, so only one EIS measurement is provided.
Ex-situ investigation of electrodes
After cycling, cells were disassembled in an Ar filled glove box and harvested electrodes were rinsed three times, each time with 500 μL EMC. Graphite electrodes were investigated by X-ray photoelectron spectroscopy (XPS: Thermo Scientific, KAlpha) with a focused monochromatized Al Kα radiation beam (hυ = 1486.6 eV) under ultrahigh vacuum (8.1 × 10⁻⁸ Pa) and a constant pass energy of 15 eV. The samples were transferred from the Ar glove box to the XPS chamber via an air free transfer vessel. The spectra were corrected to the hydrocarbon peak at 284.8 eV and a fitting was performed with the program Thermo Avantage 5.975.
Harvested graphite electrodes were dissolved in 10 mL of aq 2% HNO3 solution. ICP-MS measurements were performed with an iCAP Q ICP-MS instrument with He KED interference reduction to investigate the deposition of transition metals on the graphite electrode.
GCMS
The preparation of GCMS samples was based on the procedure described by Petibon et al.14 Cells were opened in an Ar filled glove box and transferred into a centrifuge vial. All cell parts were centrifuged for 5 min. Then cell parts were removed so that only the electrolyte remained in the centrifuge vial. CH2Cl2 and water were added and mixed for 5 min. After 10 min the aqueous phase was removed and the CH2Cl2 phase was measured by GCMS (Shimadzu, GCMS-QP2020). LP57 was measured for three times finding a variance for EC and EMC of 2.3% and 4.3%, respectively. However, the samples after cycling were measured only once due to the low amount of residual electrolyte in the separator.
Gas analysis
Online electrochemical mass spectrometry (OEMS) was performed on Graphite/NCM811 full cells for the first two cycles. Graphite electrodes were composed of 95 wt% graphite (T311, SGL Carbon, Germany) and 5 wt% PVdF binder (Kynar HSV 900, Arkema, France), and NCM811 electrodes cast on a stainless steel mesh were composed of 93 wt% active material, 3 wt% conductive carbon Super C65 (Imerys, Switzerland) and 4 wt% PVdF. Electrodes were punched to 15 mm and 14 mm diameter for graphite and NCM811, respectively and electrodes were pressed with 2.5 t for 20 sec. The anode and cathode loadings were 10.6–11.4 mgGraphite/cm2 and 13.9–14.3 mgNCM/cm2, respectively. The OEMS measurement was conducted in a custom-made cell consisting of 316Ti stainless steel (see Tsiouvaras et al for details).15 Cathode, two Celgard H2013 separators drenched with 120 μL LP57 and the anode were stacked in the cell and compressed by a compression spring (316 SS, Lee Springs). After assembling and sealing the cell was placed in a 25°C climate chamber and connected via a crimped capillary leak (Vacuum Technology Inc.) to a mass spectrometer (Pfeiffer Vacuum QMA 410), permitting a constant flow of ∼1 μL min-1 from the cell head space to the closed cross-beam ionization source of the mass spectrometer equipped with a secondary electron multiplier. First an OCV step of four hours was applied (not shown here) and then the cells were cycled galvanostatically for 2 cycles with a constant current rate of C/5 between 3.0–4.2 V or 3.0–4.6 V, respectively.
Results and Discussion
The cycling performance of Graphite/NCM811 cells at room temperature is provided in Figure 1. At the lower operating cutoff voltage of 4.2 V, Graphite/NCM811 cells cycle stably over 100 cycles with a capacity retention of ∼100% (in comparison to the 6th cycle which corresponds to the first cycle at the current rate of C/2, Figure 1a). Cycling a graphite/NCM811 cell up to a higher upper cutoff voltage of 4.6 V results in an initially higher specific discharge capacity of 221 mAh g−1 in the first cycle (C/20) and 195 mAh g-1 in the 6th cycle (C/2). However, the increased capacity is accompanied by significant fading upon cycling with a capacity retention of only 89% after 100 cycles, corresponding to a discharge capacity of 174 mAh g-1 which is only 9 mAh g-1 higher than graphite/NCM811 cells cycled to 4.2 V. This behavior is also reflected in the differential capacity plot (Figure 1b). During the first cycle at a low C-rate a significant difference is not observed for cells cycled to the two different cutoff voltages (the gray and the orange curve overlap). However, after prolonged cycling a voltage shift can be observed for cells cycled to both 4.2 and 4.6 V. Cycling cells to a cutoff voltage of 4.2 V leads to a slight voltage shift of the highest potential peak from 4.10 to 4.05 V. However, after cycling to the higher voltage, 4.6 V, a greater shift is observed from 4.10 to 3.98 V consistent with a larger change in the material.5,16

Figure 1. Electrochemical performance of Graphite/NCM811 cells cyced at different cutoff voltages of 4.2 and 4.6 V, respectively. a) Galvanostatic cycling at a C-rate of C/2 after formation cycles at C/20 (1), C/10 (2-3) and C/5 (4-5), b) differential capacity plots of the 1st and 100th cycle.
In addition to the voltage fading of the cells cycled to a higher cutoff voltage, the full cell impedance of the cells also show an increased overall impedance upon cycling (Figures 2a, 2b). After the first cycle, an increase in the full cell impedance (by 33 Ω) is observed when the cutoff voltage is increased to 4.6 V, which primarily originates from the charge transfer resistance (CTR) of the electrodes. After 100 cycles, the full cell impedance of cells cycled to 4.6 V is notably increased (by 197 Ω), presumably due to an increase of the CTR of the electrodes. In order to identify the source of the impedance increase, symmetrical cells were built from electrodes extracted after one constant current cycle in full cells (after formation) to the two different cutoff potentials (Figures 2c and 2d).17,18 It is important to note that the impedance values of EIS measurements of symmetrical cells are increased by roughly a factor of two, since two electrodes are being monitored and that the values are not directly comparable with the full cells since disassembling and reconstruction of the cells could also contribute to impedance increases. However, insight into the source of impedance growth as a function of cutoff voltage can be obtained. The CTR of NCM811 symmetrical cells after one cycle is increased by 76 Ω upon increasing the cutoff voltage (Figure 2c), while the CTR of graphite symmetrical cells is almost the same (Figure 2d), indicating that the cathode side is primarily affected upon cycling at an elevated cutoff voltage, in agreement with the observations of Gilbert et al. for graphite/NCM523 cells.19 NCM materials with very high nickel content, such as NCM811 undergo especially significant structural changes at higher voltage, mainly at the surface layer of the material, such as the phase transition from layered to rock salt phase. In addition, cracks can occur upon cycling and as a consequence a loss of contact takes place. However, the electrolyte reactions with the cathode surface also play an important role in cell cycling stability.1,6
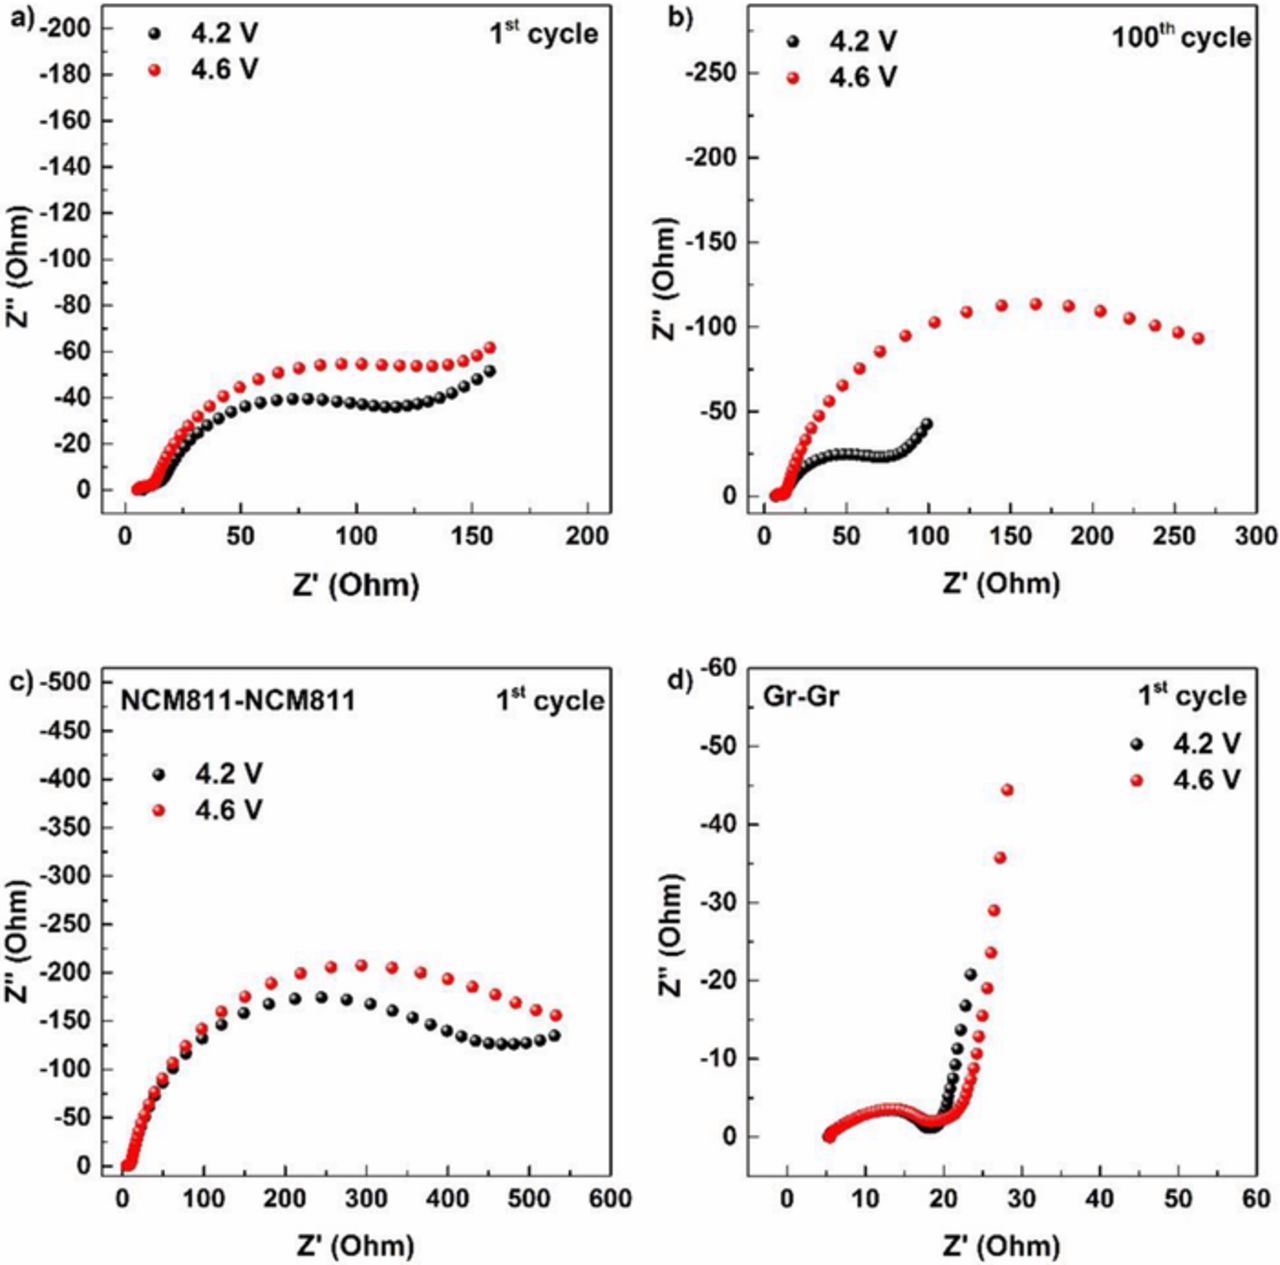
Figure 2. Full cell EIS of Graphite/NCM811 cells cycled at 4.2 and 4.6 V after a) the first and b) the 100th cycle. EIS on symmetrical cells after the first cycle (following formation) to 4.2 and 4.6 V of c) harvested NCM811 and d) harvested Graphite electrodes).
It is well known that nickel rich NCM suffers from gas evolution upon cycling, especially when exceeding an SOC of ca. 80%, which occurs at lower potentials for nickel rich NCMs compared to NCMs with a lower nickel content, concomitant with electrolyte decomposition and capacity fade.9,10 Online electrochemical mass spectroscopy (OEMS) has been conducted to determine the effect of gas evolution on the electrochemical behavior.
The voltage and gas evolution profiles of Graphite/NCM811 cells upon the first two cycles with an upper cutoff voltage of 4.2 and 4.6 V are provided in Figures 3a and 3b, respectively. Upon the first charge at lower voltages, ethylene gas (C2H4) and CO are formed for both cells due to the reduction of ethylene carbonate (EC) and ethyl methyl carbonate (EMC), as previously reported.20 As the voltage is increased, CO2 evolution initiates from the NCM cathode material.9 Also, the transesterification products of EMC, namely DMC and DEC (here monitored by their characteristic m/z signals 62 and 63), are observed (see lower panels in Figure 3).21 As expected, at voltages below ∼3.8 V, comparable quantities of gases and transesterification products are formed in both experiments (Figures 3a and 3b). As the cell voltage is increased in the first cycle, an increase in the concentrations of CO and CO2 are observed for cells cycled to both cutoff voltages due to the oxidation of the electrolyte triggered by NCM surface impurities.22 However, more CO2 is formed when the cutoff voltage is increased to 4.6 V. In addition, beyond 4.6 V, O2 evolution is observed for the cell with a cutoff voltage of 4.6 V, consistent with previous OEMS measurements on NCM811.11 During discharge, CO2 is consumed on the anode, resulting in a slight decrease in the CO2 concentration. During the second cycle, CO2 is formed again at higher voltage. However, during the second cycle discharge, the CO2 is only consumed for cells cycled to the lower cutoff voltage of 4.2 V, while the CO2 concentration is stable for cells cycled to a cutoff voltage of 4.6 V. As discussed by Jung et al., oxygen release causes chemical oxidation of the electrolyte and increases the CO/CO2 evolution at lower potentials.9 However, oxidation of the electrolyte is increased when the cutoff voltage is increased, hence a correlation to the higher cutoff voltage can be made here. Additionally, the H2 evolution during cycling is higher for cells cycled to 4.6 V, supporting the reduction of electrolyte oxidation products (besides CO2) on the anode (in agreement with Sasaki et al).23 For both cutoff voltages, DMC and DEC are formed upon cycling, although there is not a clear relationship between transesterification and the cutoff voltage. Nevertheless, during the initial charge the concentration of the transesterifications products is increased until the cell reaches the cutoff potential, at either 4.2 or 4.6 V. After the first charge, less DMC and DEC are continuously formed. To develop a better understanding of the transesterification reaction of Graphite/NCM811 cells, additional analysis of the electrolyte extracted from cycled cells has been conducted via GCMS analysis after the first, second and 100th cycle.

Figure 3. OEMS analysis of Gr/NCM811 cells with LP57 electrolyte upon the first two cycles at C/5 with a cutoff voltage of 4.2 and 4.6 V.
The GCMS chromatograms of fresh LP57 electrolyte and the electrolyte extracted from cells cycled for 100 cycles with an upper cutoff voltage of 4.2 and 4.6 V, respectively, are provided in Figure 4a. The cycled electrolyte contains peaks characteristic of DMC, DEC and oligo-carbonates. DMC and DEC are formed by the transesterification reaction of EMC while oligo-carbonates are formed from the transesterification of EC. Initially, lithium alkoxides are formed at lower voltages at the anode along with the formation of CO, as detected by OEMS.21 Upon generation of alkoxides, the alkoxides initiate the transesterification reactions.23–27 The formation of the DMC and DEC transesterification products are observed after the first cycle, but their concentration increases with additional cycling. The increase of DMC and DEC after the first and second formation cycle (between 3.0–4.2 or 4.6 V) and after the 100th cycle to upper cutoffs of either 4.2 or 4.6 V at C/2 is depicted In Figure 4b. It is clear that the concentration of DMC and DEC is increasing upon cycling, whereby the largest increase is observed after the first cycle. Nevertheless, the concentration appears to be continuing to increase after 100 cycles for cells cycled to both cutoff voltages. During the first and second cycle, the evolution of DMC and DEC are comparable for both upper cutoff voltages, suggesting the initial reaction toward the transesterification products is not dependent on the upper cutoff voltage. However, after 100 cycles, the cells cycled to the upper cutoff voltage of 4.6 V have slightly increased concentrations of DMC and DEC. The same trend can be observed for the formation of oligo-carbonates. Thus, the upper cutoff voltage has a clear effect on the generation of transesterification products upon additional cycling.
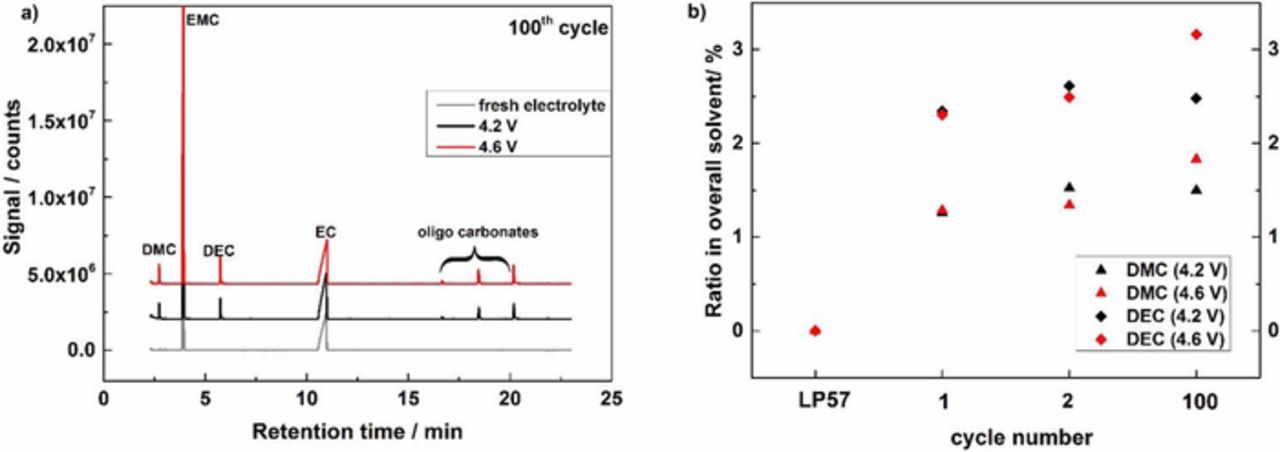
Figure 4. a) GCMS chromatogram of fresh LP57, and LP57 extracted from full cells after 100 cycles with a cutoff voltage between 4.2-3.0 V and 4.6-3.0 V; b) Evolution of DMC and DEC after 1,2 and 100 cycles in LP57.
To investigate the effect of the upper cutoff voltage on the graphite and NCM811 electrodes, XPS spectra have been acquired for electrodes extracted after cycling.28 The XPS spectra of the NCM811 cathodes are very similar suggesting little deposition of electrolyte decomposition products on the surface of the cathode and are thus not provided. The XPS fitting results of fresh and cycled graphite electrodes after 100 cycles are summarized in Figure 5. The C1s, F1s and O1s element spectra of the graphite electrodes before and after 100 cycles with an upper cutoff voltage of 4.2 and 4.6 V are provided. The C1s core peaks contain peaks related to graphite (284.2 eV) and the hydrocarbon peak/SBR binder (284.8 eV) and the CMC binder (286.9 and 288.5 eV).29,30 After cycling, the peak at 284.2 eV is no longer visible, indicating that a surface layer was formed covering the graphite peak. A peak at ∼282.5 eV characteristic of Li2C2 for the cells cycled to 4.2 V but not the cells cycled to 4.6 V after 100 cycles.31,32 The hydrocarbon peak, as well as, the peak at 288.5 eV decrease in agreement with covering the graphite surface by an SEI. The peak at 286.9 eV decreases upon cycling consistent with coverage of the CMC binder upon cycling. In addition, -CO3 species (∼289.8 eV) are observed after cycling, consistent with a thickening of the SEI. The intensity of the peaks characteristic of -CO2 and -CO3 are increased when the upper cutoff voltage is increased to 4.6 V, consistent with a thicker SEI for cathodes cycled to higher voltages. For fresh graphite, as expected, no fluorine is found on the electrode surface. However, after cycling, the F1s core peaks are observed and are consistent with the presence of LiF (684.9 eV) and LixPFyOz (687.0 eV). After 100 cycles significantly more Li-F is observed for the cell cycled to 4.6 V consistent with the generation of a more resistive layer upon cycling to the higher cutoff voltage. The O1s core peaks of fresh graphite are dominated by peaks characteristic of the binder CMC/SBR at 531.3 and 533.0 eV. Upon cycling, the peaks shift slightly to higher binding energy and the intensity of the C=O peak (531.3 eV) is increased consistent with the deposition of C=O containing species on the graphite surface. Overall after 100 cycles, the surface layer is thicker for the electrode cycled to 4.6 V. P2p core peaks (Figure 5) indicate that phosphorous species, namely LixPFyOz (∼134 eV) and LiPF6 (136.9 eV) are present in the surface layer. In addition, the appearance of Ni2p core peaks suggests that nickel species from the cathode electrode are being deposited on the anode after cycling. These results are confirmed by ICP-MS measurements. After the first cycle, the quantity of Ni is low (2 ppm) for the cell cycled to 4.2 V while it is much higher for the cell cycled to 4.6 V (88 ppm). After 100 cycles the amount of nickel increases dramatically to 111 ppm and 610 ppm for the cells cycled to 4.2 and 4.6 V, respectively.

Figure 5. C1s, F1s, O1s, Ni2p and P2p core peaks of fresh and cycled graphite electrodes after 100 cycles at C/2 (electrodes were cycled in Gr/NCM811 cells with LP57 as electrolyte with an upper cutoff voltage of 4.2 and 4.6 V, respectively). Fitting of the XPS data was only accomplished for C1s, F1s and O1s since the overall intensity of Ni2p and P2p would not lead to reliable results.
Along with the higher capacity fade, an increase in the impedance originating from the cathode has been observed even after the first cycle (Figure 2c), which is in agreement with observations of Gilbert et al. on Graphite/NCM523 cells and which likely originates from a more resistant surface film generated on the cathode upon cycling as described by Schipper et al.1,19 In agreement with those observations, more CO2 from electrolyte oxidation as well as more O2 evolution is observed when the upper cutoff voltage is increased to 4.6 V, either caused by the presence of reactive Ni4+ species, by the evolution of reactive singlet oxygen at high SOC, or by a surface reaction with lattice oxygen.1,9,8,10,11 The resulting electrolyte oxidation products also affect the graphite anode. Not only are more -CO3, -CO2 and LiF species observed by XPS on the graphite anode when the upper cutoff voltage is increased to 4.6 V, but also significantly higher quantities of nickel are observed by ICP-MS, confirming that nickel dissolution which is associated with O2 evolution is increased upon cycling to higher voltage.
In addition, an increase of transesterification products has also been observed upon cycling when the upper cutoff voltage was increased to 4.6 V. While the reactions at the anode at low voltage leading to alkoxide formation are independent of the upper cutoff voltage, the generation of DMC and DEC and related oligo-carbonate formation increases as the upper cutoff voltage is increased. During the first charge the quantity of DMC and DEC generated are similar for both upper cutoff voltages. While the primary generation of DMC and DEC occurs during the first charge, a second slower reaction takes place upon additional cycling (Figure 3). This is reflected in the GCMS results. However, upon additional cycling transesterification products continue to be generated. The generation of DMC, DEC and oligo-carbonates is greater for cells cycled to 4.6 V indicating that the upper cutoff voltage influences the transesterification upon further cycling. Nevertheless, it is not clear if there is a direct correlation between gas evolution, transition metal dissolution and transesterification reactions.
Conclusions
Cycling Graphite/NCM811 up to a higher cutoff voltage of 4.6 V instead of 4.2 V not only leads to higher initial capacity, but also to significant capacity fade upon cycling. After only 100 cycles, cells cycled to 4.6 V have only slightly higher capacities than cells cycled to 4.2 V. It has been reported that NCM materials with high nickel content react more strongly with the electrolyte for a given upper cutoff potential, concomitant with gassing and transition metal dissolution;1,16,9–11,33,34 furthermore, for a given upper cutoff potential, nickel rich NCMs undergo a larger volume expansion/contraction and therefore exhibit more particle cracking.35 In this report, the gassing reactions along with the reactions with the electrolyte and the effect on the anode have been investigated when NCM811 is cycled to an elevated upper cutoff potential, 4.6 V.
It has been shown that the lower cycling stability of NCM811 is not only related to the instability of the cathode material itself, but that the effects of the cathode when charged to higher voltage cause changes to other parts of the cell upon cycling. Cycling to a higher cutoff potential (4.6 V) results in an increase of the impedance of the cathode along with an increase in O2, H2 and CO2 evolution. In addition, more nickel dissolution from the cathode which is subsequently deposited in the anode SEI is observed. The higher cutoff voltage also leads to slightly increased transesterification reactions upon longer term cycling. Within the scope of this investigation, a direct correlation between transesterification and gas evolution upon cycling cells at elevated upper cutoff voltage remains unclear.
Acknowledgment
The authors would like to thank the BASF SE Scientific Network on Electrochemistry and Batteries for financial support as well as for the material supply.
ORCID
Sophie Solchenbach 0000-0001-6517-8094
Brett L. Lucht 0000-0002-4660-0840