Abstract
In the present work, a fast current-controlled polarization was proposed to examine a rapid cathodic process on anodized titanium substrates. Anodic oxide films with different thicknesses and structures were produced on titanium by anodization in a phosphate buffer solution at various voltages. In the fast current-controlled polarization, a triangle form of cathodic current with a maximum current density of 100 μA cm−2 was applied to the anodized titanium substrates in a buffer solution, and the resulting variation in potential was monitored. The potential for all the anodized substrates shifted sharply in less noble direction and then recovered back to the original value. The potential variations were analyzed, assuming that the applied current was consumed as charge-discharge current and oxygen reduction current. The oxygen reduction current behavior between the titanium substrates anodized at low voltages and those anodized at high voltages was different.
Export citation and abstract BibTeX RIS

This is an open access article distributed under the terms of the Creative Commons Attribution 4.0 License (CC BY, http://creativecommons.org/licenses/by/4.0/), which permits unrestricted reuse of the work in any medium, provided the original work is properly cited.
Titanium and its alloys have been used in diverse fields such as chemical plants and biomaterials due to their excellent mechanical properties and corrosion resistance. The corrosion resistance of titanium and its alloys in aqueous environments is attributed to the passive film on their surfaces. Therefore, the structures and properties of passive films, as well as anodic oxide films, formed on the surface of titanium in various environments, have been extensively examined. Leitner et al. examined photoelectrochemical responses on passivated titanium in a sulfuric acid solution at various potentials ranging between 4 and 105 V.1 They found four different types of behaviors, depending on the thickness of the passive film, in photocurrent spectra and the potential dependence of the photocurrent. Schneider et al. investigated the effect of crystallographic orientation on the dielectric and semiconductive properties of anodic oxide films using electrochemical impedance spectroscopy in a microcapillary cell and concluded that under the investigated conditions, the crystallographic orientation of the titanium substrate had no significant influence on the thickness, relative permittivity, or donor density of anodic oxide films.2 Ohtsuka et al. carried out an ellipsometric study of anodic oxide films in various solutions, and reported that the films grew at a similar rate of 2.4–2.8 nm V−1 in all the solutions examined up to 7.5 V.3 Furthermore, they found that at potentials higher than 7.5 V, the breakdown of the films happened, resulting in the formation of thick films. In addition, Ohtsuka et al. examined the crystallinity of anodic oxide films formed in acidic sulfate and neutral phosphate solutions.4
Oxygen reduction is one of the most important reactions in the corrosion process. Therefore, the oxygen reduction reaction on metals and alloys, the surface of which is covered with an oxide film, has been extensively studied, especially for iron and stainless steels.5–12 For titanium, Okada carried out electrochemical measurements in sulfuric acid solutions with different amounts of dissolved oxygen and reported that the corrosion potential shifted in a less noble direction, and the potential plateau for the diffusion-limiting current of oxygen reduction became narrow with decreased dissolved oxygen content.13 Although during fast breakdown and repair of surface oxide film on metals, oxygen reduction is found to occur extremely fast, to the best of our knowledge, such a rapid cathodic process has not been reported.
In the present work, we propose an approach to investigate rapid oxygen reduction reaction, i.e., a fast current-controlled polarization, and show one example of its application to anodized titanium substrates in a phosphate buffer solution.
Experimental
The material was pure Ti sheet (purity: 99.5%) with a thickness of 2 mm. A rectangular coupon (10 mm × 10 mm × 2 mm) was cut from the sheet. After an electrical connection was made to the larger surface of the coupon by a lead wire, the coupon was mounted in an epoxy resin. Prior to electrochemical measurements, the specimen surface was ground with SiC abrasive papers up to #2000, and then mirror-finished with a diamond paste of 1/4 μm. After the polishing process, the specimens were ultrasonically cleaned in methanol and deionized water, successively, for 5 min. each.
To grow anodic oxide films on the specimen surface, the specimen was anodized for 1 h in a 0.1M phosphate buffer solution with a pH of 6.1 at different voltages ranging from 3 V to 50 V. The anodization was carried out in a two-electrode system with a Pt counter electrode. After the anodization, the specimen was immersed for 1 h in a phosphate buffer solution where the dissolved oxygen concentration was controlled at 0.1 ppm, and then subjected to fast current-controlled polarization. In the fast current-controlled polarization, a triangular form of cathodic current was applied to the anodized specimen in the phosphate buffer solution, which resulted in the variation of potential. Applied cathodic currents used in the present work are schematically presented in Fig. 1. Electrochemical impedance measurements were also performed on the anodized specimen to examine its capacitance under the same conditions as the fast current-controlled polarization experiments. A sinusoidal potential wave with an amplitude of 10 mV was applied to the anodized specimens in the frequency range from 10 kHz to 100 mHz. The impedance was measured at various potentials. The fast current-controlled polarization and the impedance measurements were performed in a three-electrode configuration electrochemical cell with a Ag/AgCl reference electrode and a Pt counter electrode.
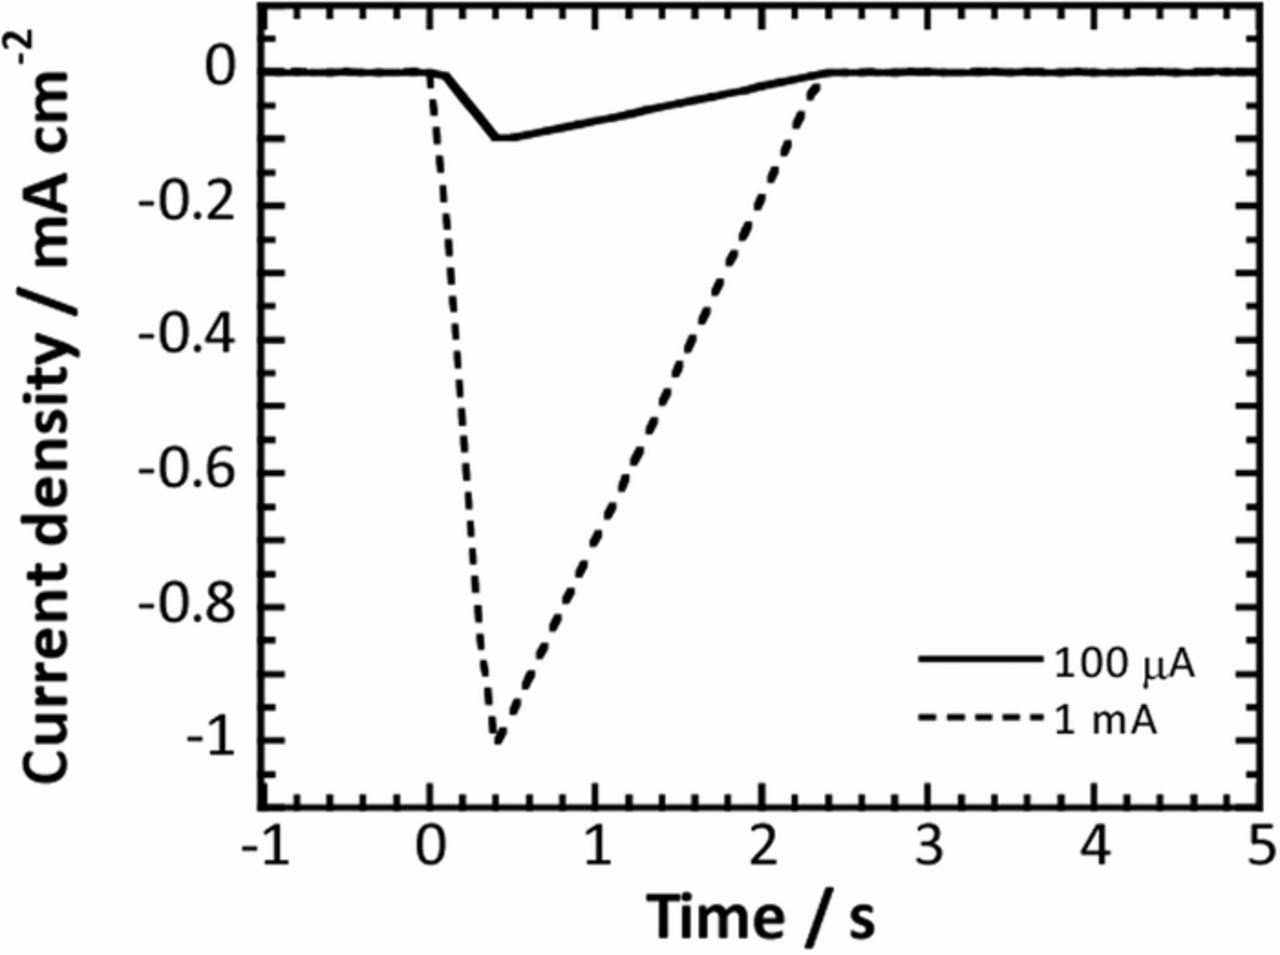
Figure 1. Current profiles used in the fast current-controlled polarization. The maximum cathodic current densities in the profiles were set to 100 μA cm−2 and 1 mA cm−2.
Results and Discussion
Figure 2a shows an example of potential variation within the first 5 s in the fast current-controlled polarization of titanium substrate anodized at 10 V in 0.1M phosphate buffer solution. The current profile used in this current-controlled polarization experiment is also included in the graph. The applied cathodic current was drastically increased up to 100 μA cm−2, and then linearly decreased over time. As observed, the potential shifted sharply in a less noble direction just after the cathodic current was applied to the specimen. After the drastic potential shift, the potential gradually recovered with time and finally approached the original value as shown in Fig. 2b. In the present work, the applied cathodic current, IA, was assumed to be consumed as the charge-discharge current, IC, and the oxygen reduction current, IR, i.e., the reduction current of the anodic oxide film was ignored. The charge-discharge current was calculated from the time derivative of the electric charge, Q, as shown in Equation 1.
![Equation ([1])](https://content.cld.iop.org/journals/1945-7111/166/11/C3443/revision1/d0001.gif)
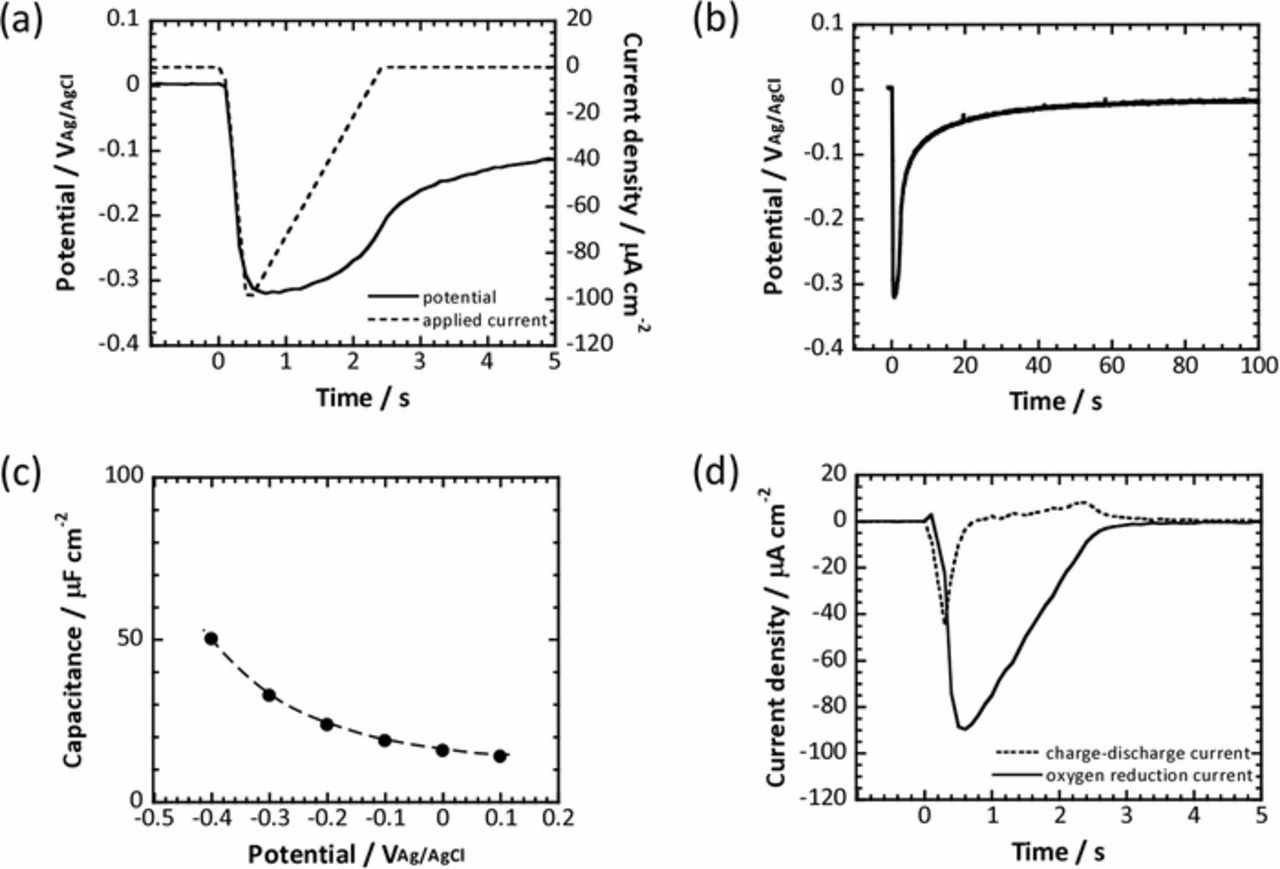
Figure 2. Potential variation (a) during the first 5s and (b) for 100 s of the fast current-controlled polarization in 0.1M phosphate buffer solution for the titanium substrate anodized at 10 V. The applied current profile in the fast current-controlled polarization is also included in (a). (c) Potential dependence of capacitance obtained for the titanium substrate anodized at 10 V. The dashed line in the graph is determined by curve-fitting of obtained capacitance data. (d) Charge-discharge current and oxygen reduction current transients obtained in the fast current-controlled polarization of the titanium substrate anodized at 10 V.
For the calculation, the potential dependence of the capacitance was required. Therefore, capacitance was evaluated by electrochemical impedance spectroscopy. The variation in the capacitance for the titanium substrate anodized at 10 V is presented in Fig. 2c. The impedance measurements were performed in approximately the same potential region as that observed in the fast current-controlled polarization shown in Fig. 2b, that is, from 100 mVAg/AgCl to −400 mVAg/AgCl at intervals of 100 mV. The dotted line in Fig. 2c was estimated by the approximation of the obtained capacitances. The charge-discharge current, Ic, was estimated by using the capacitances as well as the potential variation, based on Equation 1. For this estimation, we converted the potential dependence of capacitance shown in Fig. 2c to time dependence of capacitance based on time dependence of potential shown in Fig. 2b. The dc/dt was obtained from the time dependence of capacitance. On the other hand, the oxygen reduction current, IR, can be obtained by subtracting the charge-discharge current, IC, from the applied cathodic current, IA, and is shown in Fig. 2d with the charge-discharge current obtained for the titanium substrate anodized at 10 V. Clearly, charge-discharge current increased first, and thereafter the oxygen reduction current also increased. After the currents reached their maximums, they decreased over time. Furthermore, the electric charge from the oxygen reduction current was apparently larger than that from the charge-discharge current.
In the present work, fast current-controlled polarization was carried out for anodized titanium substrates at various voltages in a 0.1M phosphate buffer solution. The potential variations within the first 5 s of the fast current-controlled polarization are summarized in Fig. 3a. The potential variations were obviously different depending on the anodized titanium substrates, that is, the potential became less noble for the titanium substrates anodized at lower voltages. In addition, the recovery of potential to the original value was delayed for the anodized substrates at lower voltages, especially substrates anodized at 3 V and 5 V. As described above, the oxygen reduction current for the anodized titanium substrates at the various voltages was also calculated by using capacitance data obtained for each substrate shown in Fig. 3b and is presented in Fig. 3c. The transient of the oxygen reduction current was similar, independent of the anodization voltage, except that the oxygen reduction current was relatively smaller for the anodized titanium substrates at 3 V and 5 V. The variations in the potential and oxygen reduction current were summarized as a quasi-polarization curve. Figure 4 shows the quasi-polarization curves of the oxygen reduction reaction obtained from the fast current-controlled polarization of all the anodized titanium substrates examined. It is clear that the polarization behavior is categorized as two different types, that is, the current-potential curves obtained for the anodized titanium substrates at potentials ranging from 8 V to 50 V exhibited linear dependence, whereas the current-potential curves for the anodized substrates at 3 V and 5 V showed a wide loop where the oxygen reduction current increased with decreasing potential, then sharply decreased during a slight increase in potential. After the sharp decrease of the current, the current continued to decrease gradually with the increase in potential. Although the shape of the polarization curves in Fig. 4 was different depending on the anodized titanium substrates, the maximum oxygen reduction current was similar for all the anodized substrates. In the following, more details are examined for the anodized titanium substrate at 5 V, which exhibits a wide loop in the quasi-polarization curve and the anodized substrate at 10 V, which shows linear dependence.
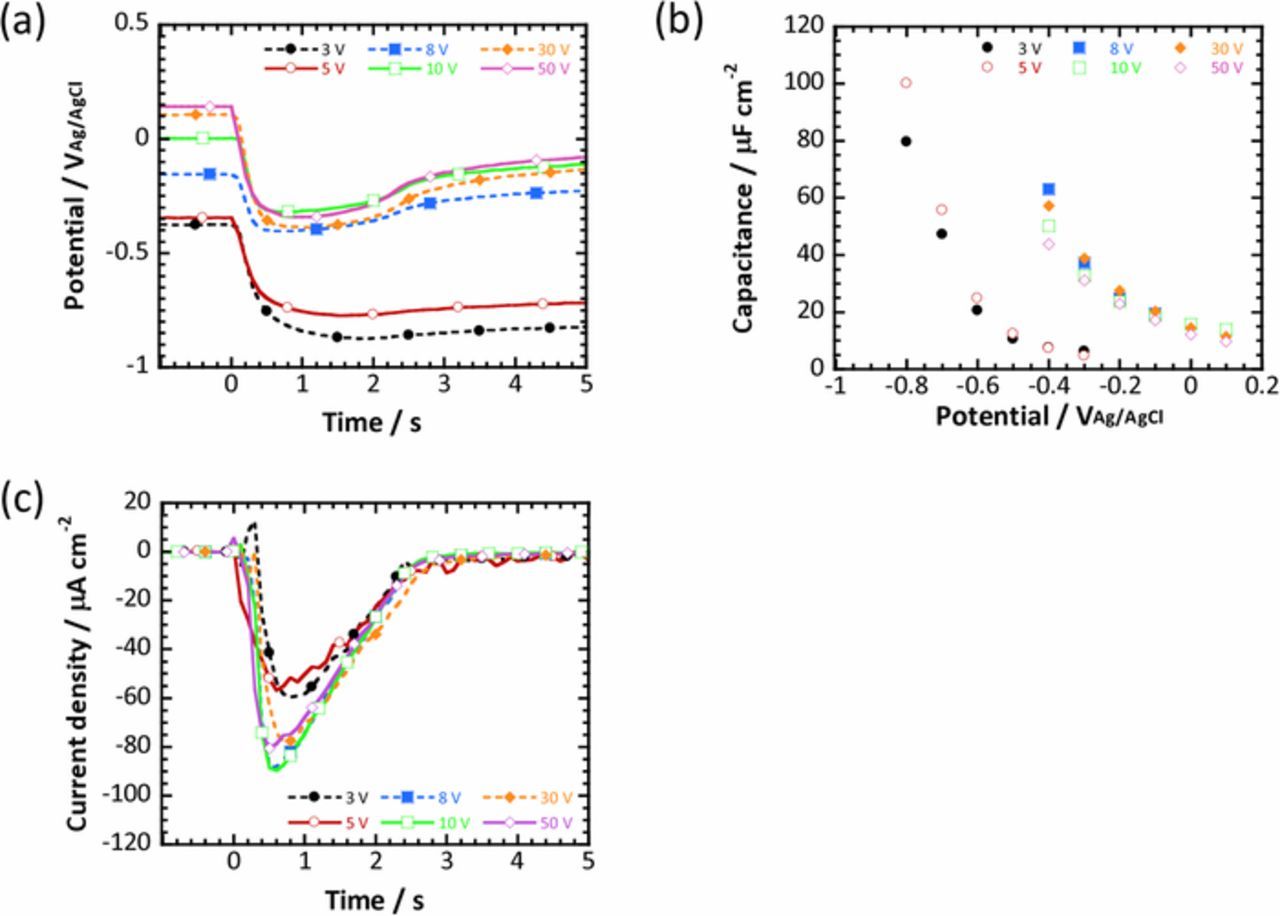
Figure 3. (a) Potential variation during the first 5 s of the fast current-controlled polarization for titanium substrates anodized at various voltages. (b) Potential dependence of capacitance obtained for the titanium substrate anodized at various voltages. (c) Oxygen reduction current profiles obtained for the anodized substrates.
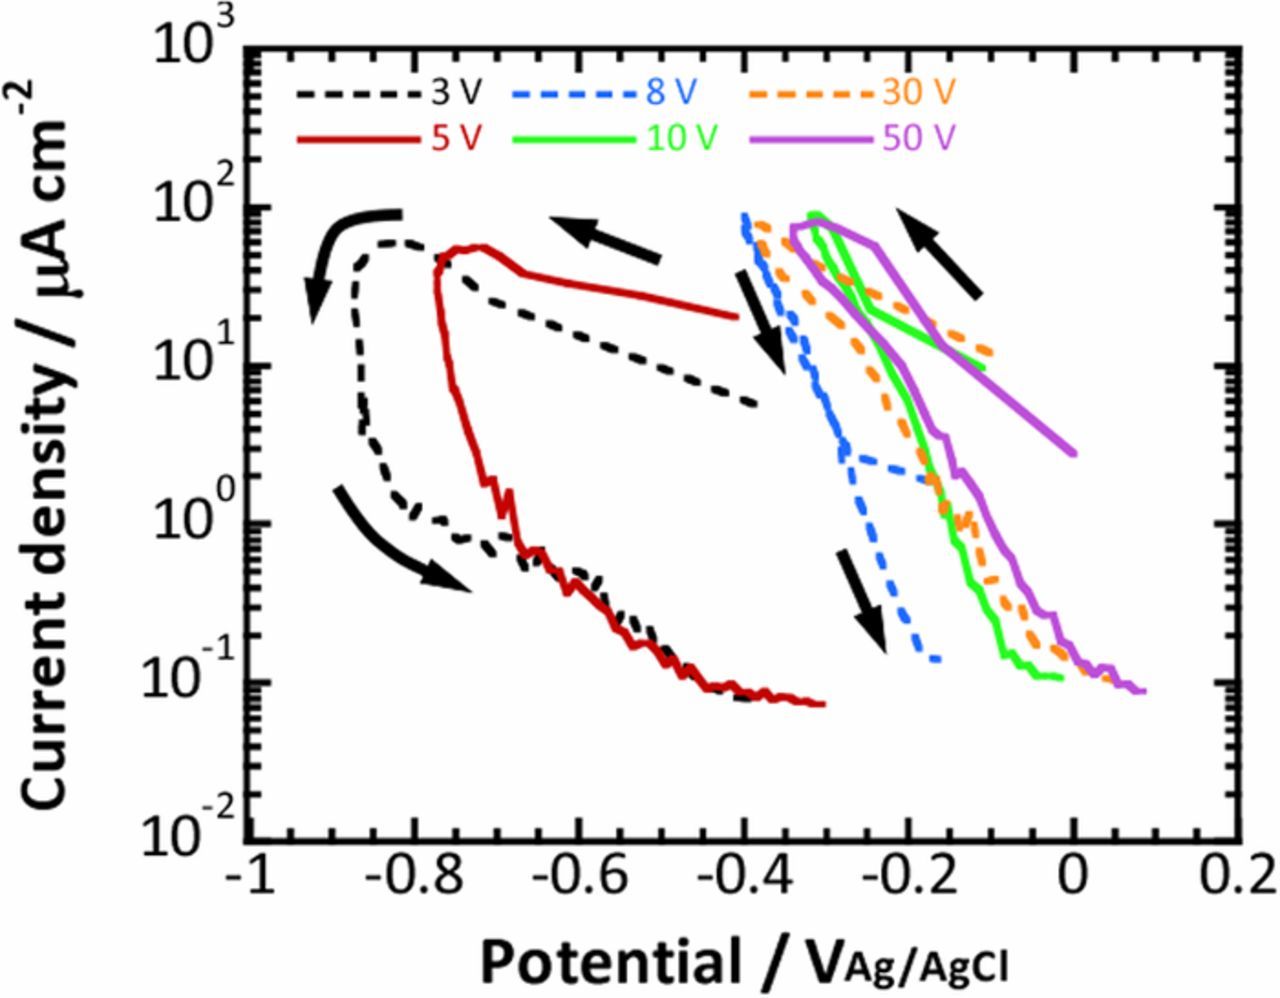
Figure 4. Quasi-polarization curves obtained from the results of the fast current-controlled polarization shown in Fig. 3. The arrows indicate the time sequence during the fast current-controlled polarization.
Figures 5a and 5b show the potentiodynamic polarization curves obtained for the anodized titanium substrates at 5 V and 10 V in 0.1M phosphate buffer solution, respectively. The potentiodynamic polarization curves were measured from 100 mVAg/AgCl to −1000 mVAg/AgCl with a scan rate of 15 mV min−1 in the phosphate buffer solution, the dissolved oxygen concentration of which was controlled at 0.1 ppm. In the graphs, the quasi-polarization curves obtained in the fast current-controlled polarization for the anodized titanium substrates at 5 V and 10 V are also included. In the potentiodynamic polarization curves, the logarithm of the current density linearly increased with decreasing potential from the corrosion potential, indicating that oxygen reduction was controlled by the electron transfer process. The further decrease in potential caused the current to level off at the oxygen diffusion limiting current plateau, although a clear peak was observed at approximately −400 mVAg/AgCl for the 10 V anodized substrate. Although as Ohtsuka et al. speculated,14 the peak may be attributed to the formation of TiOOH, its effect on the fast current-controlled polarization was negligible because the duration of the cathodic polarization was quite short. As is apparent from the figures, during the fast current-controlled polarization, relatively larger currents were generated compared to the diffusion-limiting current of oxygen. Furthermore, it was found that the polarization curve obtained for the 10 V anodized substrate in the fast current-controlled polarization exhibited a similar slope to that observed within the same potential region of the potentiodynamic polarization curve, where the electron transfer reaction was dominant, as shown in Fig. 5a. On the other hand, although an oxygen reduction current relatively larger than the diffusion limiting current was observed in the very early stage of the fast current-controlled polarization of the 5 V anodized titanium substrate, the current gradually decreased over time and eventually converged to the diffusion limiting current.
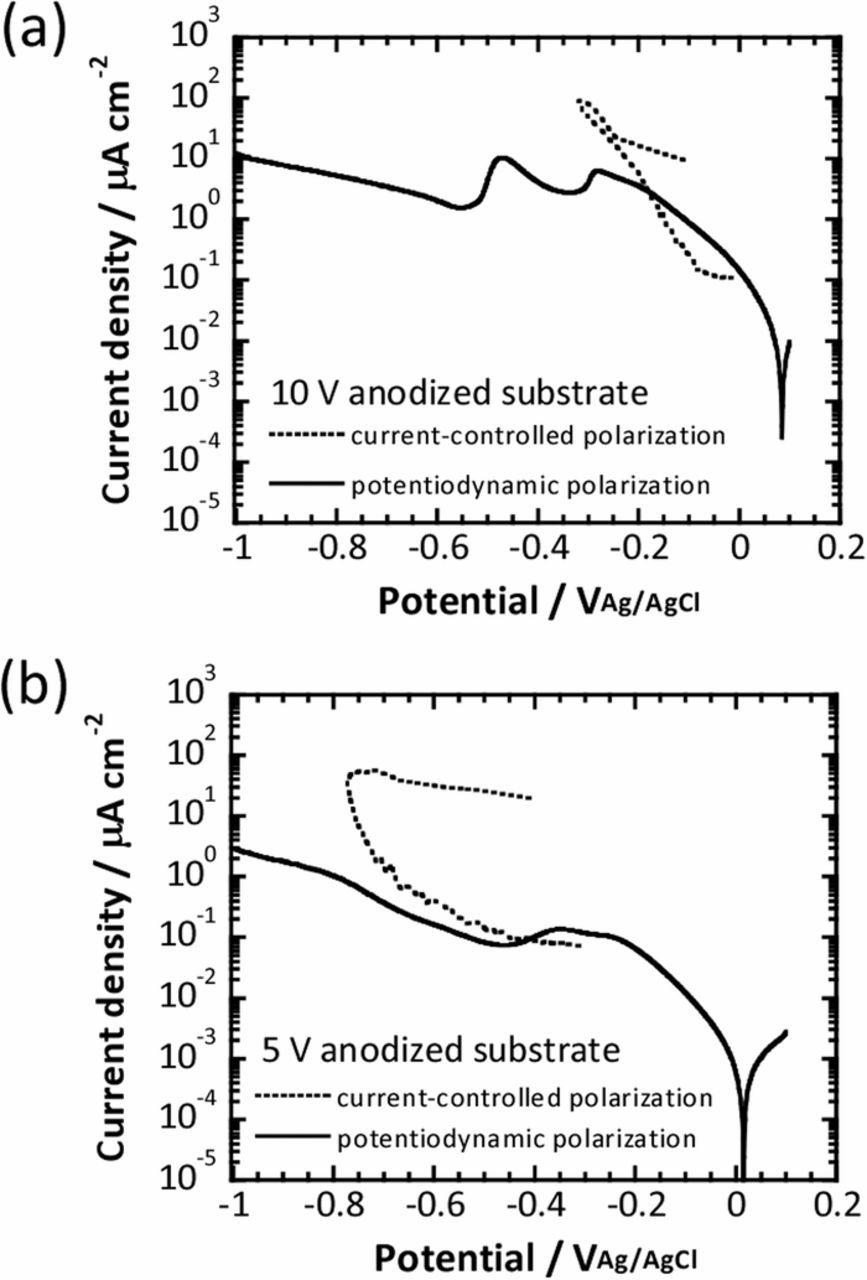
Figure 5. Potentiodynamic polarization curves obtained for titanium substrates anodized at (a) 10 V and (b) 5 V in 0.1M phosphate buffer solution. Quasi-polarization curves obtained in fast current-controlled polarization of the anodized titanium substrates are included for comparison.
To examine the effect of the dissolved oxygen concentration, fast current-controlled polarization was performed under a dissolved oxygen concentration of 5 ppm with a maximum current density of 100 μA cm−2 as shown in Fig. 1 for 5 V and 10 V anodized titanium substrates in the phosphate buffer solution. Oxygen reduction currents were calculated as described above for both anodized titanium substrates. Quasi-polarization curves for oxygen reduction at an oxygen concentration of 5 ppm are presented in Fig. 6a. The corresponding quasi-polarization curves obtained for an oxygen concentration of 0.1 ppm are also included for comparison. It is obvious that the shape of the quasi-polarization curves obtained in the fast current-controlled polarization was unchanged when the oxygen concentration was increased to 5 ppm, except that the quasi-polarization curves obtained for 5 ppm shifted in the noble direction compared with those for 0.1 ppm, for both anodized titanium substrates. This means that the 5 V anodized titanium substrate exhibited a wide loop, whereas the 10 V anodized substrate exhibited linear dependence in the solution with a dissolved oxygen concentration of 5 ppm. In addition, it was also clear that the maximum oxygen reduction current was similar, independent of the dissolved oxygen concentration. Therefore, it can be deduced from Figs. 4 and 6a that the maximum oxygen reduction current is determined by the maximum applied current, that is, 100 μA cm−2 in this case. To confirm this, a 10 times larger maximum cathodic current density of 1 mA cm−2 (shown in Fig. 1) was used in the fast current-controlled polarization. The quasi-polarization curves obtained for the 5 V and 10 V anodized substrates with those obtained by applying 1 mA cm−2 are presented in Fig. 6b. The shape of the quasi-polarization curves was similar for the titanium substrates anodized at the same voltages. However, the maximum oxygen reduction current was approximately 10 times larger when fast current-controlled polarization was performed with the larger applied current density of 1 mA cm−2. Furthermore, the potential was less noble when the larger maximum current density was used.
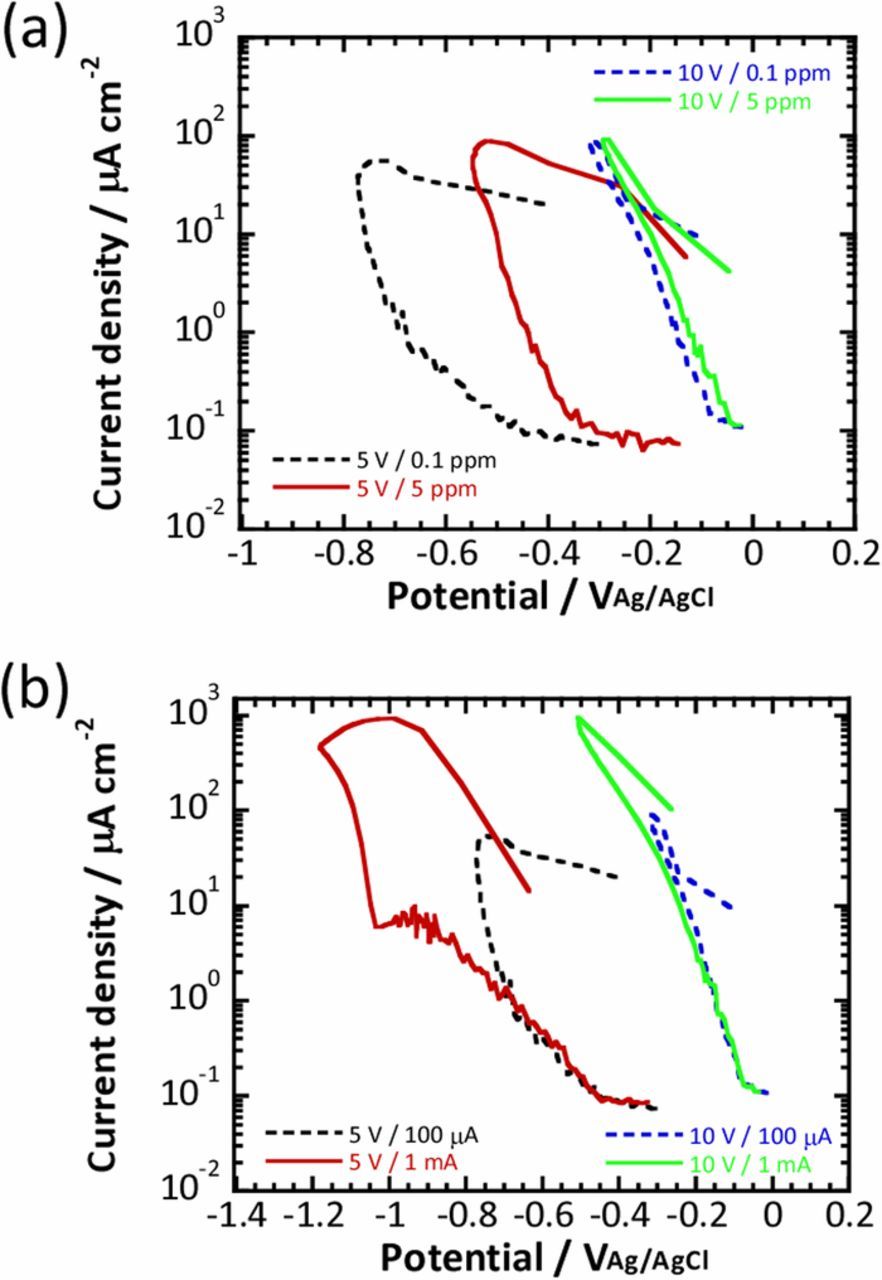
Figure 6. Quasi-polarization curves obtained for the titanium substrates anodized at 5 V and 10 V by fast current-controlled polarization (a) with a maximum current density of 100 μA cm−2 in 0.1M phosphate buffer solution with different dissolved oxygen concentrations, and (b) with different maximum current densities in phosphate buffer solution with a dissolved oxygen concentration of 0.1 ppm.
As described above, the oxygen reduction on anodized titanium substrates during the fast current-controlled polarization was strongly different depending on the anodization voltage, that is, between the titanium substrates anodized at smaller voltages than 5 V and those anodized at larger voltages than 8 V. It is well-known that the thickness and the crystallinity of anodic oxide films on titanium vary depending on the anodization voltage. In addition to the work by Ohtsuka et al.,15 Marino et al. also reported the growth rate of anodic oxide films as 2.1 nm V−1 for titanium in phosphate buffer solutions.16 Furthermore, Sharma showed that the film thickness of anodic films of titanium increased over a wide range of operating voltages from 2 V to 75 V.17 On the other hand, Ohtsuka et al. examined anodic oxide films formed on titanium in sulfuric acid solution by using laser Raman spectroscopy and found peaks derived from anatase TiO2 in anodic oxide films formed at potentials higher than 5 V, while no peaks were found for the anodic oxide films formed at potentials lower than 5 V. Therefore, they concluded that anodic oxide film on titanium changed from an amorphous state to a crystalline state beyond the critical potential.4 Therefore, it is considered that also in the present work, the anodic oxide films formed at 3 V and 5 V were amorphous TiO2, while the anodic oxide films formed at higher voltages than 8 V consisted of crystalline TiO2. The threshold anodization voltage for the phase transition of anodic oxide film is roughly in accordance with the threshold anodization voltage for the change in the shape of the quasi-polarization curve. Therefore, we think that the oxygen reduction reaction was more significantly affected by the crystallinity of the anodic oxide film than the thickness of the anodic film although the details are still not clear. In the present work, the charge efficiency of the oxygen reduction reaction is denoted as the ratio of the charge used for the oxygen reduction in the fast current-controlled polarization to the total charge applied and is summarized in Fig. 7 for various anodized titanium substrates. Clearly, the efficiency was relatively low for the amorphous anodized substrates at 3 V and 5 V. However, once the crystallization of anodic oxide film occurred, the efficiency became almost 1. In other words, the charge applied in the fast current-controlled polarization was utilized almost for the oxygen reduction on the crystalline anodized substrates at voltages higher than 8 V. Mazzolini et al. reported that the resistivity of as-deposited amorphous TiO2 by a pulsed laser deposition decreased after its crystallization.18 Therefore, we suppose that the crystallization occurred at higher anodization voltages than 8 V can decrease the resistivity of anodic films, contributing to the oxygen reduction. Although some additional characterization is required to discuss the details of the quasi-polarization behavior, the present work demonstrates that fast current-controlled polarization is a useful approach for investigating the rapid oxygen reduction reaction, which will provide new insight on the cathodic process during localized corrosion.
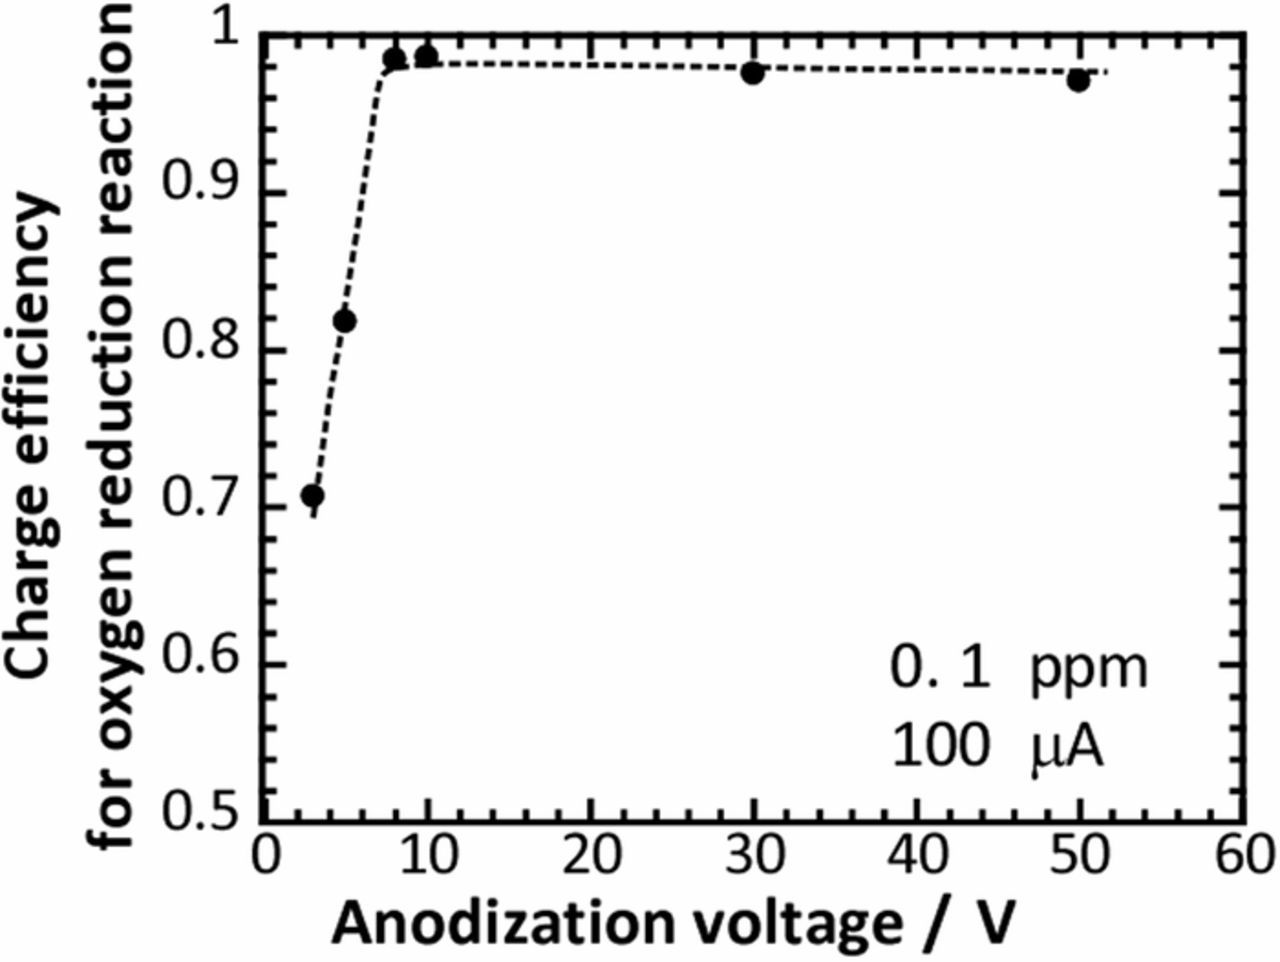
Figure 7. Charge efficiency for the oxygen reduction reaction in fast current-controlled polarization for the titanium substrates anodized at different voltages.
Conclusions
The present work proposed a fast current-controlled polarization for the analysis of a rapid oxygen reduction reaction occurring on anodized titanium substrates in a phosphate buffer solution. Anodic oxide films on a titanium substrate were prepared by anodization in the same solution at various voltages ranging from 3 V to 50 V, resulting in different thickness and crystallinity. On the basis of the potential variation and the potential dependence of the capacitance, the oxygen reduction current-time profile during the fast current-controlled polarization was estimated and as a result the quasi-polarization curve of the oxygen reduction reaction was obtained. The quasi-polarization curves obtained for the anodized substrates were categorized into two type; the linear slope and the wide loop. These differences were attributed to the crystallinity of the anodic oxide film on titanium. Considering the correlation between the crystallinity of anodic film and its conductivity, these results imply that the fast oxygen reduction on passivated metals will be affected by the crystallinity and resulting conductivity of oxide film.
Acknowledgments
The present work was supported by a Grant-in-Aid for Scientific Research (A) (Project No. 17H01332) from the Japan Society for the Promotion of Science.
ORCID
Shinji Fujimoto 0000-0002-7787-4190