Abstract
The size, distribution, and volume fraction of second phases are altered during extrusion deformation. As a result, the microgalvanic corrosion of Mg alloys will change. The corrosion behaviors of cast and extruded EW75 (Mg–5Y–7Gd–1Nd–0.5Zr) were studied by scanning electron microscopy observations, hydrogen evolution and weight loss measurements, and electrochemical tests. Extruded EW75, which has a lower volume fraction, smaller size, and more uniform distribution of second phases, is found to exhibit better corrosion resistance than cast EW75; the difference can be attributed to weaker microgalvanic corrosion and a more protective surface film.
Export citation and abstract BibTeX RIS

This is an open access article distributed under the terms of the Creative Commons Attribution 4.0 License (CC BY, http://creativecommons.org/licenses/by/4.0/), which permits unrestricted reuse of the work in any medium, provided the original work is properly cited.
Magnesium and its alloys have become increasingly attractive in the automotive and aerospace industries because of their many advantages, such as low density and high specific strength and stiffness.1–3 In recent years, rare earth (RE) Mg alloys have received considerable attention.4–9 Mg–RE alloys, especially the Mg–Gd–Y system, exhibit high strength and good creep resistance at both room temperature and elevated temperatures.10–13 To improve the mechanical properties of Mg–RE alloys, altering the microstructure by deformation treatment is known to be a suitable and efficient method.14 However, the changes in the microstructures may strongly affect the corrosion resistance of the alloy.15–17 The volume fraction, size, and distribution of second phases are altered during the deformation process.18–20 Hence, the microgalvanic corrosion between the second phases and the Mg matrix in the received cast and extruded (or forged) alloys should be different.
Microgalvanic corrosion between the second phases and the Mg matrix is one of the most significant types of corrosion in Mg alloys.21–23 In our previous work, we found that microgalvanic corrosion of cast EW75 differs from that of other Mg alloy systems.24 The second phases in cast EW75 consisting of Mg and REs are more active than the Mg matrix, and they preferentially dissolve in microgalvanic corrosion. Moreover, REs that are bound in the second phases contribute to the construction of the initial surface film. A surface film containing REs is reportedly more protective.25–27 Moreover, it was found that grain size influences the corrosion resistance little, which can be attributed to the good electrochemical uniformity of grain boundaries in comparison with the existence of second phases. The above analysis suggests that the microgalvanic corrosion between the second phases and the Mg matrix is very important to the corrosion mechanism and corrosion resistance of Mg–RE alloys. Therefore, if this type of corrosion were changed by the deformation process, the corrosion mechanism and corrosion resistance of Mg–RE alloys would differ greatly.
The aim of this work is to investigate the corrosion behaviors of cast and extruded EW75 Mg alloys and clarify the effect of extrusion deformation on the corrosion resistance.
Experimental
Cast and extruded EW75 (Gd: 7.04 wt%, Y: 4.53 wt%, Nd: 1.29 wt%, Zr: 0.49 wt%, and Mg balance) were produced by the General Research Institute for Nonferrous Metals, PR China. The materials used for the extrusion process were cut from cast EW75 magnesium ingots and homogenized at 535 °C for 12 h and then extruded at a pressing speed of 5 mm s−1 at 400 °C. The extrusion ratio was 23.8, and the cross-sectional area of the extruded sheet was 290 × 20 mm2. After the deformation process, the samples were immediately quenched into water.
Specimens for microstructure observation and immersion tests were wet-ground with water through successive grades of SiC abrasive papers from P320 to P5000, followed by polishing with 1 μm diamond paste; they were then rinsed with distilled water, degreased with ethanol, and dried in compressed cold air. Samples for microstructure observation were etched using a solution of 4 mL of HNO3 and 96 mL of ethanol.
For X-ray diffraction (XRD), Hydrogen evolution and weight loss, and electrochemical measurements, specimens were wet-ground to P2000 using abrasive papers.
Cast EW75 samples for solid-solution (SS) treatment were held at 535 °C for 12 h and then quenched into water.
The test solution for all tests was 3.5 wt% NaCl at 20 ± 1 °C. For the immersion tests, the ratio of sample surface area (cm2) to the volume of NaCl solution (mL) was set to 1:100, and the solution was updated every 48 h to keep stable pH values. Corrosion products were removed by a chromic acid solution consisting of 180 g L−1 of CrO3.
The microstructures of cast and extruded EW75 were observed using a Philips PW1700 XRD instrument with a Cu target (λ = 0.154 nm). The XRD patterns were analyzed using MDI Jade 5.0 software.
Hydrogen gas was collected in a burette through a funnel mounted over a specimen with dimensions of 25 × 30 × 10 mm3 in a beaker containing 2 L of testing solution (Fig. 1).28,29 The sample was hung by a thread so that it did not touch the beaker.
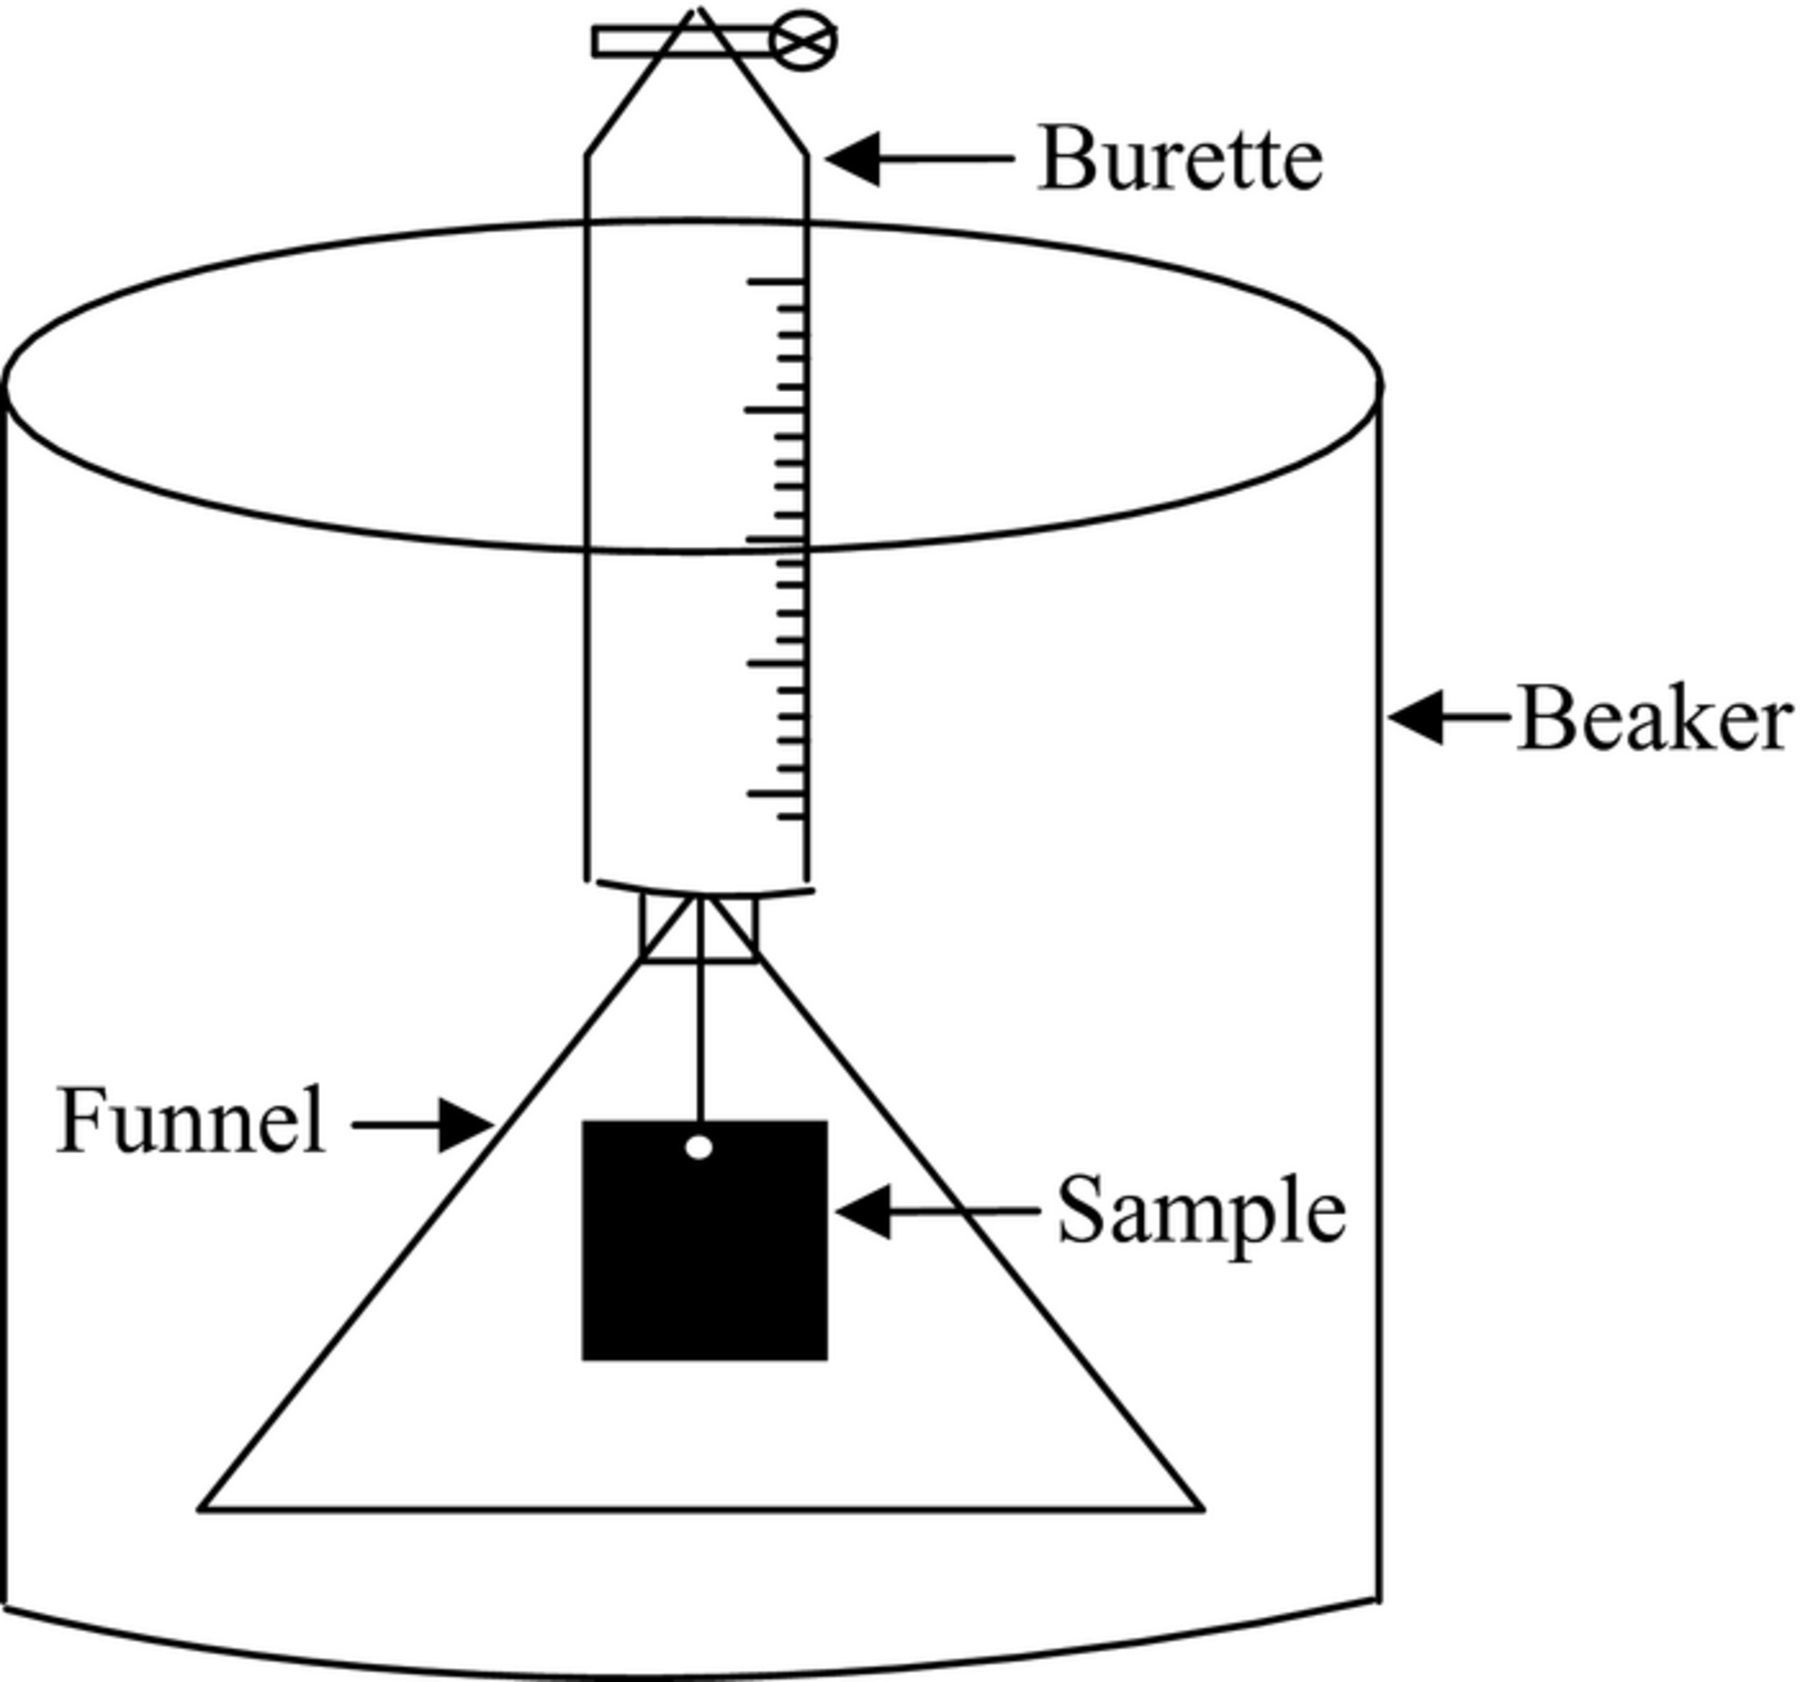
Figure 1. Schematic map of the setup for hydrogen gas collection.
Specimens for weight loss measurements were cut into coupons with dimensions of 25 × 30 × 10 mm3, and weighed before exposure using a digital balance (Sartorius BSA2245-CW) with a precision of 0.0001 g as the original weight. After immersion for 7 d in the test solution, the corroded specimens were immersed in a chromic acid solution for about 10 min to remove the corrosion products. Then, the specimens were washed with deionized water and dried by a hot air flow. Finally, the specimens were weighed to obtain the weight loss rate.
The corrosion morphologies and surface film morphologies were observed by a Phillips XL30FEG scanning electron microscope equipped with an energy-dispersive X-ray spectroscope (EDX) with an acceleration voltage of 14 kV.
Electrochemical measurements were conducted using a PARSTAT4000 electrochemistry test system (Princeton Applied Research, USA). A classical three-electrode cell was used, with platinum as the counter electrode, a saturated calomel electrode (SCE) (+0.242 V vs. standard hydrogen electrode) as the reference electrode, and the samples, sealed in epoxy resin with an exposed area of 1 cm2, as the working electrode. The anodic polarization curves were started at the open circuit potential (OCP) and terminated at a final current density of 10 mA cm−2. The cathodic polarization curves were started at the OCP and terminated at a potential of −250 mV vs. OCP. The scan rate was 0.5 mV s−1. The scan frequency of electrochemical impedance spectroscopy (EIS) ranged from 100 kHz to 10 mHz with a perturbation amplitude of 20 mV rms. The EIS spectra were fitted using the ZSimpWin 3.20 software. An initial delay of 30 min was set for the polarization and EIS measurements to ensure a stable testing system and the integrity of the surface film.
All of these tests were repeated at least three times on different samples to ensure accuracy.
Results
Microstructure
The XRD analysis of cast and extruded EW75 is shown in Fig. 2. The peaks of Mg, Mg24Y5, and Zr are visible for both samples, but Mg41Nd5 and Mg5Gd are not apparent for extruded EW75.
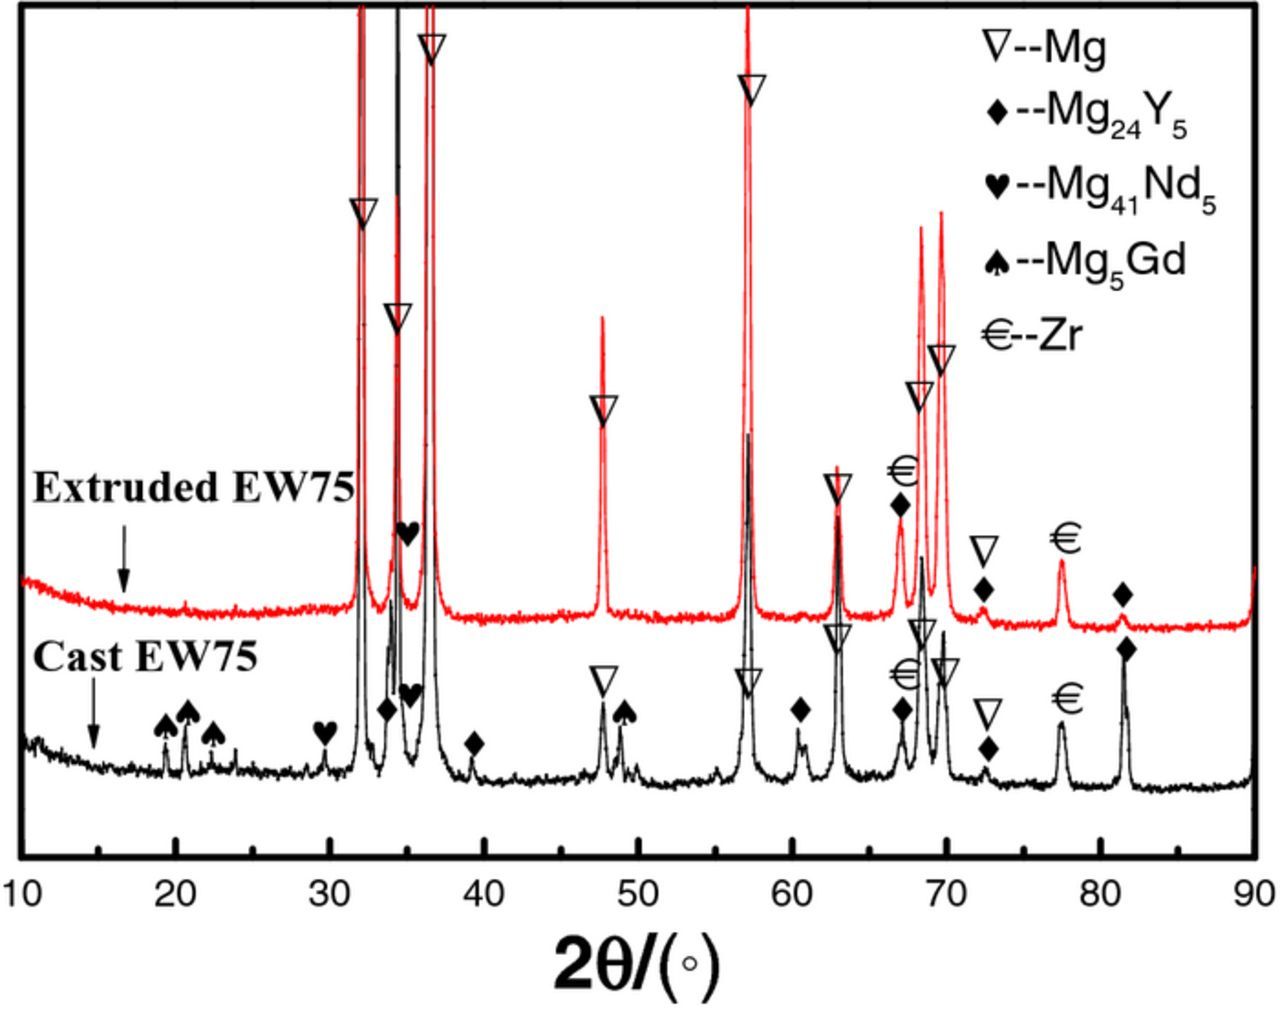
Figure 2. XRD patterns of cast and extruded EW75.
The microstructures of cast and extruded EW75 are shown in Fig. 3. In cast EW75, dendritic second phases exhibit an obvious network distribution (see arrow in Fig. 3a). The high-magnification view of the morphology in Fig. 3c shows that the second phases are distributed along grain boundaries. Moreover, the Mg matrix adjacent to the grain boundaries exhibits a lighter color indicating RE enrichment (see arrows in Fig. 3a).24 Actually, another small block-shaped second phase appears in cast EW75 (see arrows in Fig. 3b). The microstructure of extruded EW75 is quite different from that of cast EW75, as shown in Fig. 3d and 3e. The second phases and grains of extruded EW75 are much smaller, and the second phases are no longer distributed along grain boundaries. Extruded EW75 also has two types of second phases, namely, block-shaped (see arrows in Fig. 3d) and smaller (see arrows in Fig. 3e). Considering the XRD and EDX results (Tables I and II), the block-shaped second phases in extruded EW75 consist of Mg, Y, and Gd, which is the same composition as the second phases in cast EW75. That is, the block-shaped second phases are not affected by deformation during extrusion. However, the dendritic second phases in cast EW75 cannot be seen in extruded EW75. In fact, the chemical composition of the smaller second phases, which are distributed homogeneously in extruded EW75, consists of Mg, Y, Gd, and Nd, and is similar to the composition of the dendritic second phases in cast EW75. Another difference between the two alloys is that the volume fraction of second phases in extruded EW75 is lower and REs are uniformly distributed in the Mg matrix without enrichment around the grain boundaries. The reason for the difference is that the solubility of REs in the Mg matrix of extruded EW75 is improved, and REs are diffused into the Mg matrix at elevated temperature. The REs contents in the matrix of cast and extruded EW75 are shown in Table I and II. This is the reason for the extremely weak diffraction peaks of Mg41Nd5 and Mg5Gd in extruded EW75, as shown in Fig. 2.
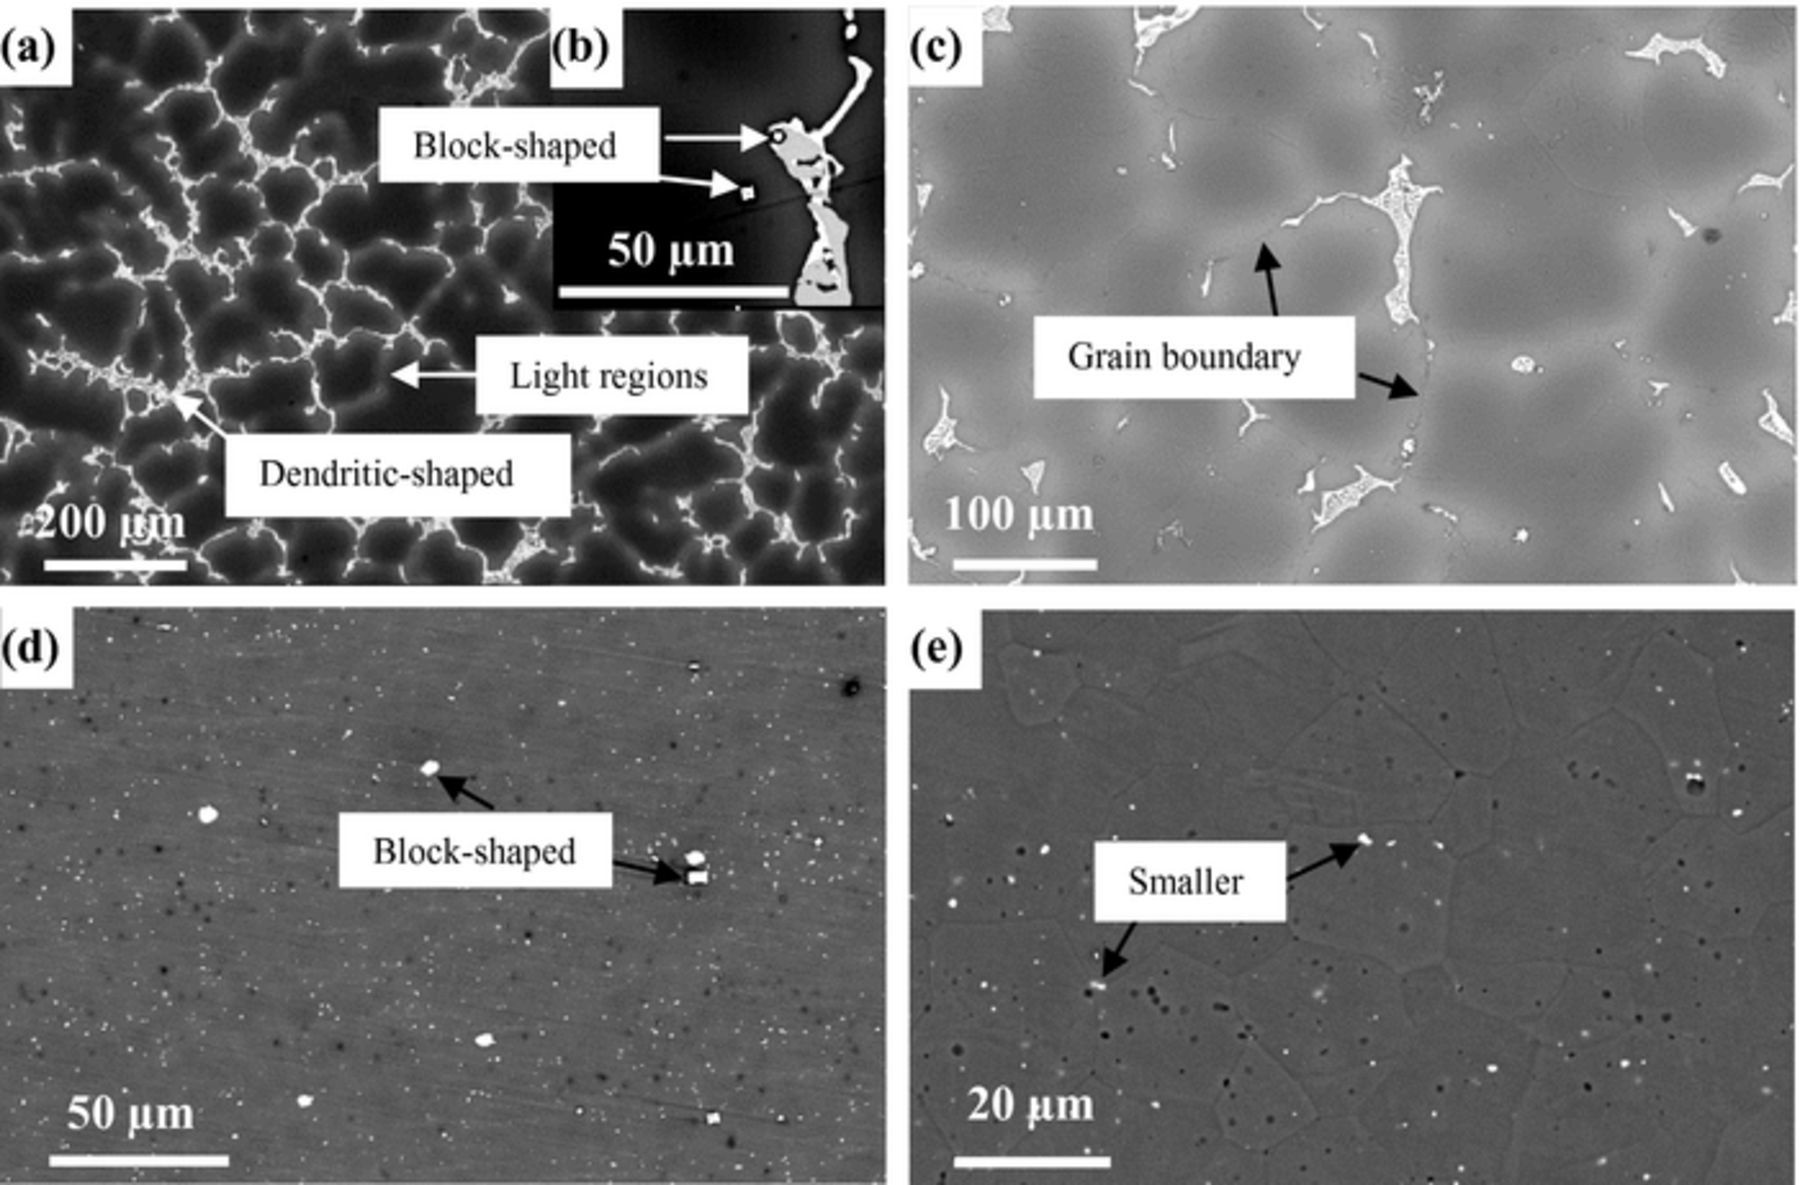
Figure 3. BSE-SEM morphologies of cast EW75 (a, b, and c) and extruded EW75 (d, e).
Table I. EDX results of second phases in cast EW75 (wt%).
| Second phases | Mg | Y | Gd | Nd |
|---|---|---|---|---|
| Block-shaped | 2.60 | 50.38 | 47.03 | – |
| Dendritic-shaped | 55.40 | 11.72 | 22.42 | 10.46 |
| Matrix | 96.83 | 3.17 | – | – |
Table II. EDX results of second phases in extruded EW75 (wt%).
| Second phases | Mg | Y | Gd | Nd |
|---|---|---|---|---|
| Block-shaped | 0.82 | 60.76 | 38.41 | – |
| Smaller-shaped | 66.80 | 7.28 | 13.32 | 12.60 |
| Matrix | 94.86 | 3.75 | 1.39 | – |
Hydrogen evolution and weight loss measurements
The hydrogen evolution rates versus the immersion time of cast and extruded EW75 in 3.5 wt% NaCl solution are shown in Figs. 4a and 4b. Cast EW75 exhibits a much faster hydrogen evolution rate, and the rate increases sharply with increasing immersion time. However, the hydrogen evolution rate of extruded EW75 is much lower and is insensitive to the immersion time. The faster hydrogen evolution rate indicates that the microgalvanic corrosion of cast EW75 is much more severe than that of extruded EW75. In other words, extruded EW75 exhibits much better corrosion resistance than cast EW75.
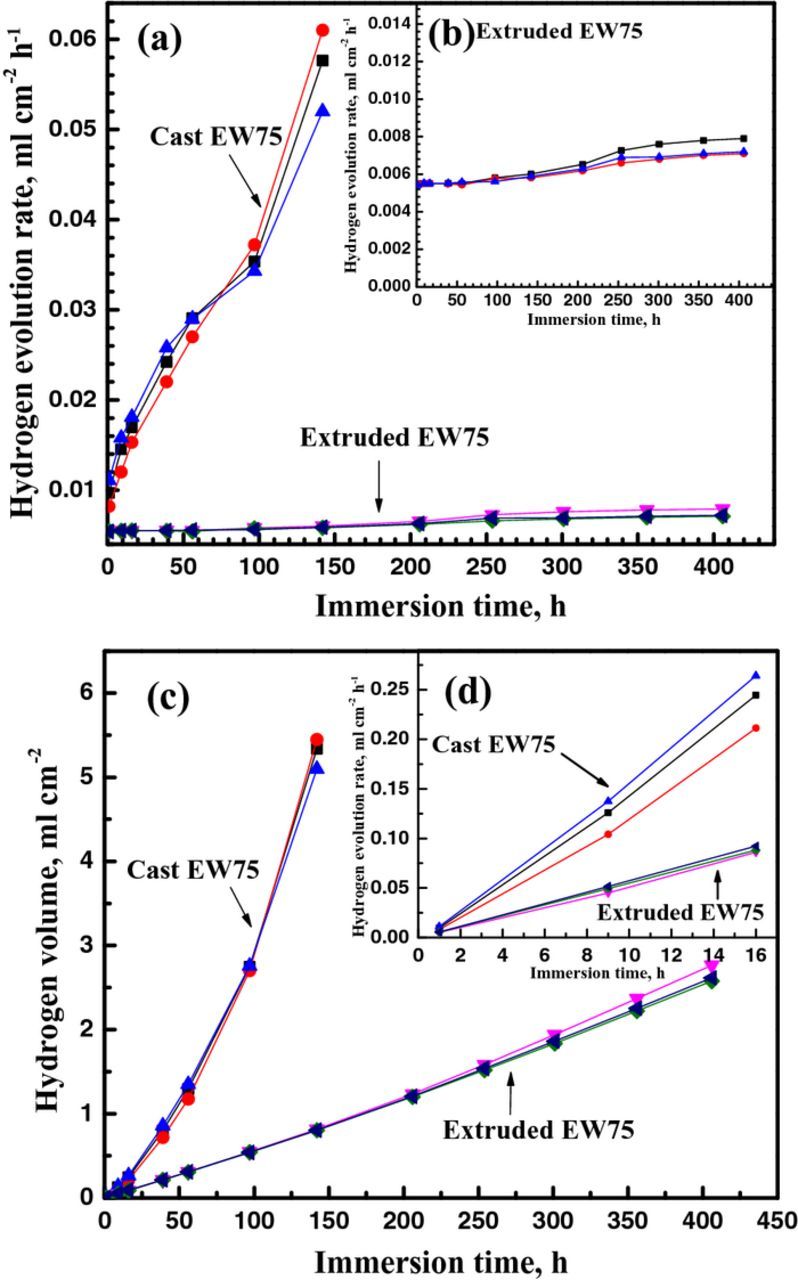
Figure 4. Hydrogen evolution of three sets of cast and extruded EW75 respectively in 3.5 wt% NaCl solution: (a) hydrogen evolution rate of cast and extruded EW75, (b) enlargement of extruded EW75, (c) hydrogen evolution volume of cast and extruded EW75.
The weight loss rate of extruded and cast EW75 after immersion in 3.5 wt% NaCl solution for 7 d is 0.298 and 3.42 mm y−1, respectively (Fig. 5). Namely, the weight loss rate of cast EW75 is 10 times that of extruded EW75, which indicates that cast EW75 exhibits much faster microgalvanic corrosion and much worse corrosion resistance than extruded EW75. The results are in agreement with those of the hydrogen evolution rate measurements.
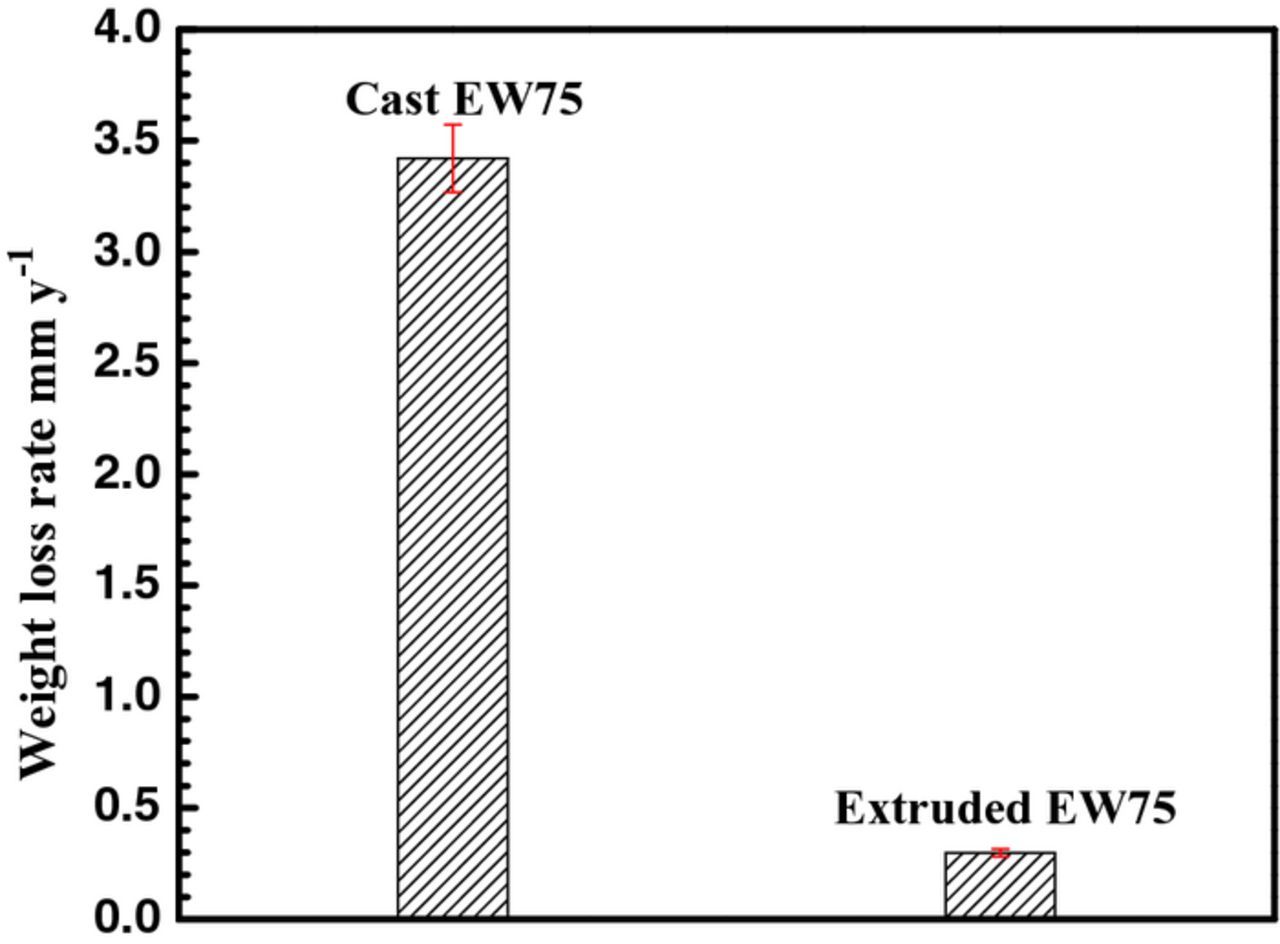
Figure 5. Weight loss rates of cast and extruded EW75 after immersion in 3.5 wt% NaCl solution for 7 d.
Electrochemical tests
The polarization curves of cast and extruded EW75 are shown in Fig. 6. The polarization curves were fitted, and the results are shown in Table III. The anodic polarization curves of both cast and extruded EW75 show that the corrosion current densities initially increase slowly with increasing anodic potential. When the potential reaches about −1.6 V (SCE), namely, the film breakdown potential or pitting potential, the corrosion current densities increase quickly. This result indicates that protective films exist on the surface of the alloys and reduce the corrosion rate. Once the anodic potential reaches the film breakdown potential, the surface film breaks, and the alloys are corroded quickly. The film breakdown potentials of cast and extruded EW75 are clearly similar. However, both the anodic and cathodic current densities of extruded EW75 are lower than those of cast EW75; that is, extruded EW75 has lower anodic dissolution and cathodic hydrogen reduction rates.
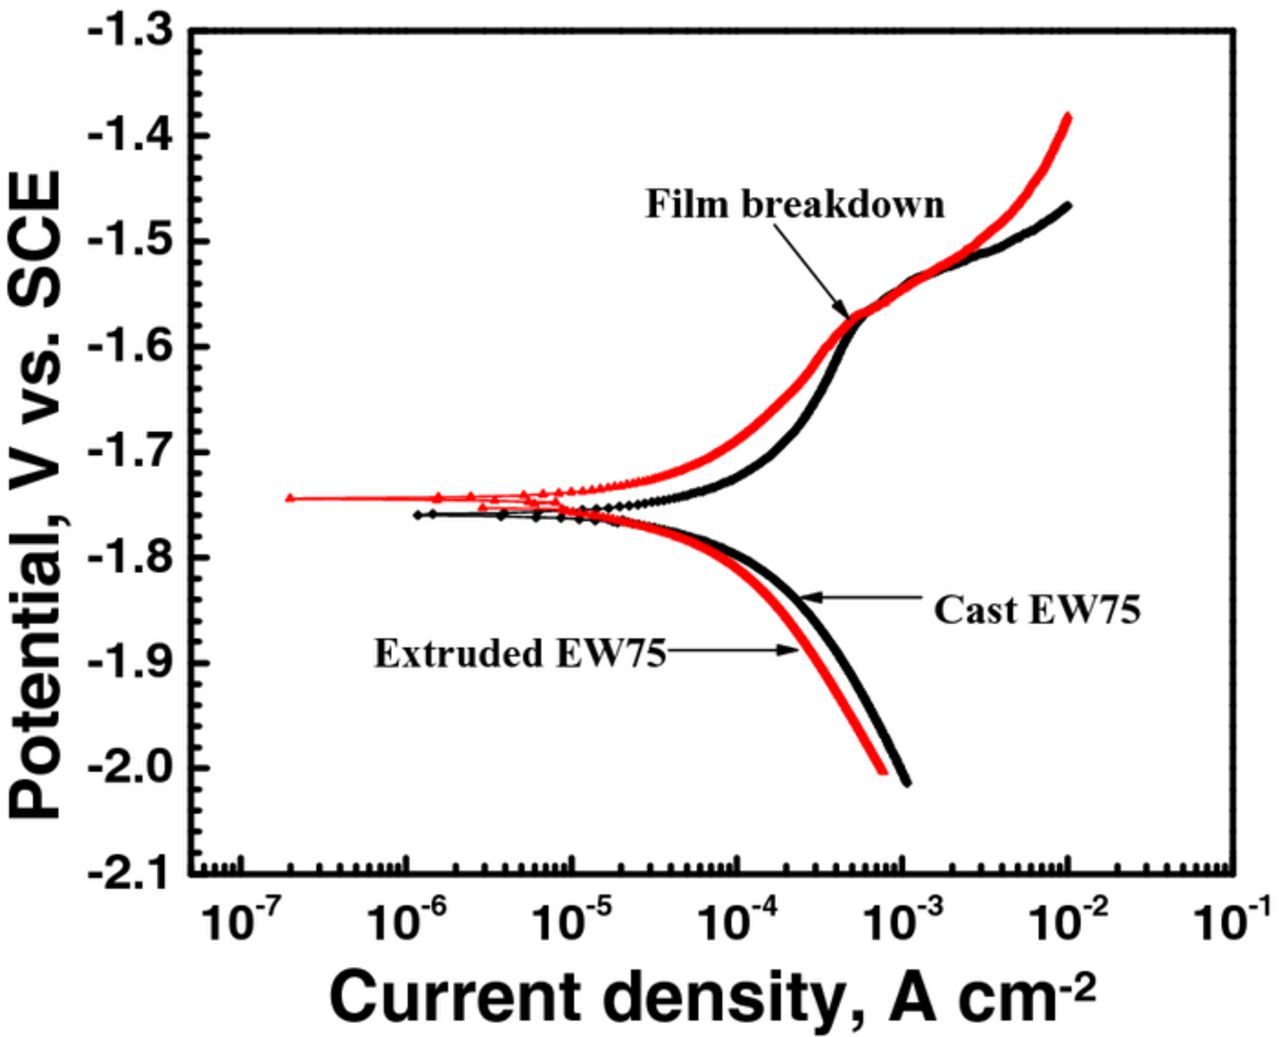
Figure 6. Polarization curves of cast and extruded EW75 after immersion in 3.5 wt% NaCl solution for 30 min.
Table III. Fitting results of polarization curves.
| Ecorr (VSCE) | icorr (μA cm−2) | ba (mV decade−1) | bc (−mV decade−1) | |
|---|---|---|---|---|
| Cast EW75 | −1.751 ± 0.03 | 119.2 ± 13 | 192.98 ± 6 | 200.60 ± 7 |
| Extruded EW75 | −1.765 ± 0.02 | 48.85 ± 6 | 271.43 ± 5 | 250.13 ± 5 |
Nyquist plots of cast and extruded EW75 are shown in Fig. 7. Both plots consist of a high-frequency capacitance loop followed by a medium-frequency capacitance loop and a very short low-frequency inductance loop. The high-frequency capacitance loops are due to the electric double layer at the interface of the Mg substrate and the solution; the medium-frequency capacitance loops are related to the surface film, and the low-frequency inductance loops indicate the initiation of corrosion.30–32 However, the dimension of the Nyquist plot for extruded EW75 is larger than that of the plot for cast EW75. An equivalent circuit (Fig. 7) is proposed to fit the EIS spectra. Because some defects (e.g., micropores or cracks) inevitably exist in the surface oxide films, (RC) and (RQ) in series are chosen here.33 Rs is the solution resistance between the reference electrode and the surface of the specimen. Cdl is the double layer capacitance; Rt is the charge transfer resistance, which depends on the dissolution rate of the Mg substrate in the pores of the surface film. Qf is the surface film capacitance; it is proportional to the film porosity and reciprocal to the film thickness. Rf is the surface film resistance and is determined mainly by the film porosity and the solution conductivity in the pores of the surface film. The constant phase element Q is defined by two values, Y and n. If n is equal to 1, Q is identical to a capacitor (C). A constant phase element is used in place of a capacitor to compensate for the inhomogeneity due to the existence of second phases, scratches, and oxide films on the sample surface. L is the inductance for electrochemical reactions at the film/substrate interface; RL is the resistance of the inductance.20,34
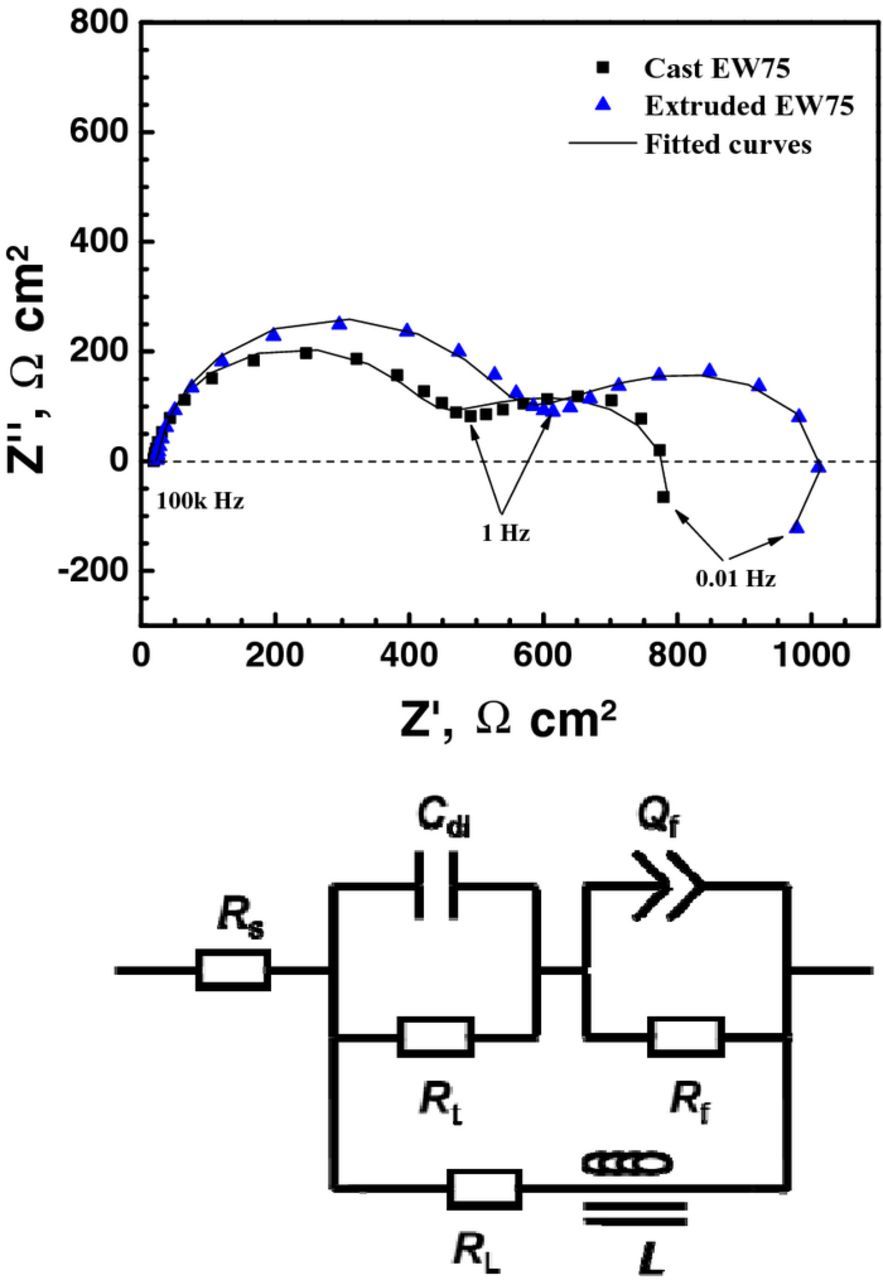
Figure 7. EIS spectra and equivalent circuit of cast and extruded EW75 after immersion in 3.5 wt% NaCl solution for 30 min. The EIS spectra were measured at the open circuit potential (−1.78 V and −1.73 V (SCE) for cast and extruded EW75, respectively).
According to the fitting results in Table IV, extruded EW75 shows higher Rt and Rf values, which indicate a lower metal dissolution rate and a more protective film. The EIS results agree with those of the polarization, hydrogen evolution, and weight loss measurements.
Table IV. Fitting results of EIS spectra.
| Rs (Ω cm2) | Cdl (F cm−2) | Rct (Ω cm2) | Qf (μS cm−2 s−n) | nf | Rf (Ω cm2) | L (H cm2) | RL (Ω cm2) | ||
|---|---|---|---|---|---|---|---|---|---|
| Cast EW75 | 18.11 ± 1.32 | 2.183 ± 0.1×10⁻⁵ | 370 ± 18 | 2509 ± 296 | 0.5520 ± 0.03 | 536.7 ± 29 | 39670 ± 2060 | 539 ± 23 | |
| Extruded EW75 | 21.17 ± 1.20 | 1.204 ± 0.03×10⁻⁵ | 472 ± 9 | 2558 ± 112 | 0.4634 ± 0.02 | 1422 ± 135 | 23280 ± 1560 | 1135 ± 51 |
Corrosion morphologies
The corrosion morphology of cast EW75 after immersion in 3.5 wt% NaCl solution for 2 h and removal of the corrosion products is shown in Fig. 8. The second phases, which consist of Mg and RE in cast EW75, are more active than the Mg matrix. Consequently, the second phases are preferentially dissolved as microanodes, and the Mg matrix is protected as the microcathode. This part of the work was discussed in detail in our previous study.24
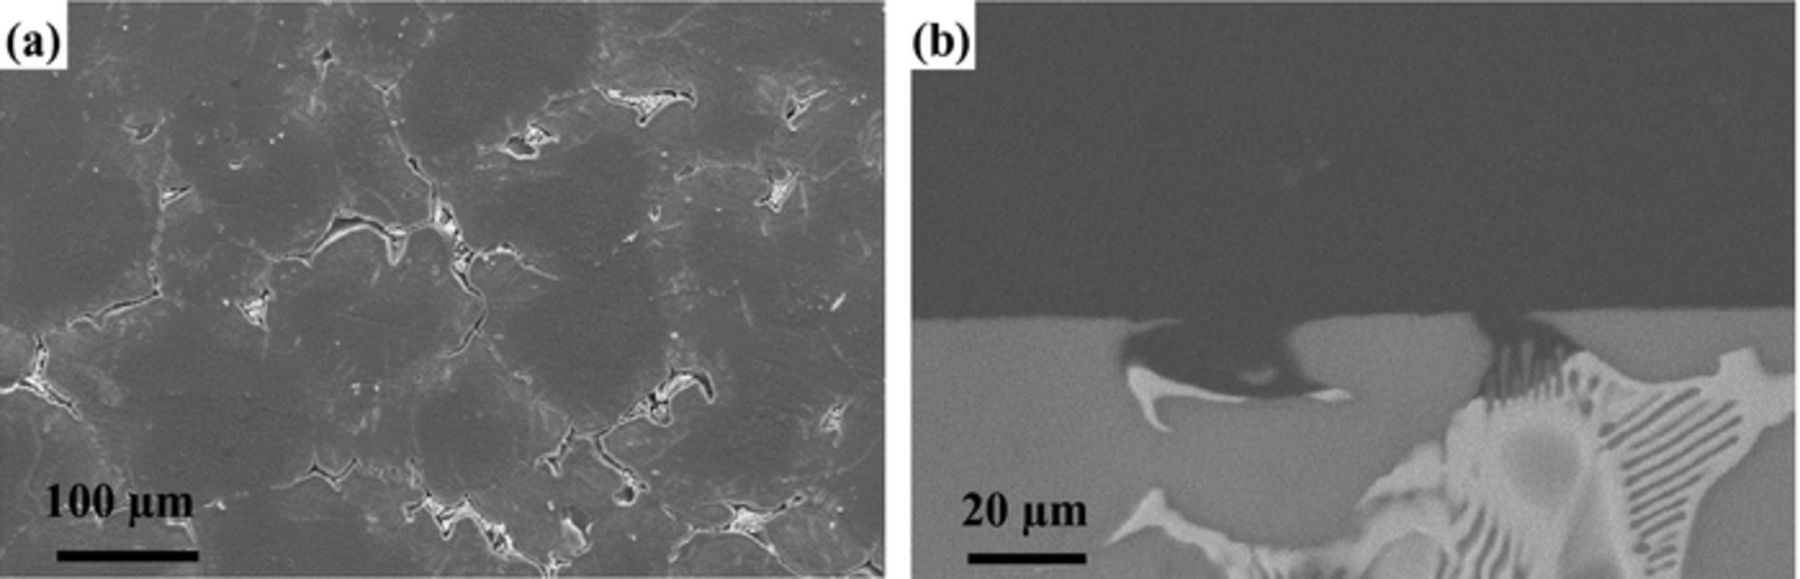
Figure 8. Corrosion morphologies of cast EW75 after immersion in 3.5 wt% NaCl solution for 2 h with removal of corrosion products: (a) SE-SEM of surface, (b) BSE-SEM of cross-section.
The corrosion morphology of extruded EW75 after immersion in 3.5 wt% NaCl solution (Fig. 9) differs from that of cast EW75. After 10 min of immersion (Fig. 9a), no obvious corrosion is observed on the surface of the specimen except for the appearance of grain boundaries. Figs. 9b and 9c show the morphology after 30 min and 2 h of immersion, respectively; dissolution of a few second phases appears, whereas the Mg matrix is not attacked. After 24 h of immersion, a few second phases can be seen, and the Mg matrix also undergoes attack (Fig. 9d). Overall, extruded EW75 clearly exhibits microgalvanic corrosion with second phases acting as microanodes, but the microgalvanic corrosion is much weaker than that of cast EW75.
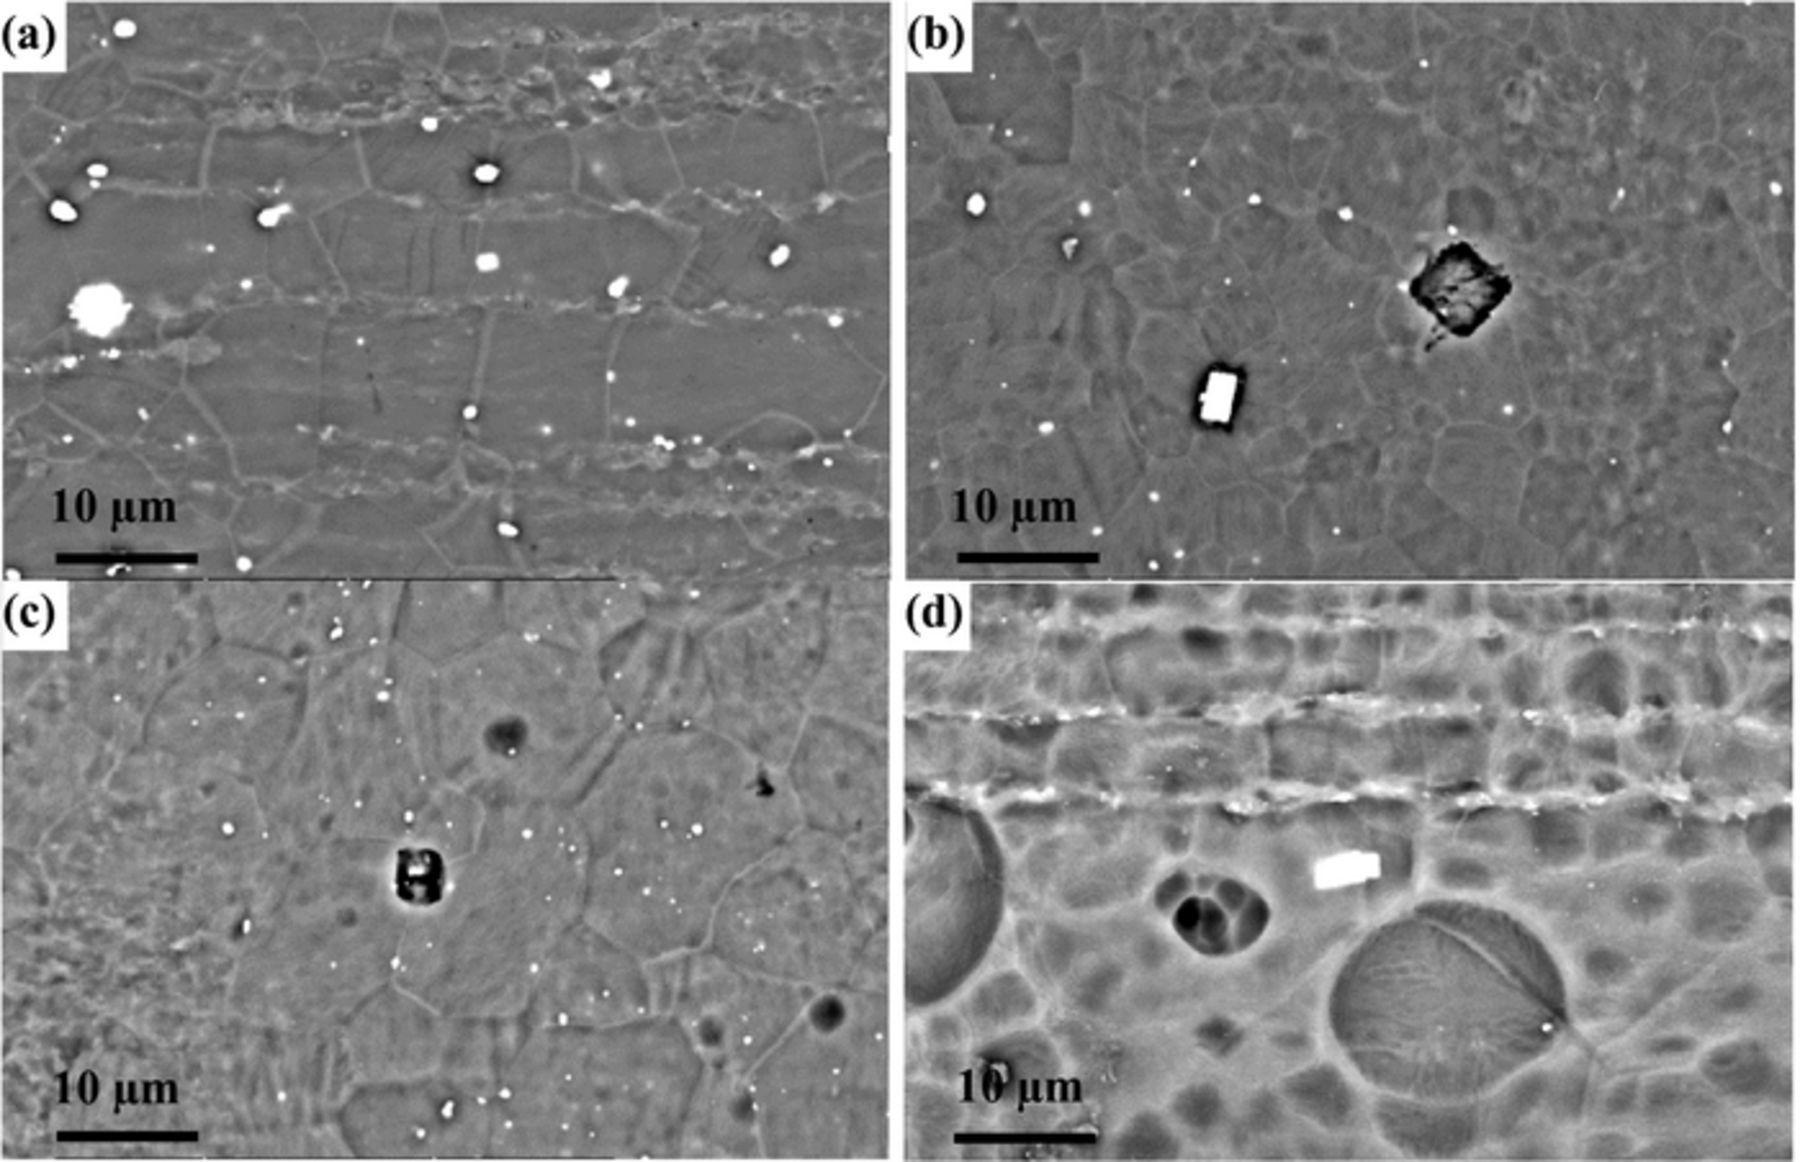
Figure 9. BSE-SEM morphologies of extruded EW75 after immersion in 3.5 wt% NaCl solution for: (a) 10 min, (b) 30 min, (c) 2 h, and (d) 24 h.
Surface films
The morphologies of the surface films formed on cast and extruded EW75 after immersion in 3.5 wt% NaCl solution for various time intervals are shown in Fig. 10. The films formed on the surfaces of the second phase and matrix in cast EW75 exhibit different morphologies after 10 min of immersion (Fig. 10a). The film on the Mg matrix is composed of filamentous particles,34 whereas the film on the second phases consists of sheets. The different morphologies of the two areas may be due to preferential dissolution of the second phases during microgalvanic corrosion or the different RE oxide and hydroxide contents of the films. With increasing immersion time, the film on the surface of the cast EW75 turns into uniform and homogeneous (Fig. 10b). In contrast, the film on the surface of extruded EW75 is always uniform, and the filamentous particles are coarser than those on cast EW75, which may be due to the high RE content in extruded EW75 surface film (Fig. 10d). At an immersion time of 60 h, loose and spongy corrosion products exist on the surface film of cast EW75 (Fig. 10c). This indicates that the surface film on cast EW75 is no longer compact and protective. However, the surface film on extruded EW75 is compact and intact after 60 h of immersion (Fig. 10e), and it is still compact and protective even after 7 d of immersion, but the morphology changes from filamentous particles to short belts (Fig. 10f).
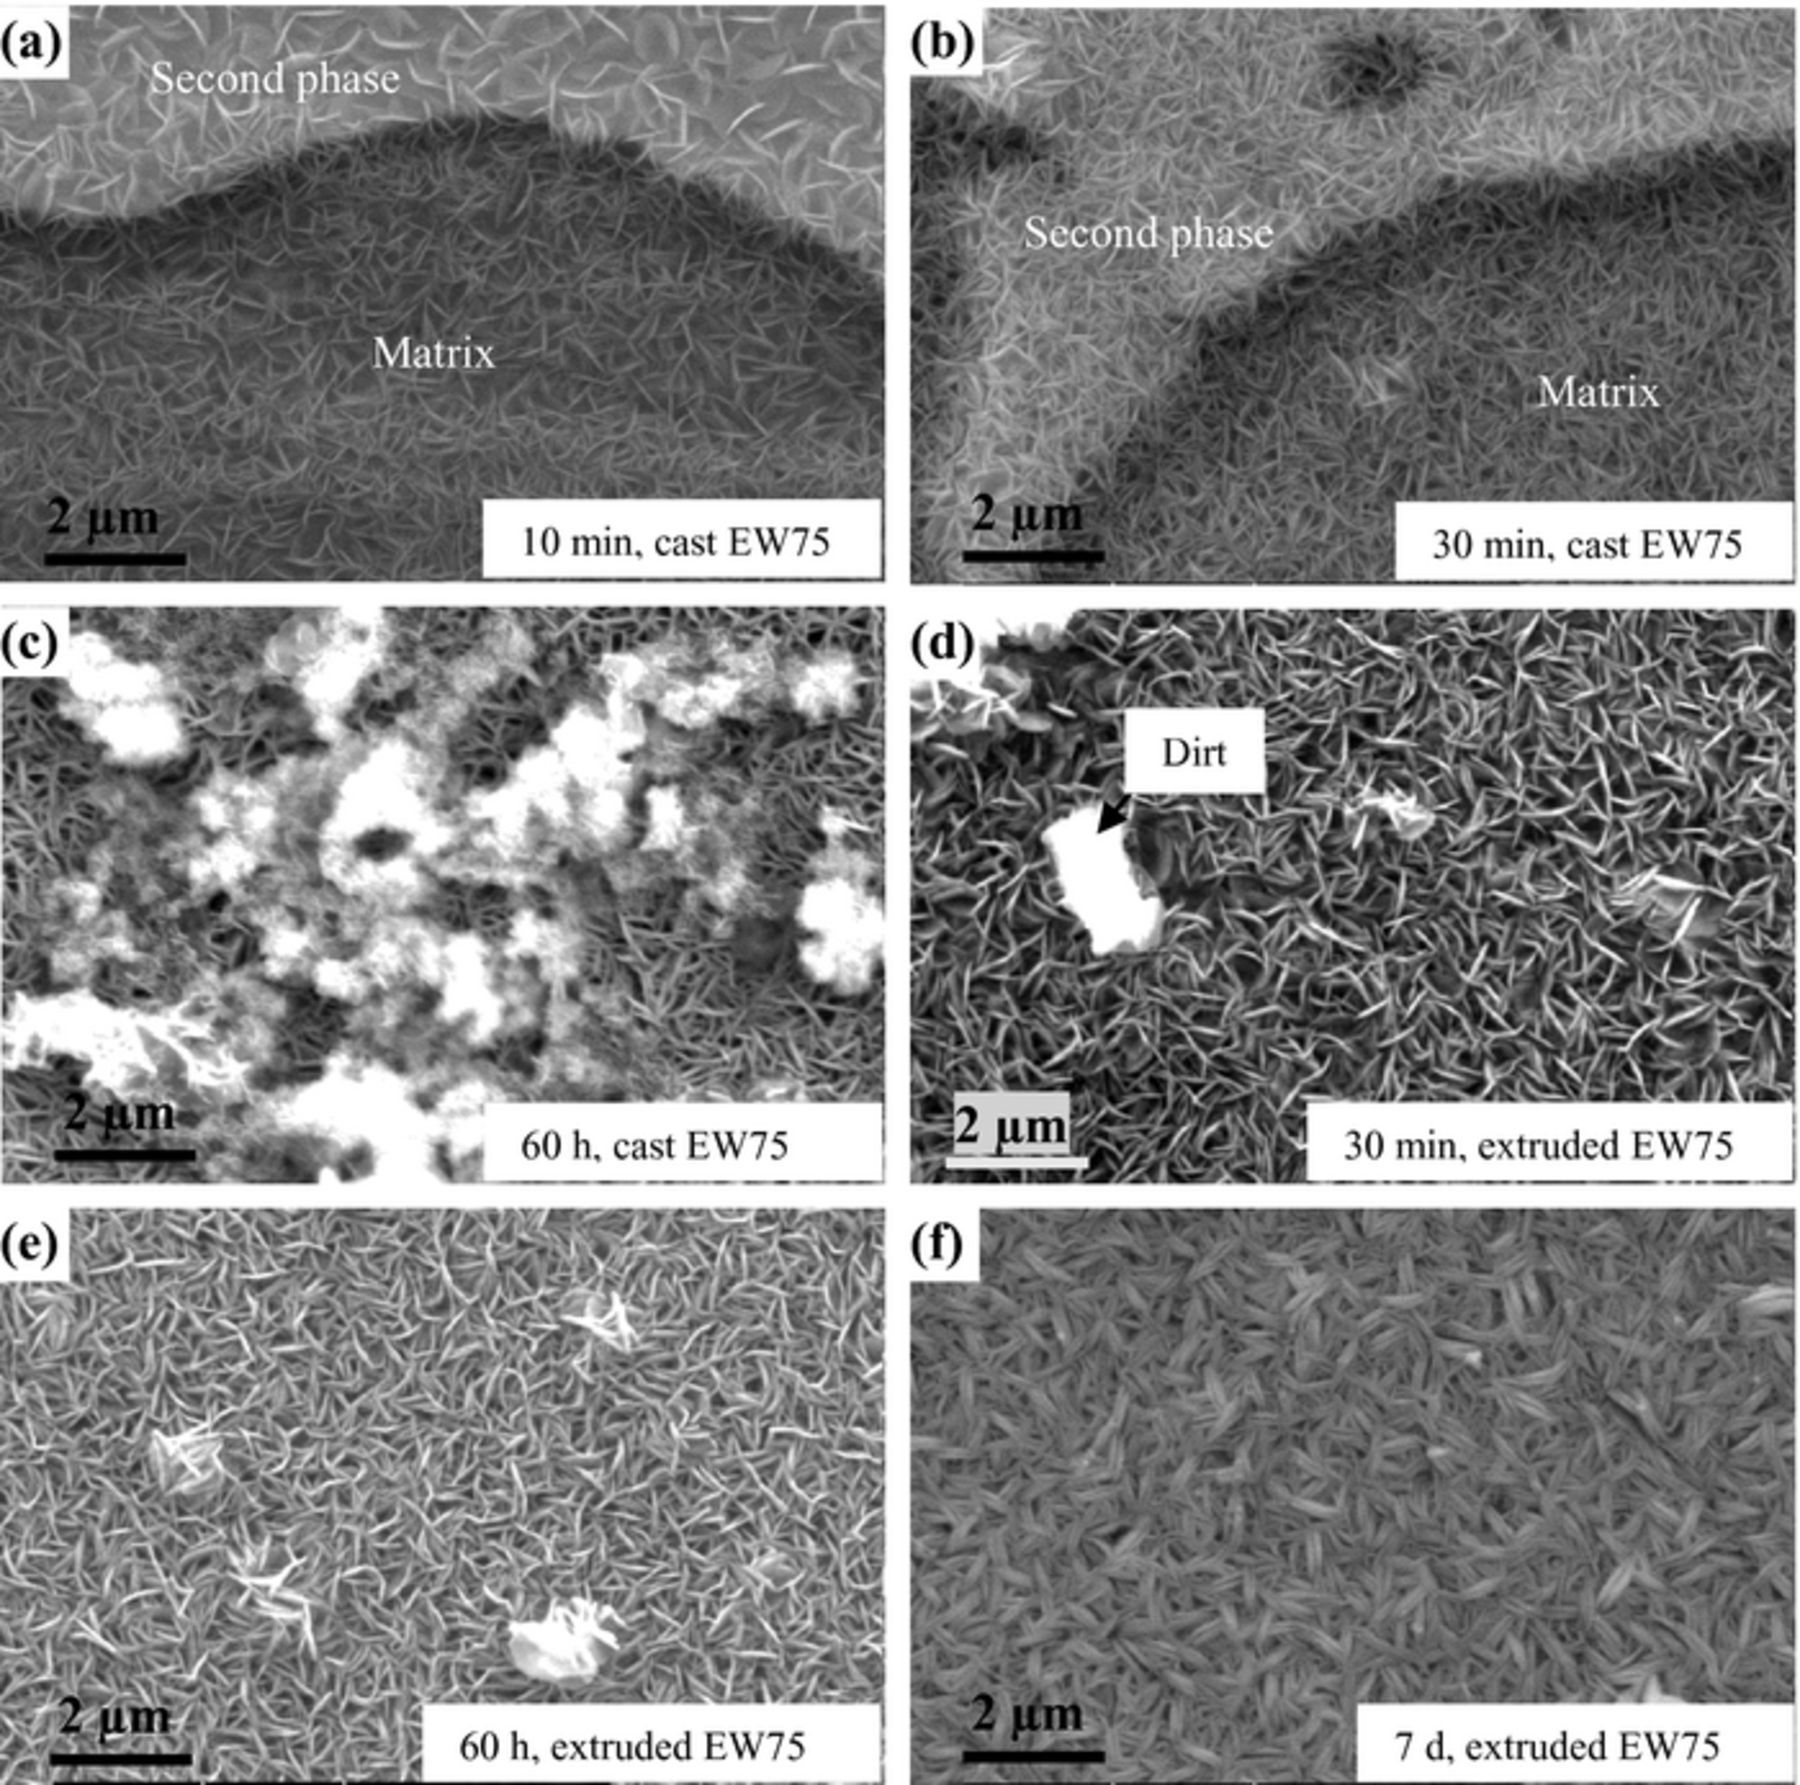
Figure 10. SE-SEM morphologies of the surface films formed on cast and extruded EW75 after immersion in 3.5 wt% NaCl solution for various time intervals: (a) 10 min, (b) 30 min, and (c) 60 h for cast EW75; (d) 30 min, (e) 60 h, and (f) 7 d for extruded EW75.
The cross-sectional morphologies of the two surface films formed after 15 h of immersion are shown in Fig. 11, and the EDX results are listed in Table V. The surface film on cast EW75, approximately 7.1 μm, is much thicker than that on extruded EW75, approximately 3.4 μm, indicating rapid corrosion of cast EW75 substrate. On the other hand, more cracks appear in the film on cast EW75, and the cracks are also much larger. These differences can be attributed to the different composition, especially the concentration of REs including Y, Gd, and Nd (Table V). The RE content of extruded EW75 is almost twice that of cast EW75, leading to formation of a more protective surface film on extruded EW75. Because most of chlorides are soluble, only occasional residues were detected in the films. As a result, the Cl ion content in the cast and extruded oxide is similar.
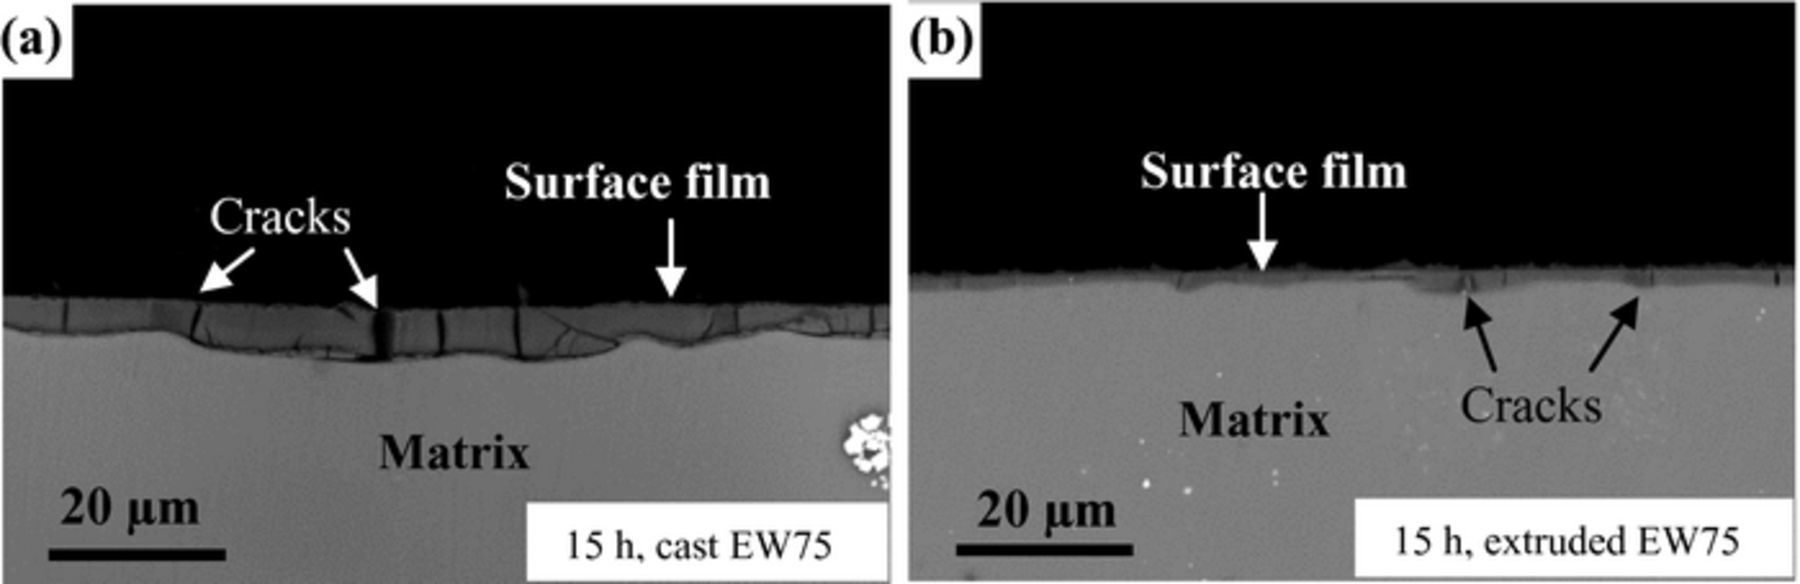
Figure 11. BSE-SEM cross-sectional morphologies of surface film of cast and extruded EW75 after immersion in 3.5 wt% NaCl solution for 15 h.
Table V. EDX results of surface films (wt%).
| O | Mg | Y | Gd | Cl | Nd | |
|---|---|---|---|---|---|---|
| Cast EW75 | 37.22 ± 5.23 | 42.42 ± 6.32 | 7.25 ± 0.56 | 11.33 ± 0.68 | 1.78 ± 0.10 | – |
| Extruded EW75 | 26.03 ± 4.05 | 32.46 ± 4.25 | 12.5 ± 0.36 | 23.23 ± 0.74 | 1.79 ± 0.11 | 4.00 ± 0.13 |
Discussion
Comparison of corrosion resistance between cast and extruded EW75
The corrosion resistance of cast and extruded EW75 was investigated by weight loss, electrochemistry, and hydrogen evolution analysis in this work. To determine the corrosion resistance of both alloys clearly, the corrosion rates measured by these three methods are converted into the same units.
For the weight lost tests, the corrosion processes include the dissolution of Mg and REs with mass fractions of Gd: 7.04%, Y: 4.53%, Nd: 1.29%, and Mg: 87.14%. The corrosion rate, Pm (mm y−1), is converted from the weight loss rate, ΔWm (mg cm−2 d−1), using Equation 1.35,36
![Equation ([1])](https://content.cld.iop.org/journals/1945-7111/163/14/C856/revision1/d0001.gif)
where ρ is the density (g cm−3) of the metals.
The hydrogen evolution reaction of one mol (i.e., 22.4 L) requires two mol of electrons, and the atomic fractions of Y, Gd, Nd, and Mg in EW75 are 1.39, 1.22, 0.24, and 97.14 (%), respectively. Therefore, the weight loss rate, ΔWm, can be evaluated in terms of the hydrogen evolution rate, VH (mL cm−2 d−1), using Equation 2.
![Equation ([2])](https://content.cld.iop.org/journals/1945-7111/163/14/C856/revision1/d0002.gif)
M is the atomic mass (g mol−1), and n is the number of free electrons (nMg = 2, nREs = 3).
Thus, the corrosion rate, PH (mm y−1), is evaluated in terms of the hydrogen evolution rate using Equation 3.
![Equation ([3])](https://content.cld.iop.org/journals/1945-7111/163/14/C856/revision1/d0003.gif)
Polarization curves are measured at the exposed fresh Mg surface, which reveals mainly the corrosion mechanism in the initial stage of corrosion. The corrosion rate, Pi (mm y−1), is calculated using Equation 4.
![Equation ([4])](https://content.cld.iop.org/journals/1945-7111/163/14/C856/revision1/d0004.gif)
The corrosion rates of cast and extruded EW75 estimated by the hydrogen evolution (PH, 7 d), mass loss (Pm, 7 d), and polarization techniques (Pi) are listed in Table VI. All of the values of PH, Pm, and Pi for cast EW75 are higher than those for extruded EW75, which indicates that extruded EW75 exhibits better corrosion resistance than cast EW75. Further, the values of Pm and PH are similar, but Pi differs greatly from them. Pm and PH are calculated on the basis of the long-term corrosion behavior (7 d of immersion), whereas Pi is calculated on the basis of the initial corrosion process. Thus, the PH values of cast and extruded EW75 after 1 h of immersion are calculated for comparison with the Pi values and are found to be 0.529 and 0.306 mm y−1, respectively. However, they are still not in good agreement with the value of Pi. The same discrepancy has already been reported by Shi et al.37 The possible reasons are that the Tafel extrapolations do not give correct estimates of the corrosion rate of magnesium because the corrosion of magnesium violates the fundamental requirements of the Tafel extrapolation method. It is known that a single anodic or cathodic reaction is needed for Tafel extrapolation to give a valid measure of the corrosion rate. However, the polarization of magnesium violates this requirement because not only dissolution of magnesium but also hydrogen evolution reaction occurs at the anodic site.38 Therefore, the corrosion rate calculated in terms of the polarization does not coincide with the hydrogen evolution rate. Nevertheless, polarization tests are a very useful technique for comparing the corrosion resistance of different Mg alloys in the initial corrosion stage as well as interpreting their corrosion mechanisms.
Table VI. Corrosion rates of cast and extruded EW75 evaluated by hydrogen evolution (PH, 7 days), mass loss (Pm, 7 days) and polarization technique (Pi).
| Specimens | PH (mm y−1) | Pm (mm y−1) | Pi (mm y−1) |
|---|---|---|---|
| Cast EW75 | 3.15 ± 0.13 | 3.42 ± 0.15 | 2.72 ± 0.3 |
| Extruded EW75 | 0.325 ± 0.02 | 0.298 ± 0.01 | 1.12 ± 0.14 |
Another observed phenomenon is that the hydrogen evolution rate increases with increasing immersion time, especially for cast EW75 after a long immersion time (Figs. 4a and 4b). The reason is that the surface film of cast EW75, which has many cracks, is less protective than that of extruded EW75. When the film becomes loose and spongy after a long immersion time, it exhibits a poisoning effect due to the enrichment of corrosive media in the film to accelerate the microgalvanic corrosion.39 In addition, the increased hydrogen evolution rate may be associated with cathodic activation of the corroded regions, since the cathodic kinetics on Mg alloys can increase from corroded areas.40
Overall, the hydrogen evolution, electrochemistry, and immersion test results indicate that the corrosion resistance of extruded EW75 is much better than that of cast EW75. The main reasons for the difference can be attributed to different microgalvanic corrosion behaviors and surface film effects. The detailed reasons are described below.
Different microgalvanic corrosion behavior
According to the XRD and EDX results, the types of second phases in cast and extruded EW75 are similar, namely, Mg–RE intermetallic compounds. Therefore, microgalvanic corrosion can occur in both materials because of the different activity of the second phases and Mg matrix.
In cast EW75, the large second phases are distributed along grain boundaries (Fig. 3c). Consequently, microgalvanic corrosion should aggravate intergranular corrosion. Further, relatively severe microgalvanic corrosion clearly occurs in cast EW75, where the large second phases work as microanodes (Fig. 8). In contrast, the very fine second phases in extruded EW75 are distributed uniformly on the entire surface, and microgalvanic corrosion has no influence on intergranular corrosion. In the corrosion behavior of extruded EW75 (Fig. 9), a few shallow pits occur, and these pits are possibly left by dissolution of the very fine block-shaped second phases. In addition, the macromorphology observations show that extruded EW75 exhibits relatively uniform corrosion, which can be attributed to the weak microgalvanic corrosion process. When extruded EW75 is immersed in the corrosive solution, the exposed fine second phases will first dissolve owing to their microanodic role according to our previous work.24 Then few second phases are exposed on the surface. Therefore, the microgalvanic corrosion between the second phases and the Mg matrix can no longer drive the corrosion process. Then, dissolution of the Mg matrix begins because of nonuniformities in the microstructure such as defects and variations in the chemical composition. Generally, the dissolution rate would be much slower. When the surface of the Mg matrix is corroded, the interior second phases are exposed to the corrosive solution again. The microgalvanic corrosion between the second phases and the Mg matrix would be triggered another time. The corrosion process will cycle in this way. As a result, there are no large holes or corrosion pits on the surface of extruded EW75. In contrast, microgalvanic corrosion between the second phases and the matrix occurs all the time in cast EW75 because the second phases are so large that they are visible in any cross section.
Because the second phases have a more negative Volta potential than the Mg matrix,24 the second phases are more active and act as microanodes, so they corrode first. On the other hand, the abundant REs in the second phases can improve the protective ability of the surface film and reduce the corrosion of the second phases. Both the surface film and Volta potential affect the dissolution of the second phases. When the effect of the Volta potential dominates the process, the second phases will dissolve.
In addition, the solubility of REs in the Mg matrix is improved by the high temperature used in the homogenization treatment and deformation process, and more REs are diffused into the Mg matrix. Thus, the matrix of extruded EW75 with higher REs concentrations will present a lower potential difference between second phases and matrix that further affects the microgalvanic corrosion. As a result, the microgalvanic corrosion in cast EW75 should be more severe than that in extruded EW75.
Different surface film effects
A surface film can strongly affect the corrosion resistance of metals such as stainless steel, aluminum alloys, and also Mg alloys.41-45 For Mg alloys, the addition of REs can improve the properties of surface films.25–27 The most common phenomenon is that surface films of EW75 (both cast and extruded) appear golden-yellow to the naked eye, unlike those of other Mg alloys.
Considering the other experimental results, the quantity, size, and distribution of the second phases obviously have a significant effect on the properties of the surface films. It can be observed from the morphologies that the surface film on extruded EW75 is more even and compact than that on cast EW75 for the same immersion time. In particular, it remains compact and protective after a much longer immersion interval. In addition, the dimension of the medium-capacitance loop (value of Rf) of extruded EW75 is larger than that of cast EW75 (Fig. 7), which indicates a more protective surface film on extruded EW75. This result can be attributed to the fact that the very fine and discrete second phases in extruded EW75 are dissolved preferentially by microgalvanic corrosion. Consequently, homogeneous product films consisting of RE oxides or hydroxide can be formed on the surface of the Mg substrate. Because the RE-containing oxides appear in the product films, the amount of defects in the MgO/Mg(OH)2 layer (which appear because the P/B value of MgO is smaller than 1) decreases, and the surface film becomes denser and more compact. In contrast, most of the REs are bound in the large second phases in cast EW75, which would lead to a nonuniform surface film. Namely, the film on the surface of the Mg matrix consists mainly of MgO/Mg(OH)2 in the absence of sufficient RE oxides or hydroxide, whereas the film on the large second phases contains a higher concentration of RE oxides or hydroxide. Consequently, there are more defects on the surface film on the Mg matrix of cast EW75 (Fig. 10g). In addition, the hydrogen evolution rate of extruded EW75 (Fig. 4) is always slow for the entire duration of immersion, and there is no transformation point. Consequently, a continuous protective surface film is generated on the surface of extruded EW75. The development of the surface film is schematically illustrated according to the above analyses in Fig. 12. The higher hardness of the second phases in cast and extruded EW75 cause them to protrude from the Mg matrix after polishing (Figs. 12a and 12d). When the samples are immersed in the corrosive solution, corrosion reactions can occur (Figs. 12b and 12e). In this stage, the corrosion process is dominated by microgalvanic corrosion between the second phases and the Mg matrix. Of course, Mg dissolves through the reaction
![Equation ([5])](https://content.cld.iop.org/journals/1945-7111/163/14/C856/revision1/d0005.gif)
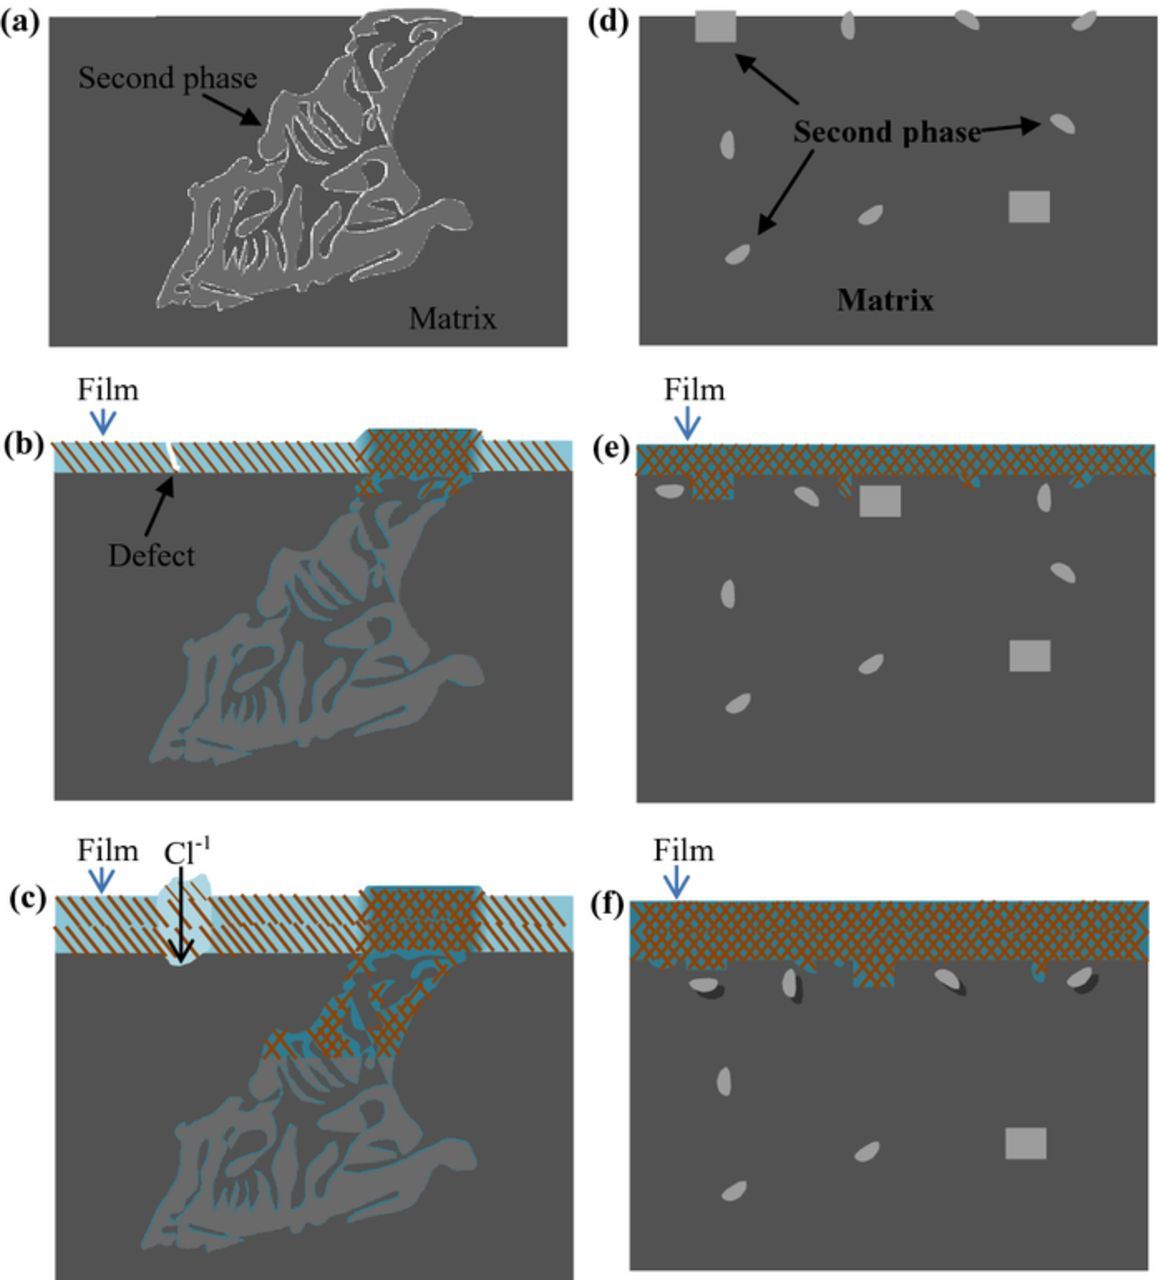
Figure 12. Schematic illustration for the development of surface film with increasing immersion time: Cast EW75 (a) polished, (b) immersion for a short time interval, and (c) immersion for a long time interval; Extruded EW75 (a) polished, (b) immersion for a short time interval, and (c) immersion for a long time interval.
At the same time, the film formation reaction accompanies dissolution of Mg:
![Equation ([6])](https://content.cld.iop.org/journals/1945-7111/163/14/C856/revision1/d0006.gif)
Part of the Mg(OH)2 can dehydrate to form MgO after exposure to air:
![Equation ([7])](https://content.cld.iop.org/journals/1945-7111/163/14/C856/revision1/d0007.gif)
Hence, the entire sample surface is gradually covered by a product film. For cast EW75, the films on the surfaces of the Mg matrix and the second phases are different. Because more REs exist in the second phases, their film would be more compact and protective. On the other hand, some defects may appear in the film on the Mg matrix. In contrast, the film on the entire surface of extruded EW75 is more even and homogeneous owing to the uniform distribution of REs and the very fine second phases. With increasing immersion time, the filamentous particles in the films broaden and the thickness of the films increases owing to the reaction processes of oxidation, dissolution, and deposition (Figs. 12c and 12f). Further, parts of the film become porous, and the corrosive solution, especially Cl−1, could pass through the film along the defects to corrode the substrate of cast EW75 (Fig. 12c). However, the film on the surface of extruded EW75 is improved by the presence of RE oxides or hydroxide with fewer defects, and it can remain compact and protective after long-term immersion (Fig. 12f).
It is known that SS treatment needs to be applied to the cast alloy before extrusion deformation. To determine the key factor affecting the difference in the corrosion resistance of cast and extruded EW75, i.e., the SS treatment or the extrusion process, the microstructure and corrosion resistance of SS-treated EW75 was investigated. After SS treatment, just a few block-shaped second phase particles are observed on the surface of the sample, and most of the dendritic second phases are dissolved into the Mg matrix (Fig. 13). The matrix is a supersaturated solid solution at this time. The weight loss rate of the SS-treated sample after immersion in 3.5 wt% NaCl solution for 7 d is 0.707 g m−2 h−1, which is close to that of cast EW75 (0.747 g m−2 h−1) and much higher than that of extruded EW75 (0.065 g m−2 h−1). The corrosion resistance of the SS-treated sample is relatively poor because the REs do not easily participate in the rapid formation of the surface film by microgalvanic corrosion between the second phases and the Mg matrix. The better corrosion resistance of extruded EW75 is mainly attributed to the extrusion process at high temperature which can alter the volume fraction, size, and distribution of second phases.
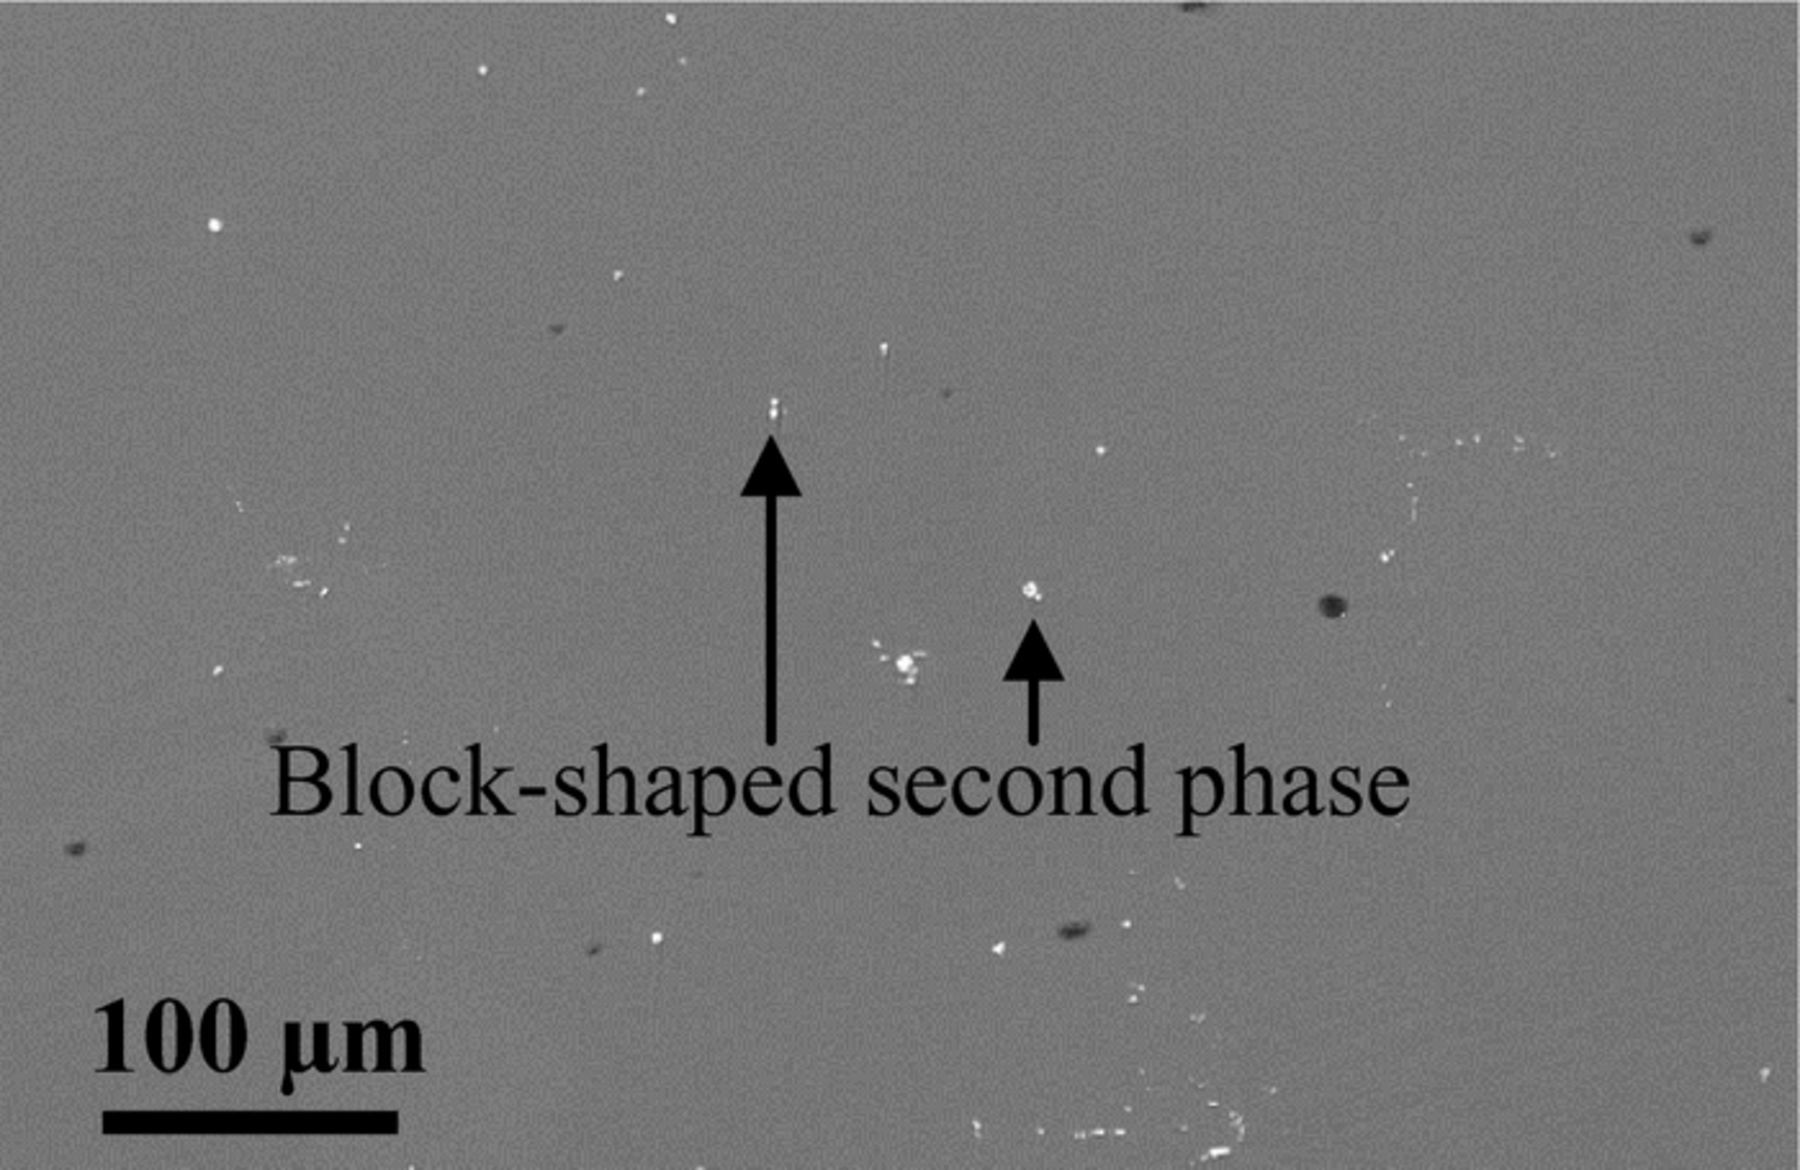
Figure 13. BSE-SEM surface morphology of SS-treatment sample.
Overall, the weaker microgalvanic corrosion and more uniform and compact surface film give extruded EW75 a lower corrosion rate and better corrosion resistance than cast EW75.
Conclusions
- (1)In cast EW75, large second phases are distributed along the grain boundaries, and RE enrichment of the Mg matrix exists around grain boundaries. However, in extruded EW75, small second phases and RE elements are distributed homogeneously in the Mg matrix. The volume fraction of second phases in extruded EW75 is much lower than that in cast EW75.
- (2)Cast EW75 exhibits relatively severe microgalvanic corrosion between the second phases and the Mg matrix, whereas extruded EW75 exhibits weaker microgalvanic corrosion.
- (3)The surface film on cast EW75 fails after a relatively short immersion time, whereas the surface film on extruded EW75 retains good protective ability after a long immersion time.
- (4)Extruded EW75 exhibits much better corrosion resistance than cast EW75 owing to the effect of microgalvanic corrosion and surface film formation resulting from extrusion deformation.
Acknowledgments
Thanks for the financial support by the National Natural Science Foundation of China (No. 51471174), the National Key Basic Research Program of China (No. 2013CB632205), and the National Key Research and Development Program of China (No. 2016 YFB0301105).