
Abstract
The Mg-doped LiMnPO4 nanoplates with orthorhombic olivine structure were prepared by a simple solvothermal method. The effects of the Mg dopant on the structure and electrochemical performance of LiMnPO4 are investigated. The X-ray diffraction pattern shows that Mg doping does not change the crystal structure of LiMnPO4. High-resolution transmission electron microscopy images and selected area electron diffraction patterns show that, like the LiMnPO4 nanoplates, the crystallographic facet of the LiMn0.95Mg0.05PO4 nanoplates is the (100) plane, which places the 1D Li+ conduction path, the b axis, in the platelets. Chemical delithiation shows that the volume mismatch across the LiMnPO4/MnPO4 two-phase interface is reduced by Mg doping, and TEM images show that the interface intersects the b axis, thereby controlling the rate and extent of Li+ insertion by the mobility of the interface. Reduction of the mismatch across the interface increases its mobility and therefore the electrochemical performance of the olivine as a cathode material.
Export citation and abstract BibTeX RIS
The voltage V = 4.1 V versus Lithium of the olivine LiMnPO4 is well-matched to the HOMO at 4.3 V of the organic liquid carbonate electrolytes used in a Li-ion battery.1,2 However, the ordered olivine structure only supports rapid 1D Li+ transport along the b axis of space group Pnma.3–5 Moreover, a displacive phase change between the LiMnPO4 and MnPO4 structure results in a two-phase Li insertion/extraction reaction, which gives a flat V(q) profile (q represents state of charge) and a poor electronic conductivity (<10−10 S cm−1 at 300 K).6 With well-ordered, carbon-coated LiFePO4 nanoplatelets, high capacities at fast charge/discharge rates for thousands of cycles can be obtained.7 This excellent performance is the result of particle platelets having the b axis perpendicular to the plates and the FePO4/LiFePO4 interface parallel to the b axis.8,9 The performance of LiMnPO4 is much poorer because its nanoplatelets contain the b axis and the MnPO4/LiMnPO4 interface intersects the b axis and has a larger volume and site-symmetry mismatch.10 Substitution of a small amount of Mg and/or other dopants for Mn has been reported to improve the electrochemical performance of LiMn1−xMgxPO4.1,11–16 In this paper, we investigate the origin of this enhanced performance in LiMn1−xMgxPO4 and attribute it to a decrease in the volume change across the two-phase interface as the result of a decrease in a cooperative octahedral-site distortion by orbital ordering on the Mn3+ ions.
Experimental
The LiMnPO4 nanoplates were synthesized by a solvothermal method as reported elsewhere.10 With Magnesium acetate tetrahydrate (C4H6MgO4·4H2O, Alfa Aesar) as the dopant precursor, a sample of LiMn0.95Mg0.05PO4 was prepared with the same procedure.
The chemical extraction of lithium in non-aqueous medium was carried out at room temperature by stirring the LiMn0.95Mg0.05PO4 sample in an acetonitrile solution of NO2BF4 for 24 h in an argon-filled glove box. The products formed after the reaction were washed three times with acetonitrile under argon atmosphere to remove LiBF4 and dried under vacuum at ambient temperature.
Powder X-ray diffraction (XRD) patterns of the products were recorded at room temperature with a Philips X-ray diffractometer equipped with Cu Kα radiation in a step-scanning mode over the range 10–90° with a step width of 0.02° and a step time of 5 s.
Scanning electron microscopy (SEM) was performed with a JEOL JSM-5610 and FEI Strata DB235 SEM/FIB microscope. The high-resolution transmission electron microscopy (HR-TEM) images and selected-area electron diffraction (SAED) patterns were carried out on a transmission electron microscope (JEOL 2010F).
The Electrochemical performances of the samples were evaluated with a standard CR2032 coin cell. The electrodes were prepared by the same procedure used previously for LiMnPO4.10 The electrochemical performance of the samples was evaluated with an Arbin Instruments testing system (Arbin BT-2000) at room temperature and the electrochemical capacity of samples was evaluated based only on the active material weight. Electrochemical impedance spectroscopy (EIS) was carried out in a frequency range from 0.1 Hz to 100 kHz with an Ac signal of 5 mV. All tests were performed at room temperature.
Results and Discussion
XRD patterns for the LiMnPO4 and LiMn0.95Mg0.05PO4 samples are shown in Fig. 1. For comparison, the data of the position and the relative intensity of the peaks of a crystalline LiMnPO4 sample (JCPDS card No. 97-009-7763) are shown in the bottom of the figure. From Fig. 1 we can see that the Mg-doped sample gave a very similar diffraction profile to that of LiMnPO4 except for the shift of peaks to higher diffraction angles as illustrated by the (311) peak, inset of Fig. 1. All diffraction peaks of the two patterns could be fully indexed into an orthorhombic structure, space group Pnma, with the program Dicvol, and no impurities were detected.
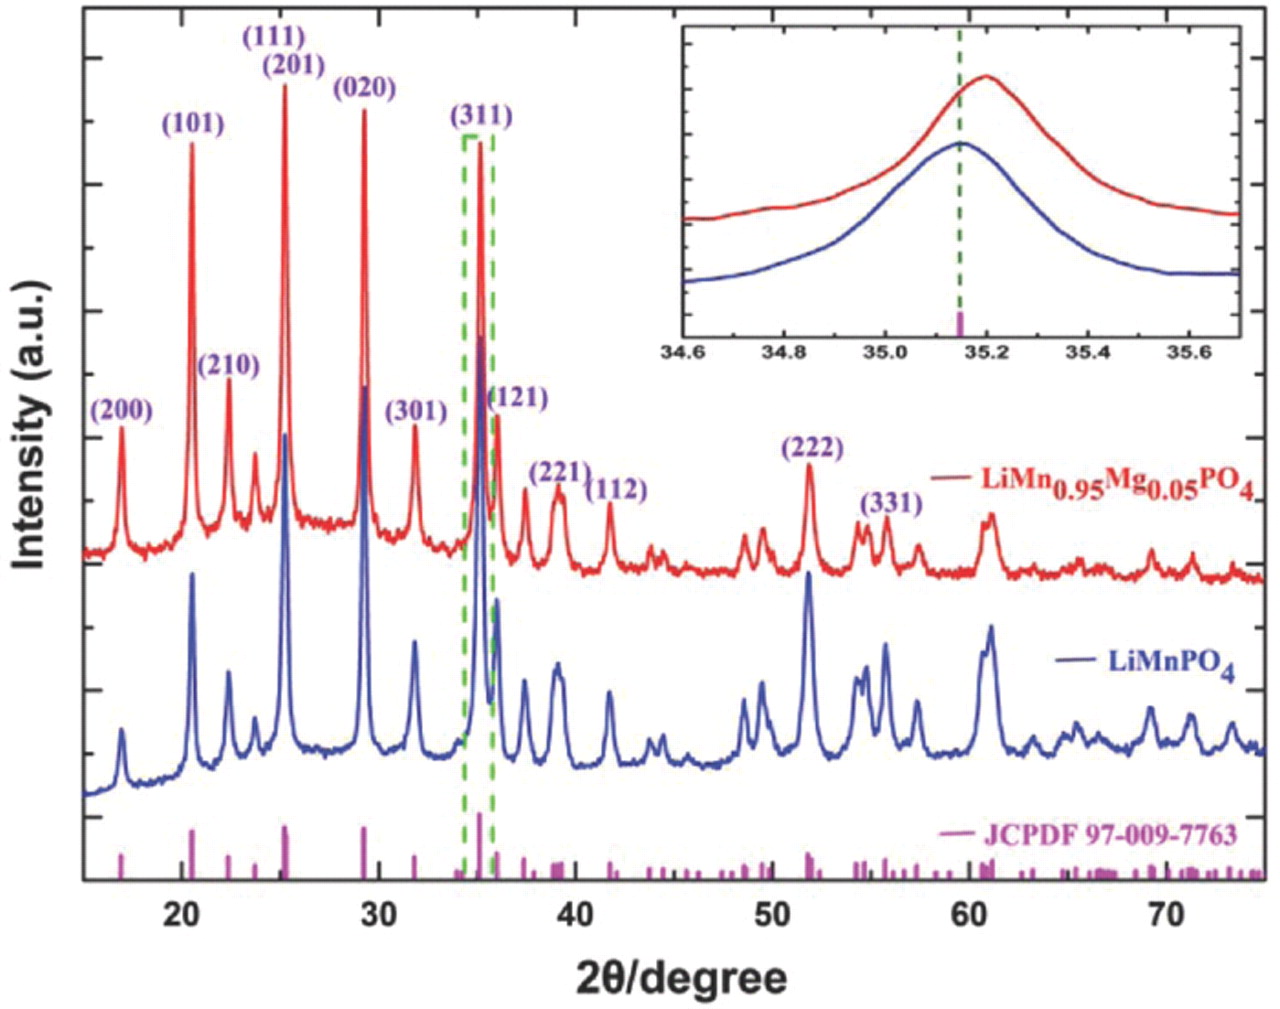
Figure 1. XRD patterns of LiMnPO4 and LiMn0.95Mg0.05PO4 samples.
In order to further explore the structural change affected by the Mg doping, a Rietveld refinement was conducted for the two samples; the refinement results, shown in Fig. 2, led to a good agreement between the experimental and the calculated XRD pattern. The reasonably small Rwp factor (11.1% for LiMnPO4 and 10.3% for LiMn0.95Mg0.05PO4) suggests that triple-phase compounds were obtained; no impurity phases were detected under the resolution of our X-ray diffractometer. Because of the similar ionic radius of Mg2+ and Li+ in octahedral coordination, some Mg2+ could be expected to occupy the Li+ site. In order to determine whether there are Mg2+ occupying Li+ sites in our samples, refinements were also performed where we substituted some Mg atoms on the lithium sites and refined the isotropic temperature parameters and/or occupation numbers for Li and Mg atoms. Either negative values of thermal parameters of Li and Mg or higher Rwp (>15%) were obtained, which implies that there is no Mg occupying lithium sites in our samples. The structural parameters of LiMn0.95Mg0.05PO4 obtained from the refinement are listed in Table I. In the orthorhombic Pnma structure, the dopant Mg occupies the 4c Mn site.
Table I. Structure parameters of LiMn0.95Mg0.05PO4 determined from X-ray diffraction.
| Atoms | Site | x | y | z | Occupancy |
|---|---|---|---|---|---|
| Li | 4a | 0.0000 | 0.0000 | 0.0000 | 0.500 |
| Mn | 4c | 0.2819(7) | 0.2500 | 0.9767(2) | 0.475 |
| Mg | 4c | 0.2819(7) | 0.2500 | 0.9767(2) | 0.025 |
| P | 4c | 0.1042(4) | 0.2500 | 0.3519(6) | 0.500 |
| O1 | 4c | 0.0904(6) | 0.2500 | 0.6260(8) | 0.500 |
| O2 | 4c | 0.4649(6) | 0.2500 | 0.2374(9) | 0.500 |
| O3 | 8d | 0.1555(8) | 0.0198(3) | 0.7456(5) | 1.000 |
| Space group: Pnma (orthorhombic): | Reliability factors: Rwp :10.3% |
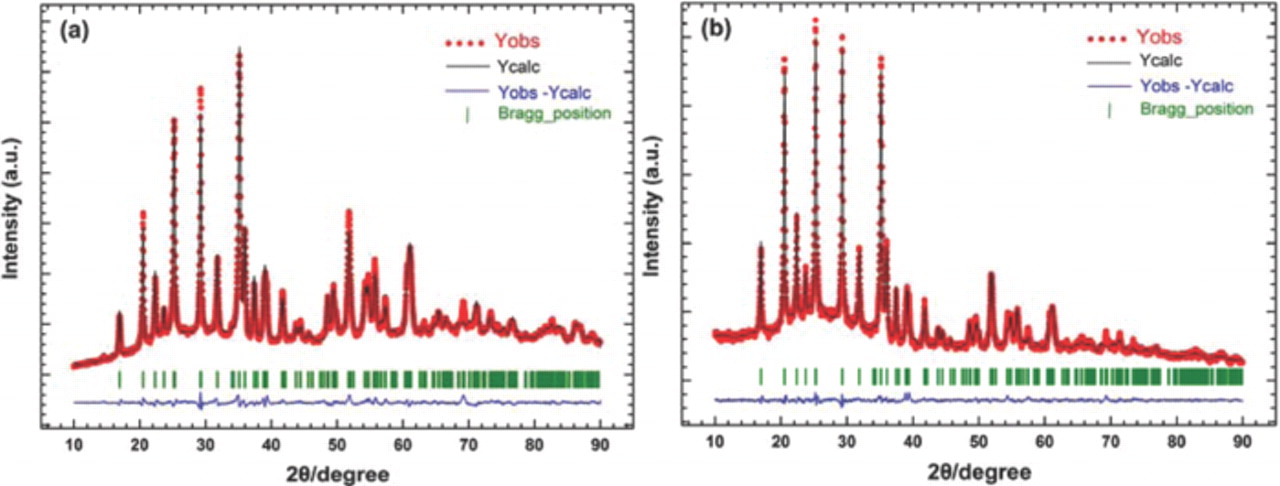
Figure 2. Rietveld refinement of the XRD patterns of the LiMnPO4 and LiMn0.95Mg0.05PO4 samples.
The lattice parameters calculated by refining the XRD patterns are shown in Table II. Substitution of the smaller Mg2+ ion clearly results in a decrease of the cell volume from 304.51 Å3 for LiMnPO4 to 302.94 Å3 for LiMn0.95Mg0.05PO4. These observations indicate that the Mg substitution was successfully achieved to form a LiMn0.95Mg0.05PO4 solid solution.
Table II. The change of the lattice parameters for LiMnPO4 and LiMn0.95Mg0.05PO4 samples.
| Samples | a (Å) | b (Å) | c (Å) | V (Å3) |
|---|---|---|---|---|
| LiMnPO4 | 10.743(4) | 6.111(7) | 4.758(2) | 304.51 |
| LiMn0.95Mg0.05PO4 | 10.452(6) | 6.101(1) | 4.751(3) | 302.94 |
Fig. 3 presents the SEM images of LiMnPO4 and LiMn0.95Mg0.05PO4 samples. Both samples form nanoplates like bamboo leaves with a width of around 500 nm and length of around 2 um; no significant difference is observed in the morphologies of the two samples, but the LiMn0.95Mg0.05PO4 samples are more compact. The EDS mappings (Fig. 4) indicate that like the elements Mn, P and O, the substituted Mg have a fairly uniform distribution in LiMn0.95Mg0.05PO4.
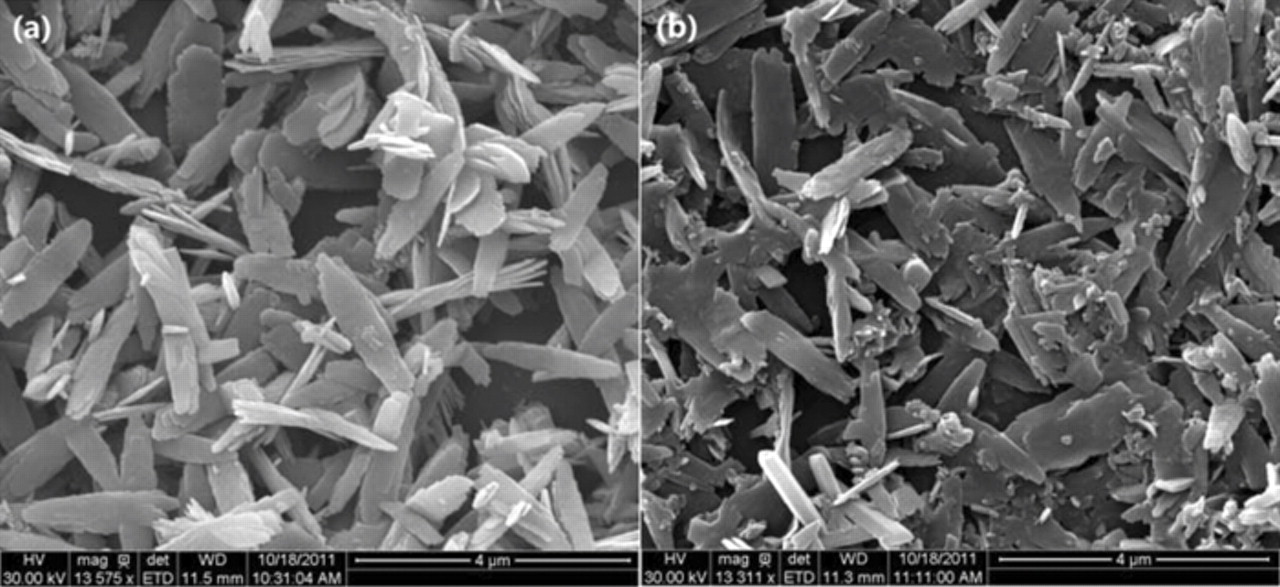
Figure 3. the SEM images of LiMnPO4 and LiMn0.95Mg0.05PO4 samples.
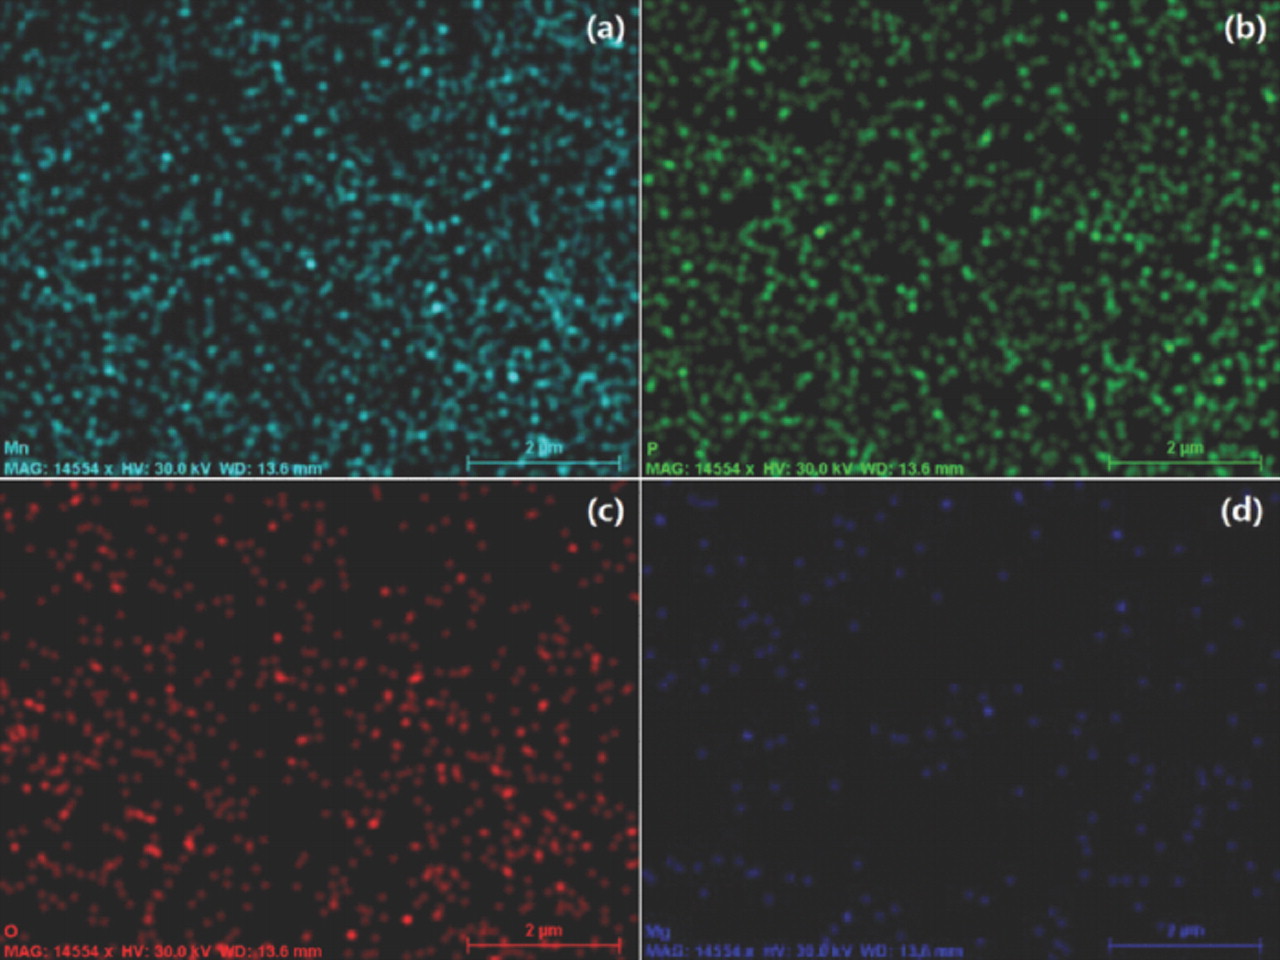
Figure 4. The EDS mappings of (a) Mn; (b) P; (c) O and (d) Mg for the LiMn0.95Mg0.05PO4 sample.
Nanoplates were analyzed with TEM. Fig. 5 shows the HR-TEM images and SAED pattern of the LiMnPO4 and LiMn0.95Mg0.05PO4 nanoplates, respectively. The nearly identical interplanar spacing of 3.047 Å, 3.740 Å in Fig. 5a and 3.044 Å, 3.738 Å in Fig. 5c can be identified as the (020) and (011) lattice planes, respectively, indicating that the LiMnPO4 and LiMn0.95Mg0.05PO4 nanoplates have the same crystallographic facet, i.e. the (100) plane. The corresponding selected area electron diffraction patterns (Fig. 5b and 5d) also indicate the (100) plane in the platelets and the single-crystal nature of the nanoplates. However, the LiMn0.95Mg0.05PO4 nanoplates present a more perfect crystal.
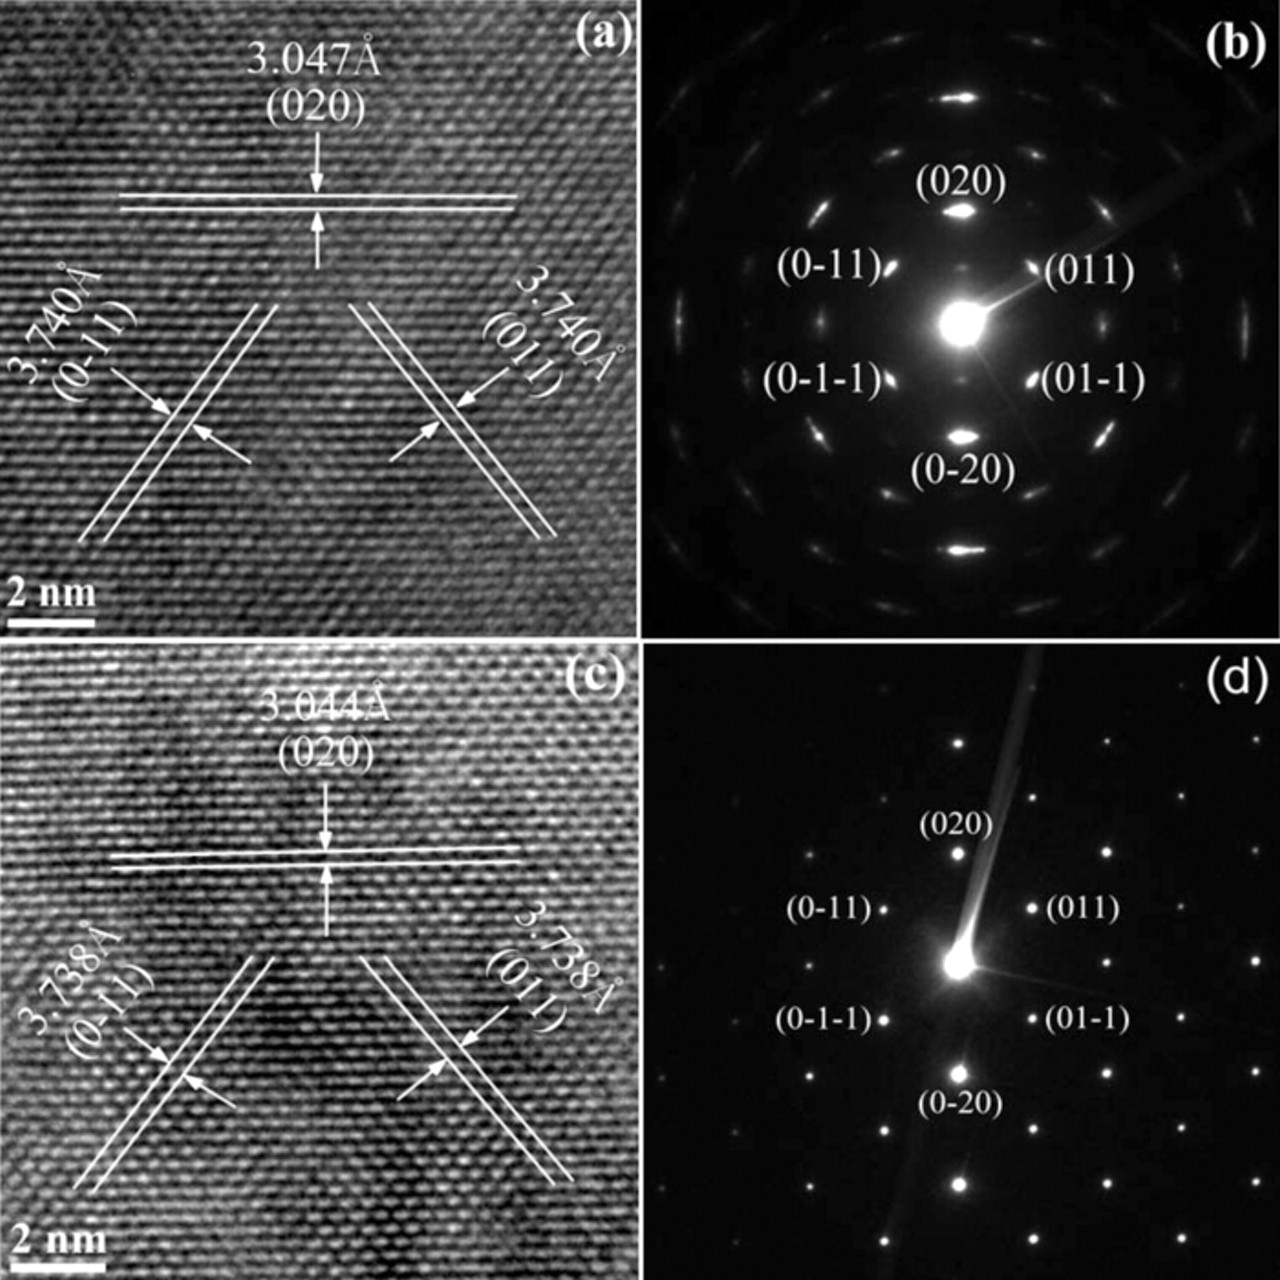
Figure 5. The HR-TEM images (a), (c) and the SAED pattern (b), (d) for the LiMnPO4 and LiMn0.95Mg0.05PO4 nanoplates respectively. Stripe separations were obtained with the Digital Micrograph software that is designed for this microscope; it reads directly to 3 decimals, but it does not mean that the resolution of the microscope reaches 0.001 Å.
Fig. 6 presents typical voltage profiles of the LiMn0.95Mg0.05PO4 nanoplates at various charge/discharge rates between C/10 and 2C in the voltage range between 2.5 and 4.5 V. The voltage profiles clearly show a flat redox potential around 4.1 V vs. Li/Li+, indicating that the charge/discharge reaction proceeds via a first-order phase transition. As reported by Chio et al.,8 Mg doping improves the specific capacity; but with the b axis in the plane of the platelets, the capacity is smaller than can be achieved with LiFePO4.
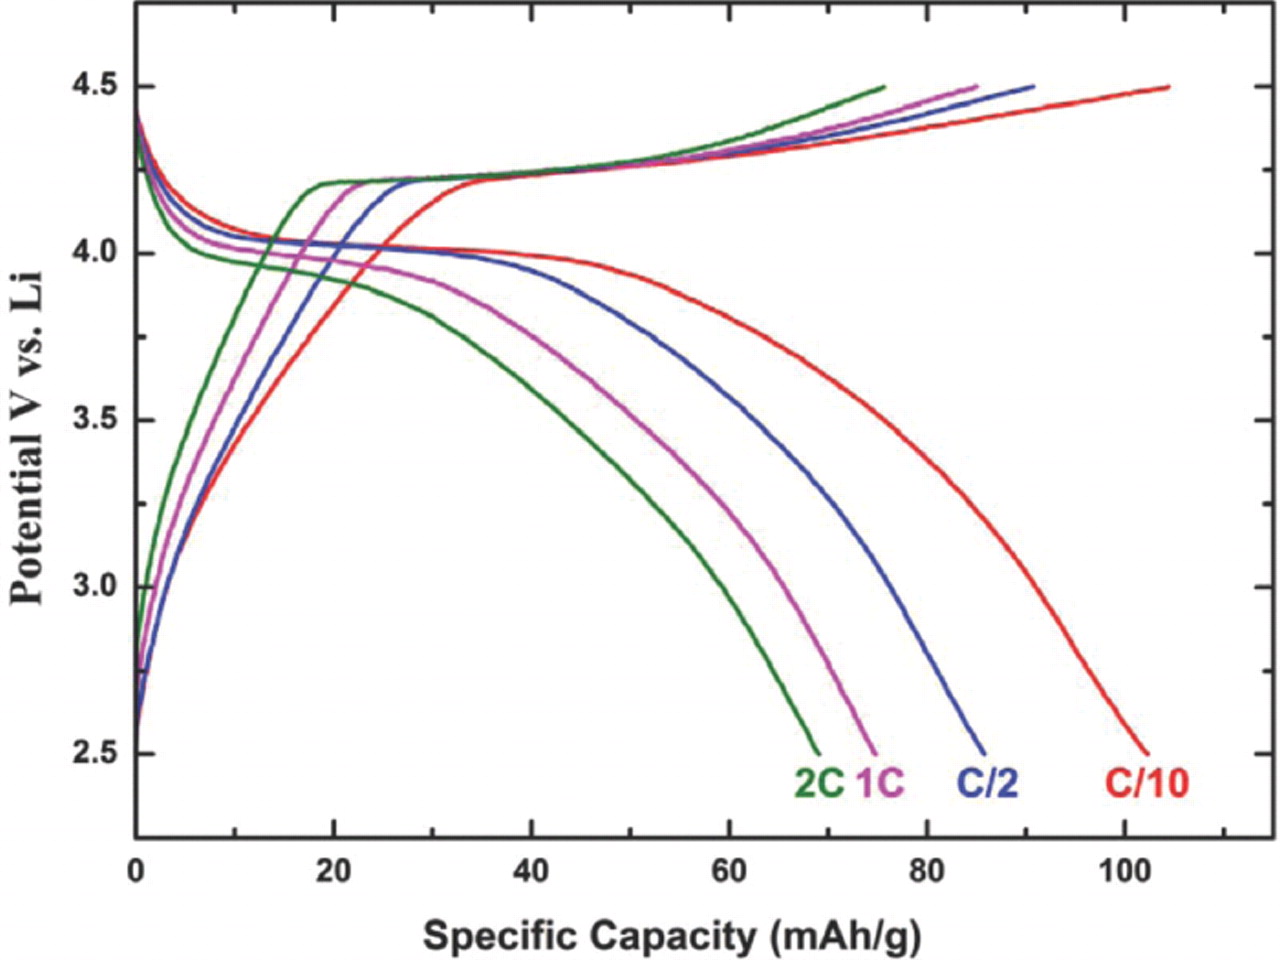
Figure 6. Typical voltage profiles of the LiMn0.95Mg0.05PO4 nanoplates at various charge/discharge rates (C/10, C/2, 1C and 2C) at room temperature.
In order to understand the structural change during extraction/ reinsertion of lithium, a series of LixMn0.95Mg0.05PO4 compositions (0 ≤ x ≤ 1), prepared by chemical delithiation of LiMn0.95Mg0.05PO4, were obtained. The x can be controlled by the initial concentration of NO2BF4 in the solution. The corresponding XRD patterns are shown in Figure 7. For comparison, the same figure shows the position and the relative intensity of the peaks of a crystalline LiMnPO4 sample (JCPDS card no. 33-0804) and MnPO4 sample (JCPDS card no. 77-0180) at the bottom and the top, respectively. According to the Laffont et al.' experimental method,9 the values of x were deduced from calibration curves of the ILiMnPO4:(ILiMnPO4 + IMnPO4) ratios of the intensities of both (200) and (210) reflections established from XRD patterns of xLiMnPO4 + (1−x)MnPO4 mixtures (prepared by simply mixing LiMnPO4 and MnPO4 powders in a mortar). Integrations and decompositions of the diffraction peaks were made with the FullProf Suite. The extraction/reinsertion of lithium gives an obvious two phase structure. For the LiMn0.95Mg0.05PO4 sample, the unit-volume is 302.94 Å3, and for the Mn0.95Mg0.05PO4, the value is 274.98 Å3. The volume contraction is about 9.2%, which is smaller than 10% contraction in LiMnPO4. The smaller volume contraction is favorable for the electrochemical performance.
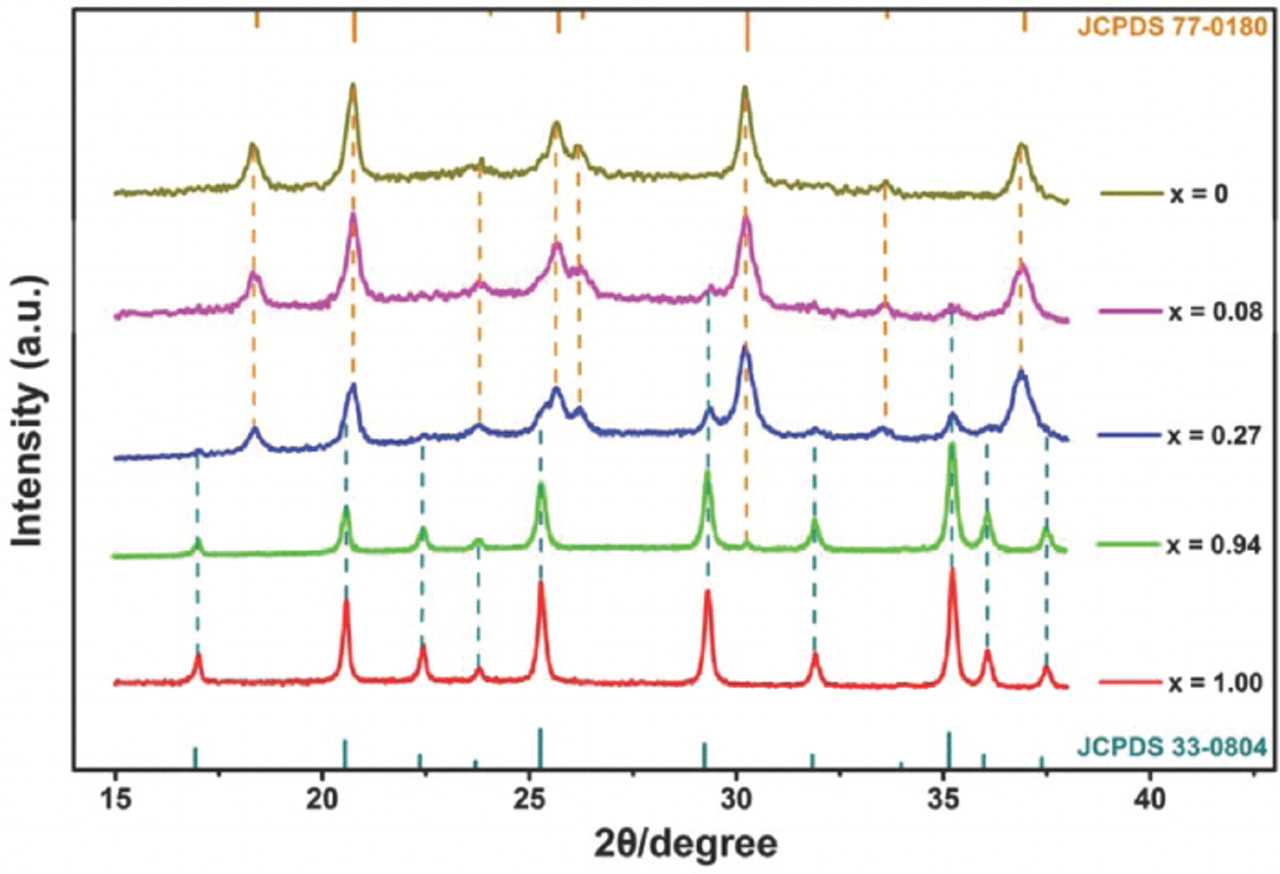
Figure 7. XRD patterns of LixMn0.95Mg0.05PO4 phases (x = 0, 0.08, 0.27, 0.94 and 1.00).
The cycle performance of the LiMn0.95Mg0.05PO4 nanoplates is given in Fig. 8. In order to investigate the rate capability during cycling, various current rates of C/10, C/2, 1C and 2C were applied to the working electrode. It is clear that LiMn0.95Mg0.05PO4 has a much higher reversible capacity than LiMnPO4 at different discharge rates. The initial discharge capacity at C/10 is 116.6 mAh/g for the LiMn0.95Mg0.05PO4. However for the pure LiMnPO4, the value is only 96.2 mAh/g. Even at the higher discharge rate 2C, a discharge capacity of 69.8 mAh/g has been obtained for the LiMn0.95Mg0.05PO4; for the pure LiMnPO4, the value is only 55.3 mAh/g. The increase of capacity indicates substantially enhanced electrochemical kinetics of lithium-ion extraction/insertion from/into LiMn0.95Mg0.05PO4, which was confirmed by the electrochemical impedance measurement as shown in Fig. 9. EIS plots of the LiMnPO4 and LiMn0.95Mg0.05PO4 cell were recorded at room temperature after the 1st and 30th cycles. Although the plots of both samples show a big change after the 30th cycle, a much smaller semicircle was observed for the LiMn0.95Mg0.05PO4 sample at the different cycles, which indicates a much smaller charge transfer resistance and greatly improved electrochemical kinetics of lithium ion extraction/insertion.

Figure 8. The cycle performance of the LiMnPO4 and LiMn0.95Mg0.05PO4 nanoplates at different discharge rates (C/10, C/2, 1C and 2C) at room temperature.

Figure 9. The EIS plots of the LiMnPO4 and LiMn0.95Mg0.05PO4 cell after 1st and 30th cycle.
In addition, Fig. 8 shows that LiMn0.95Mg0.05PO4 shows a relatively stable capacity, especially for higher rates. At C/10 discharge rate, the discharge capacities for the 3rd and 20th cycles of pure LiMnPO4 are 90.5 mAh/g and 85.1 mAh/g, respectively, and the mean fade of the capacity is 0.3% per cycle; the mean fade of the capacity of LiMn0.95Mg0.05PO4 is only 0.2% per cycle. However, at higher rate, the cycle performance shows better improvement for the Mg-doped sample.
A recent study9 has shown that the Jahn-Teller active Mn3+ ions give a big structural misfit at the phase boundary between LiMnPO4 and MnPO4 (ca. 9.5–11.0% volume difference), which hinders motion of the interface.7 High-spin Mn3+ in an octahedral site has a twofold orbital degeneracy; site distortions bias the cooperative ordering of the occupied orbital as reported.9 Substitution of the Mn by cations such as Mg, Fe, Ni or Zr that do not have an octahedral-site d-orbital degeneracy lowers the energy of the cooperative orbital ordering and hence the magnitude of the component of the site distortion resulting from long-range orbital order. The resulting reduction of the volume and structural mismatch across the LiMnPO4/MnPO4 interface, which intersects the b axis, makes it easier to move the interface, thus increasing the rate capability. The more perfect crystallinity of the nanoplates may also enhance the interface mobility and extent of reversible motion.
Conclusions
Mg-doped LiMnPO4 nanoplates with orthorhombic olivine structure can be prepared by a simple solvothermal method. The X-ray diffraction pattern and Rietveld refinement result show that Mg-doping does not change the crystal structure of LiMnPO4 and the dopant Mg occupies the 4c Mn site to form a LiMn0.95Mg0.05PO4 solid solution phase. High-resolution transmission electron microscopy images and selected area electron diffraction patterns show that, like the LiMnPO4 nanoplates, the crystallographic facet of the LiMn0.95Mg0.05PO4 nanoplates is the (100) plane. As a result, the b axis lies in the platelets and the LiMnPO4/MnPO4 interface intersects the Li+ pathway. This geometry means that the specific capacity is reduced where the interface motion is either blocked or too slow. Reduction of the volume and site-symmetry mismatch across the interface and a better crystallinity of the platelets increases the mobility of the interface to give a higher capacity at higher rates and smaller capacity fade on cycling.
Acknowledgments
This work was supported by the Assistant Secretary for Energy Efficiency and Renewable Energy, Office of Vehicle Technologies, U.S. Department of Energy, under Contract DE-AC02-05CH11231 through the Batteries for Advanced Transportation Technologies (BATT) Program Subcontract 6805919. The work was also supported by the Office of Basic Energy Sciences Office of Science, U.S. Department of Energy, under Contract DESC0005397.