
Abstract
As a way to characterize the values of key parameters for modeling electrochemical transport of elements in a molten salt system, a meta-analysis of CV reduction peaks for UCl3 in LiCl-KCl eutectic was performed. Published CV data was fit using least squares fitting software coupled with electrochemical simulation software. The analysis yielded estimates of apparent standard potential, the diffusion coefficient, and the exchange current density for each reaction. The results for the UCl3 reduction peak matched well with existing data.
Export citation and abstract BibTeX RIS
Molten salt electrochemical technology has recently been examined to recycle spent nuclear fuel.1–4 However, because of the difficulties in handling radioactive materials, work is also being done to simulate the electrochemical recycling of spent nuclear fuel.5–7 Others who wish to examine the proliferation resistance of this technology are also interested in computer models to predict system behavior.8 The computer models that have been developed to describe electrochemical recycling of spent nuclear fuels include PYRO,5 GPEC,9 TRAIL,6 DEVON,10 REFIN,11 etc.
The values of several input parameters for the use of such computer codes were uncertain or unobtainable. Among these are standard potentials, exchange current densities, diffusion coefficients of ions in the molten salt, and representative boundary layer thicknesses. Several estimates of the uranium exchange current density, or related parameters have been made with electrochemical impedance spectroscopy (EIS) and Tafel plots, but the value is uncertain.12,13 There is also the natural variability of the parameter to contend with, so making a measurement of this is still useful. Another study14 used large electrodes, or electrodes with unspecified surface areas, which also makes the results difficult to use.
There is a large amount of published Cyclic Voltammetry (CV) data for a number of elements including uranium. By noting the availability of such data, this study proposes a method to derive the values for several major input parameters by the combined use of the CV data and a computer model to describe electrochemistry. A new computer model called ERAD15 was employed for that purpose. And a least squares fit using the ERAD code as the fitting function is employed in order to determine input parameters from the CV data. The parameters chosen are standard potential, diffusion coefficient, diffusion layer thickness, and exchange current density. Because the data comes from a wide variety of sources, it will represent the range of conditions that will be observed in practice, and will be less biased toward any particular set of experimental conditions.
Selection of CV Data
CV data was extracted from several published papers using the Engauge plot digitizer tool. Several criteria were used in deciding which CVs to use:
- High reference electrode concentrations to maintain stability
- Good image quality and good image scaling
- High data resolution
- Small electrodes
The CVs being used are summarized in Table I. They were obtained over several temperatures, hydrodynamic conditions, and solute concentrations. The U(III) reduction peak occurring at about −1.4 vs Ag/AgCl was modeled for scans on electrodes traveling from the anodic to the cathodic direction. Because the software cannot model prepeaks, they were not included in the data extracted from the CVs.
Table I. Summary of CV's used for uranium fits.
| Source | Scan Rate (V/s) | Mole Fraction UCl3 | T (K) |
|---|---|---|---|
| 13 | 0.1 | 0.0021 | 723 |
| 13 | 0.25 | 0.0021 | 723 |
| 20 | 0.1 | 0.0035 | 733 |
| 12 | 0.1 | 0.0016 | 773 |
| 12 | 0.5 | 0.0016 | 773 |
| 16 | 0.1 | 0.00073 | 773 |
| 16 | 0.5 | 0.00073 | 773 |
| 17 | 0.08 | 0.0034 | 823 |
| 17 | 0.2 | 0.0034 | 823 |
The ERAD Model
ERAD is a 1-dimensional electrochemical kinetics and transport analysis code based on an earlier model, REFIN.11,15 ERAD simulates each reaction at each electrode using three equations. The equilibrium state is evaluated with the Nernst equation, which defines the equilibrium potential as
![Equation ([1])](https://content.cld.iop.org/journals/1945-7111/161/4/D147/revision1/jes_161_4_D147eqn1.jpg)
Where E0 is the standard potential, R is the gas constant, T is temperature, n is the number of electrons transferred in the reaction, F is Faraday's constant, γ is the activity coefficient, and X is the mole fraction of the dissolved species. The activity coefficient was assumed to be concentration independent, so in this paper, the activity coefficient is combined with the standard potential to produce the apparent standard potential.
The Bulter-Volmer equation addresses reaction rate as
![Equation ([2])](https://content.cld.iop.org/journals/1945-7111/161/4/D147/revision1/jes_161_4_D147eqn2.jpg)
In the above equation, i is the current density, iex is the exchange current density, α is the transfer coefficient, E is the electrode potential, XOx is the mole fraction of the oxidized species. A super script * indicates bulk solution value, and a superscript % indicates the surface of the electrode. iex is evaluated as
![Equation ([3])](https://content.cld.iop.org/journals/1945-7111/161/4/D147/revision1/jes_161_4_D147eqn3.jpg)
on solid electrodes where i0 is the standard exchange current density.
The diffusion equation with an added migration term evaluates mass transfer near each electrode.
![Equation ([4])](https://content.cld.iop.org/journals/1945-7111/161/4/D147/revision1/jes_161_4_D147eqn4.jpg)
where C is concentration, x is location, D is diffusion coefficient. The derivation for the previous equation can be found in.11
Equation 4 was solved for concentration, using the LSODE solver package's backwards differentiation method. Equations 1 and 2 were used to enforce interface boundary conditions at electrode surfaces. When electrode potential is set, like the working electrode in a CV, equation 2 is applied directly. However, if the electrode current density is set, the inverse of equation 2 is applied by using a root finding function.11,15
It is important to note that ERAD focuses on describing rate-limiting steps in mass transport in electrorefining operations thus does not model adsorption, pseudocapacitance, ohmic drop, or dendrite formation. Additionally ERAD does not simulate electrolyte fluid flow, or current flow in more than one dimension.
Fitting Procedure
ERAD results were evaluated with a least squares function in order to create an objective function, which is
![Equation ([5])](https://content.cld.iop.org/journals/1945-7111/161/4/D147/revision1/jes_161_4_D147eqn5.jpg)
Its resulting value is the sum of squares of the difference between experimental CV data (iCV, j) and simulated CV data (iERAD, j). This is a function of apparent standard potential (E0), exchange current density (i0), diffusion coefficient in molten salt (D), and diffusion layer thickness at the working electrode (δ). The objective function was then minimized using the MATLAB function fminseach, which employs a Nelder-Mead minimum search to yield the four unknowns.
The transfer coefficient was not fitted because the U(III)->U reaction is mass transfer limited,16,17 and most of the observable kinetic effects will lie in an approximately linear portion of the i-E curve. Because that portion of the curve is linear, it can only yield two parameters. The first parameter used is the intercept of the i-E curve, which yields standard potential. The second parameter can consequently yield the transfer coefficient or the exchange current density, but not both. Because the transfer coefficient was assumed to be 0.5, the second parameter fitted is exchange current density. This assumption is valid because the curve will rarely go far enough from equilibrium for the transfer coefficient assumption to seriously affect the result.
Standard potentials were obtained for uranium and plutonium vs. the Ag/AgCl reference electrodes used in the various experiments. In order to provide a uniform scale for the data, the results were then converted to potentials vs. a Cl2/Cl− reference electrode using
![Equation ([6])](https://content.cld.iop.org/journals/1945-7111/161/4/D147/revision1/jes_161_4_D147eqn6.jpg)
which was obtained by applying the Nernst equation. The standard potential of the silver chloride electrode is obtained from18 and19 as:
![Equation ([7])](https://content.cld.iop.org/journals/1945-7111/161/4/D147/revision1/jes_161_4_D147eqn7.jpg)
Results and Discussion
An example fit can be seen in Figure 1. The computer simulations converged to CV data in a similar manner. As can be noted, the prepeak that often occurs on uranium CV data is not modeled. Diffusion layer thickness was found to range from 0.004 to 0.019 cm.
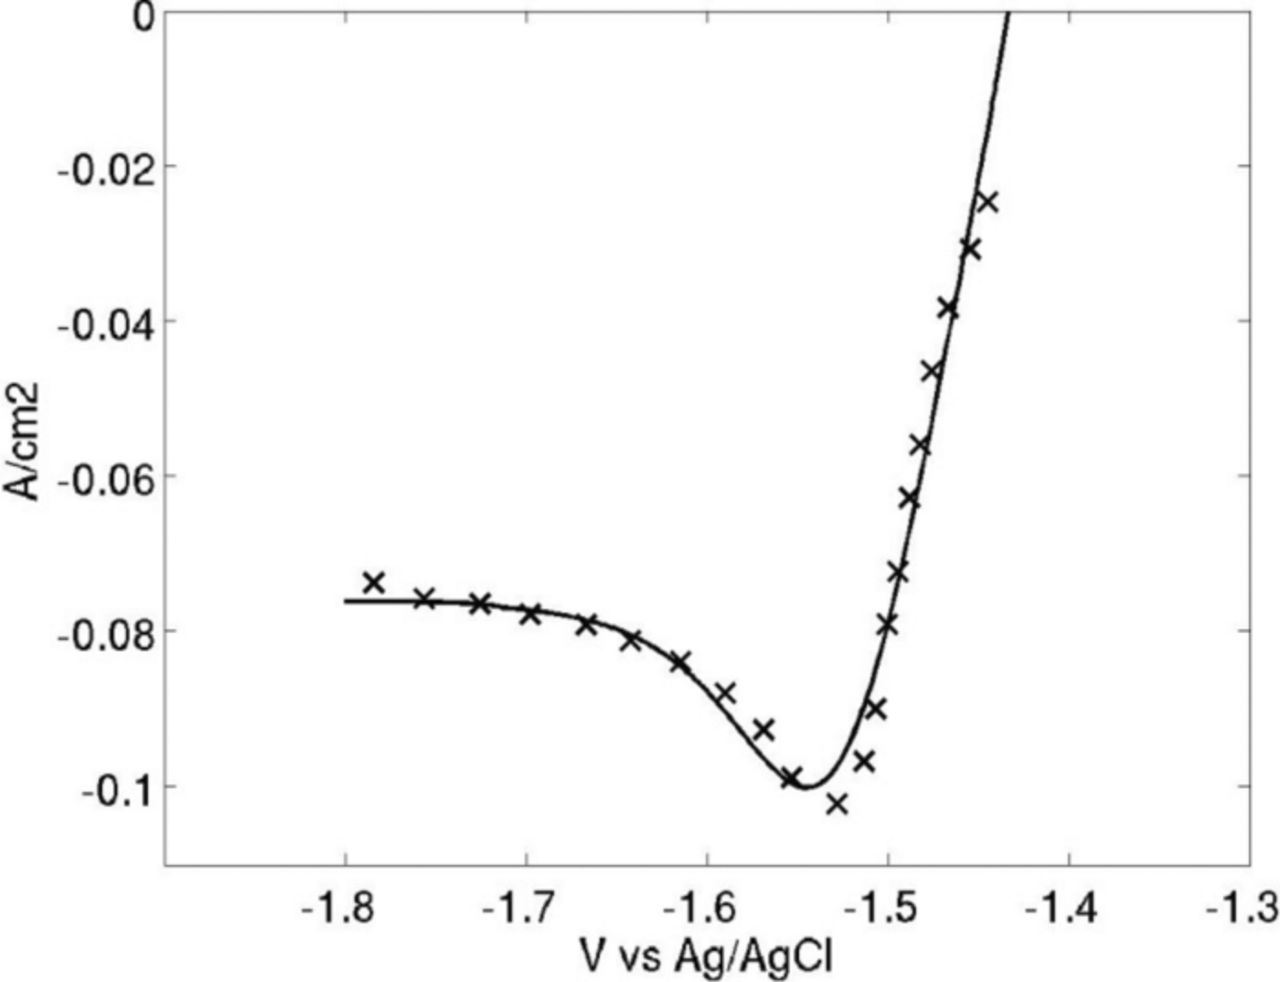
Figure 1. Best fit from.13
The resulting apparent standard potentials of uranium are shown in Figure 2. The potential for the reduction of UCl3 to metal lies within the range of existing data, and follows the expected trend. There is some noise in the data, likely due to changes in experimental conditions.
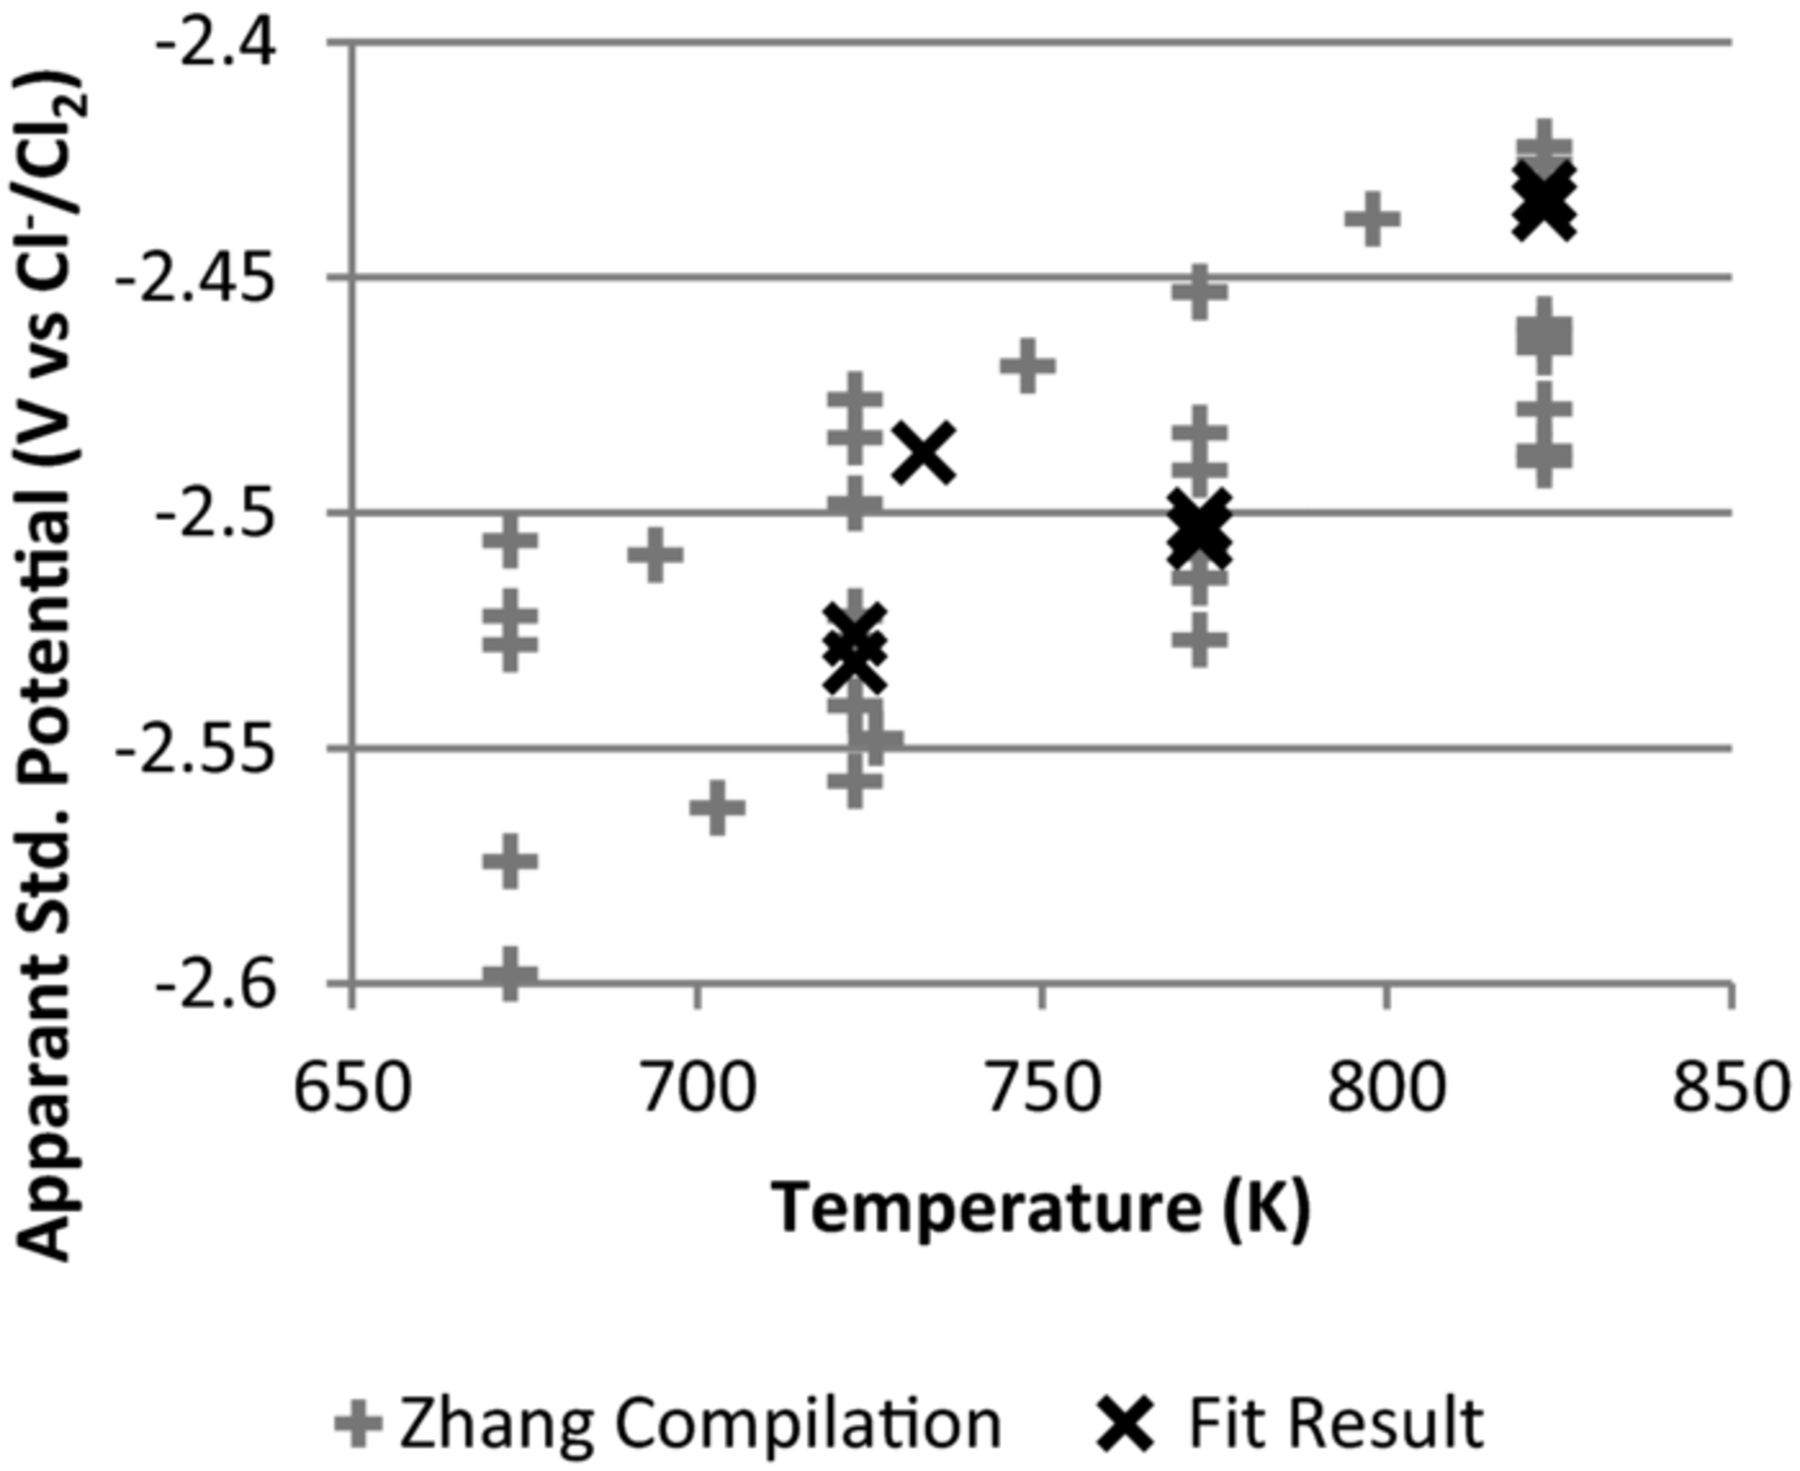
Figure 2. Standard potentials for uranium reduction reaction vs. Cl reference electrode. Reference data taken from a compilation of data by Zhang.21
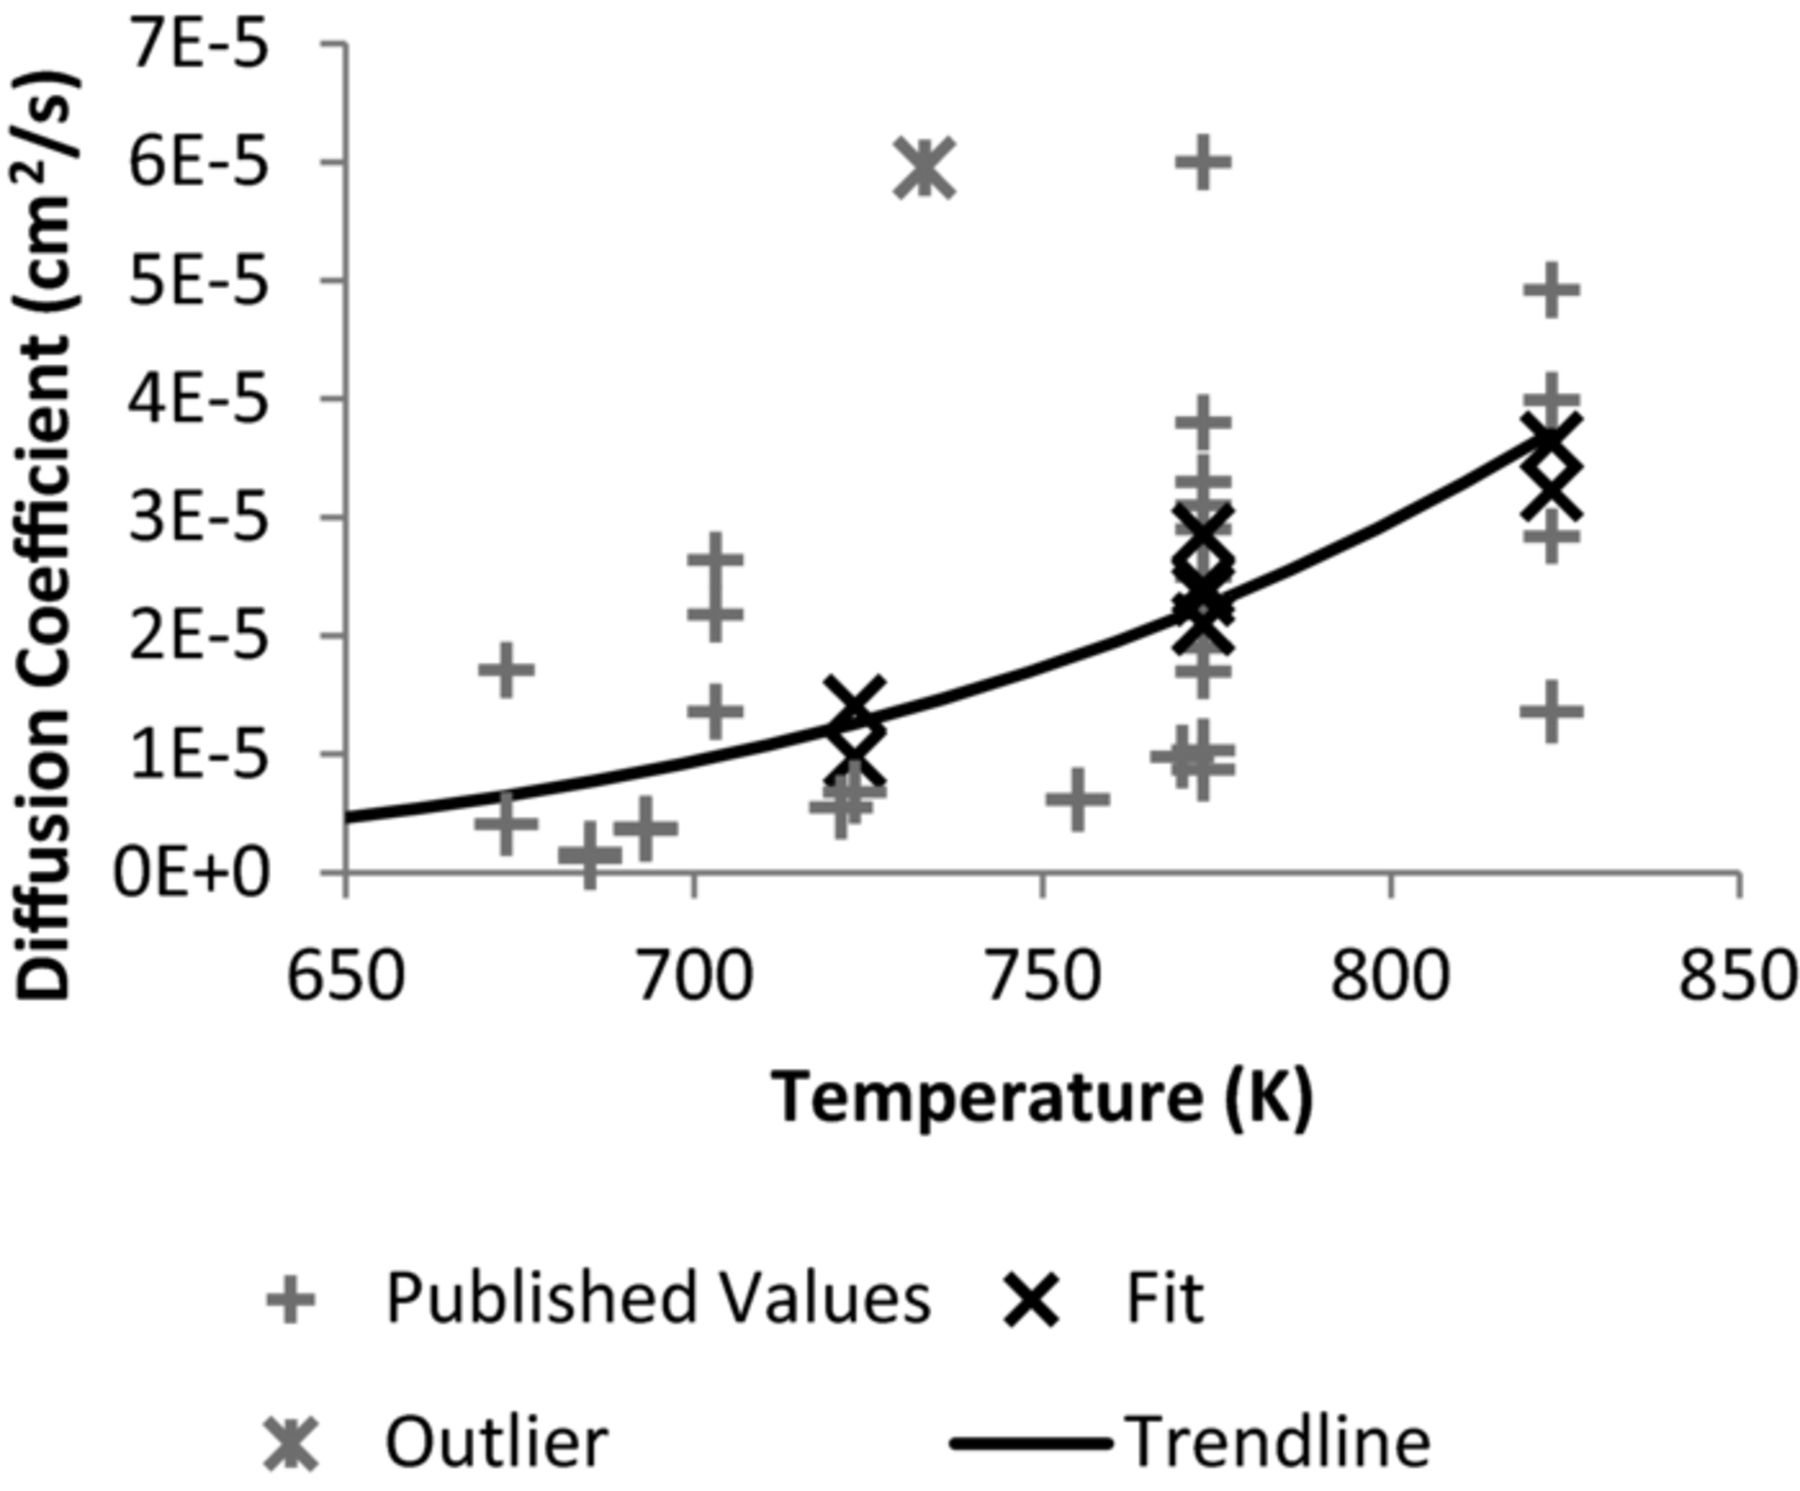
The diffusion coefficients for uranium fall within the range of measured data (Figure 3). It also follows the expected increasing trend with temperature with the exception of the data from.20 It is not known why this CV varies from the others for the diffusion coefficient. Regardless, the outlier was removed from the data, and it was fitted to the Arrhenius equation, yielding
The exchange current density for uranium was also resolved from CV data (Figure 4). It appears to have an increasing trend with respect to temperature. It should be noted however, that it likely varies depending on electrode surface preparation. This is exemplified in the case of the data from12 which had a value of over 5 A/cm2 as opposed to the more typical values. The outliers were removed from the data, and the exchange current density was fitted to the Arrhenius equation, yielding
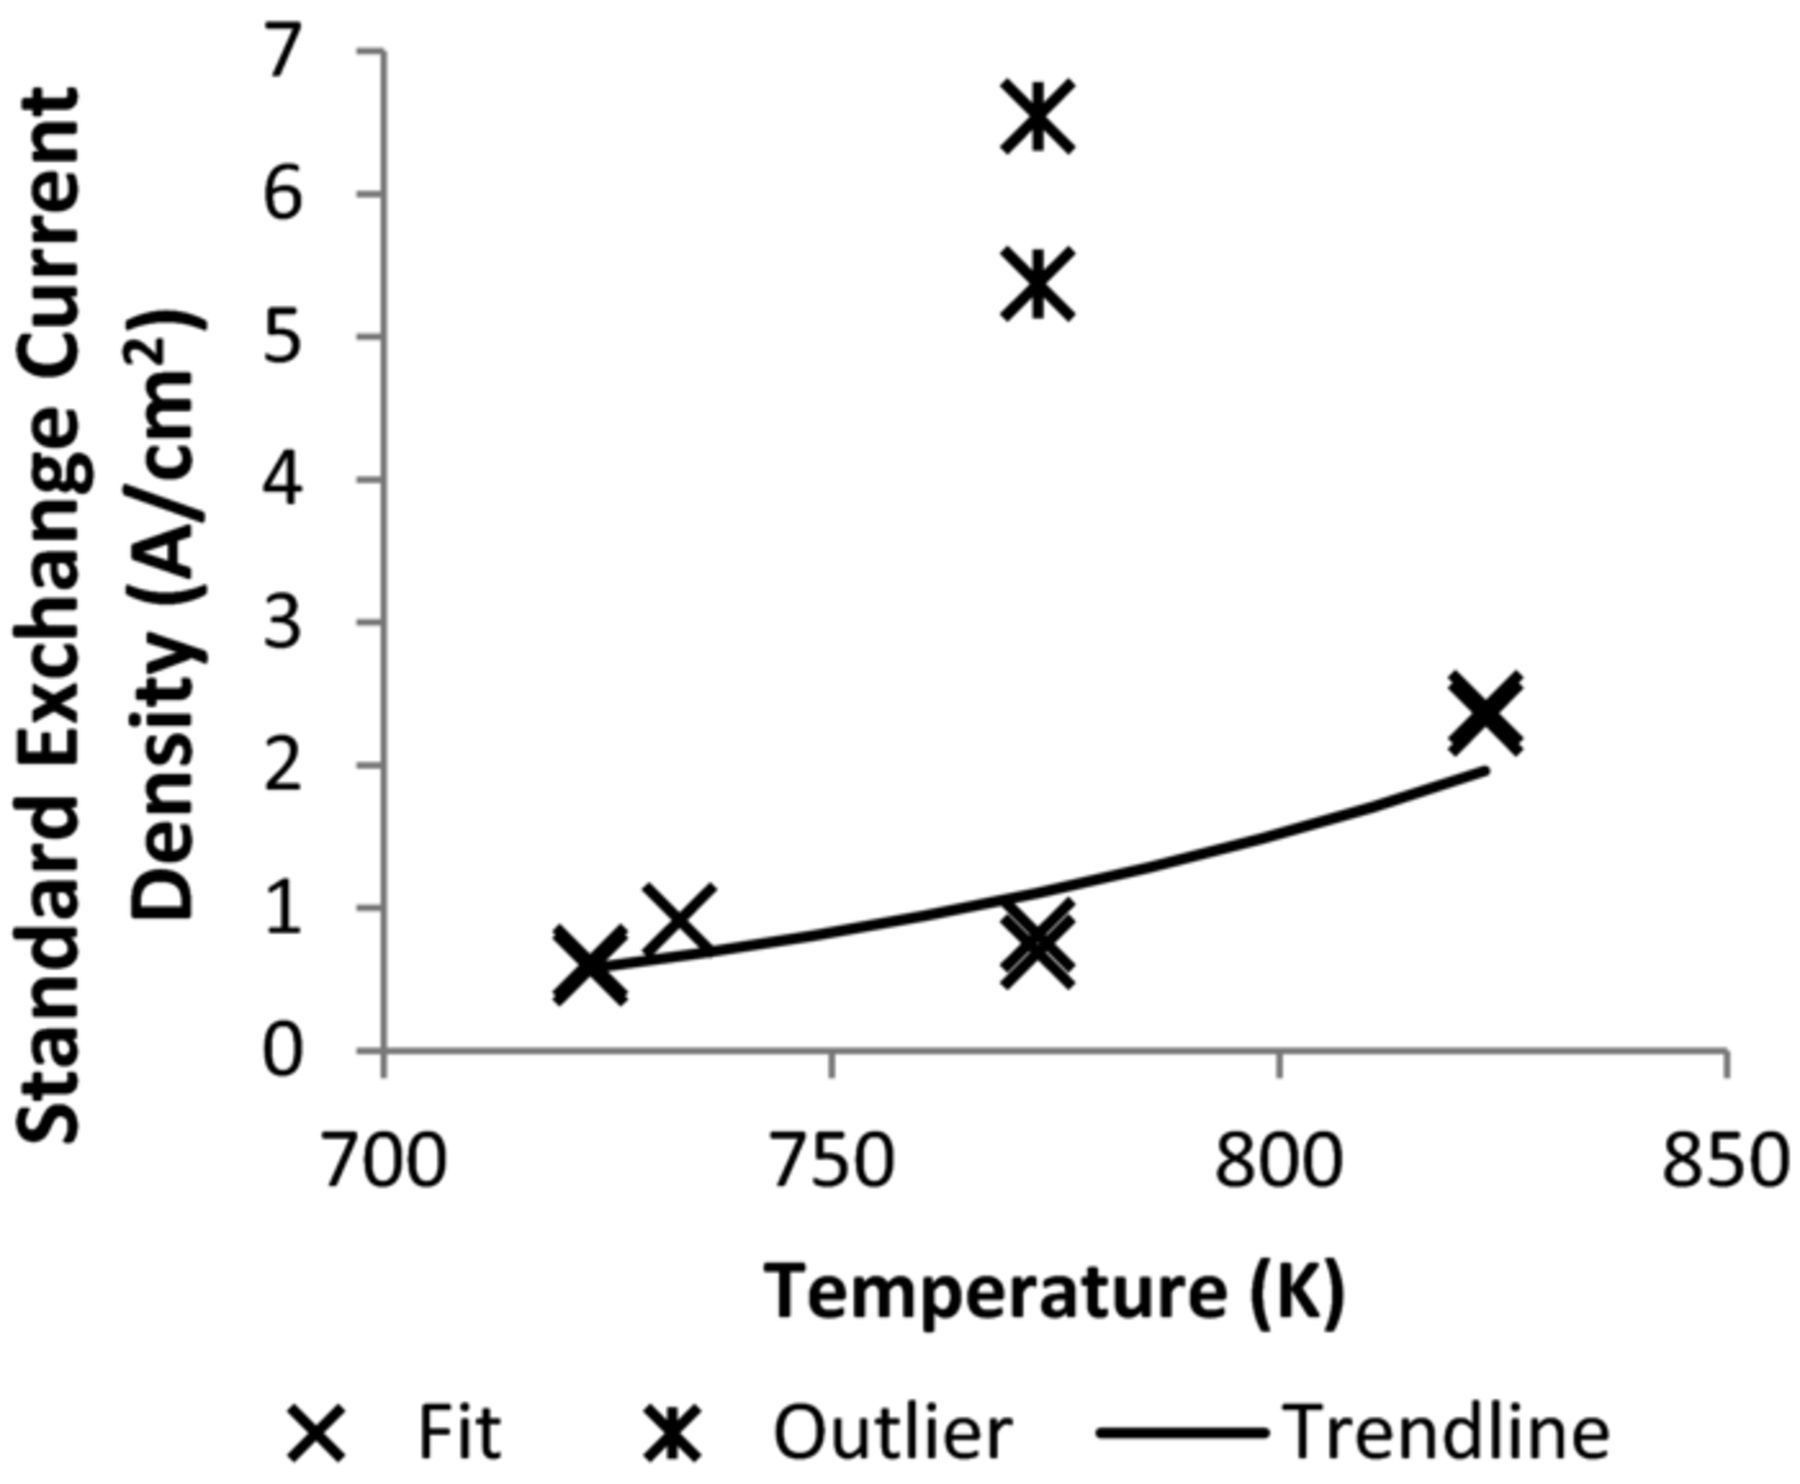
Figure 4. Uranium exchange current density.
Conclusions
This meta-analysis of CV data revisits a broad cross-section of CV data for the UCl3/U reduction peak, and extends knowledge of several important parameters—especially in obtaining estimates of exchange current density, which is important in dendrite formation in molten salt systems, as well as modeling non-uniform electrodes.
Due to the match between experimentally measured data and data obtained through CV fitting for the UCl3 reduction reaction, it can be said that the proposed approach, i.e., the computer model-based derivation of the values of key parameters using a least square fit of the CV data works well—or at least to the level of variation in the data. For the UCl3 reduction reactions it can be seen that there is some variation, which should be considered in any predictive modeling work.
Acknowledgments
This work was supported by Korea Research Foundation under the contact number 2011-0031839. The authors would also like to acknowledge the support from Prof. Il Soon Hwang of Seoul National University who provided the REFIN code.