Abstract
The morphology of electrodeposited lithium in room-temperature ionic liquids was investigated by ex situ SEM observations, and the dependence of the distribution of the electrodeposited lithium nuclei on current density was discussed with respect to the lithium-ion diffusion coefficient. It was concluded that the deposits are better distributed with a decreased size when the current density is increased in the current range where the deposition is charge-transfer controlled. Under a larger current density at which the deposition is diffusion controlled, larger dendritic deposits are observed, although deposits are well distributed over a large area. Under so large current density that the diffusion of lithium ions is slower than the lithium ion reduction, the electrode potential becomes highly negative. Abovementioned tendency is very common for the electrodeposition of noble metals from an aqueous solution, but it was firstly presented for lithium metal. It is probably due to very low reactivity of the ionic liquid used with lithium in this study.
Export citation and abstract BibTeX RIS

This is an open access article distributed under the terms of the Creative Commons Attribution Non-Commercial No Derivatives 4.0 License (CC BY-NC-ND, http://creativecommons.org/licenses/by-nc-nd/4.0/), which permits non-commercial reuse, distribution, and reproduction in any medium, provided the original work is not changed in any way and is properly cited. For permission for commercial reuse, please email: oa@electrochem.org.
Lithium metal is a promising candidate for negative electrodes because its capacity density is higher as compared to that of carbonaceous materials and it has extremely negative standard electrode potential, −3.045 V vs. SHE. However batteries with a lithium anode have not yet been used in practical applications. One of the biggest obstacles to the commercialization of such lithium batteries is the dendritic growth of lithium on the negative electrode during charging, which causes short circuit and poor cyclability.1–6 To suppress the dendritic growth of lithium metal, many studies have been carried out on surface film control,13,7–17 alloy formation,18 addition of inhibitors,19 separator structures,20 and so on.6 We have recently focused on the distribution of nucleation sites in electrodeposited lithium.21 A large overpotential theoretically leads to greater nuclear distribution at the initial stage of electrodeposition, which is explained in detail in the discussion section.
A large overpotential can be achieved by applying a large current density. Sagane et al. reported that the nucleation sites for the case with solid electrolyte are widely distributed if the current density is increased.22 Additionally, a larger overpotential is achieved by controlling the physical properties of the electrolyte, i.e., the electrolyte viscosity, to control the charge-transfer resistance.23 We previously reported that the use of a highly viscous electrolyte and the film originated from vinylene carbonate at the electrode-electrolyte interface assist the effective distribution of nucleation sites and suppression of dendrite formation.21
In the present study, the effect of increased current density on nuclear distribution was investigated by ex situ scanning electron microscopy (SEM), using liquid electrolytes. Room-temperature ionic liquids with excellent stability at the highly negative Li/Li+, were selected to minimize the effect of the surface film formed by decomposition of the electrolyte with lithium metal.
Experimental
Fig. 1 shows the chemical formulae of the cations and anions of the ionic liquids and their abbreviations. [C3mpip][Tf2N], [C4mpyr][Tf2N], and [N6,1,1,1][Tf2N] were selected as the base electrolytes, because they are very stable at negative potentials such as the Li/Li+ potential24,25 and their viscosities range between a certain extent. [C3mpip][Tf2N] and [C4mpyr][Tf2N] were purchased from Kanto Chemical Co. (Japan). Li[Tf2N] and [N6,1,1,1][Tf2N] were purchased from Kishida Chemical Co. (Japan). Electrolyte preparation was carried out in dried air (dew point: below −40°C) after drying under vacuum at 75–85°C for 3 h. Li[Tf2N] (0.32 mol kg−1, 10 wt%) was added to [C3mpip][Tf2N], [C4mpyr][Tf2N], and [N6,1,1,1][Tf2N]. The residual water level in the resulting electrolytes, which was measured using a Karl-Fisher moisture meter (Kyoto Electronics Manufacturing, MKC-510N), was below 50 ppm. The viscosity of the electrolyte was measured using a cone-plate-type viscometer (Brookfield DV III+) in dry air at 25°C.
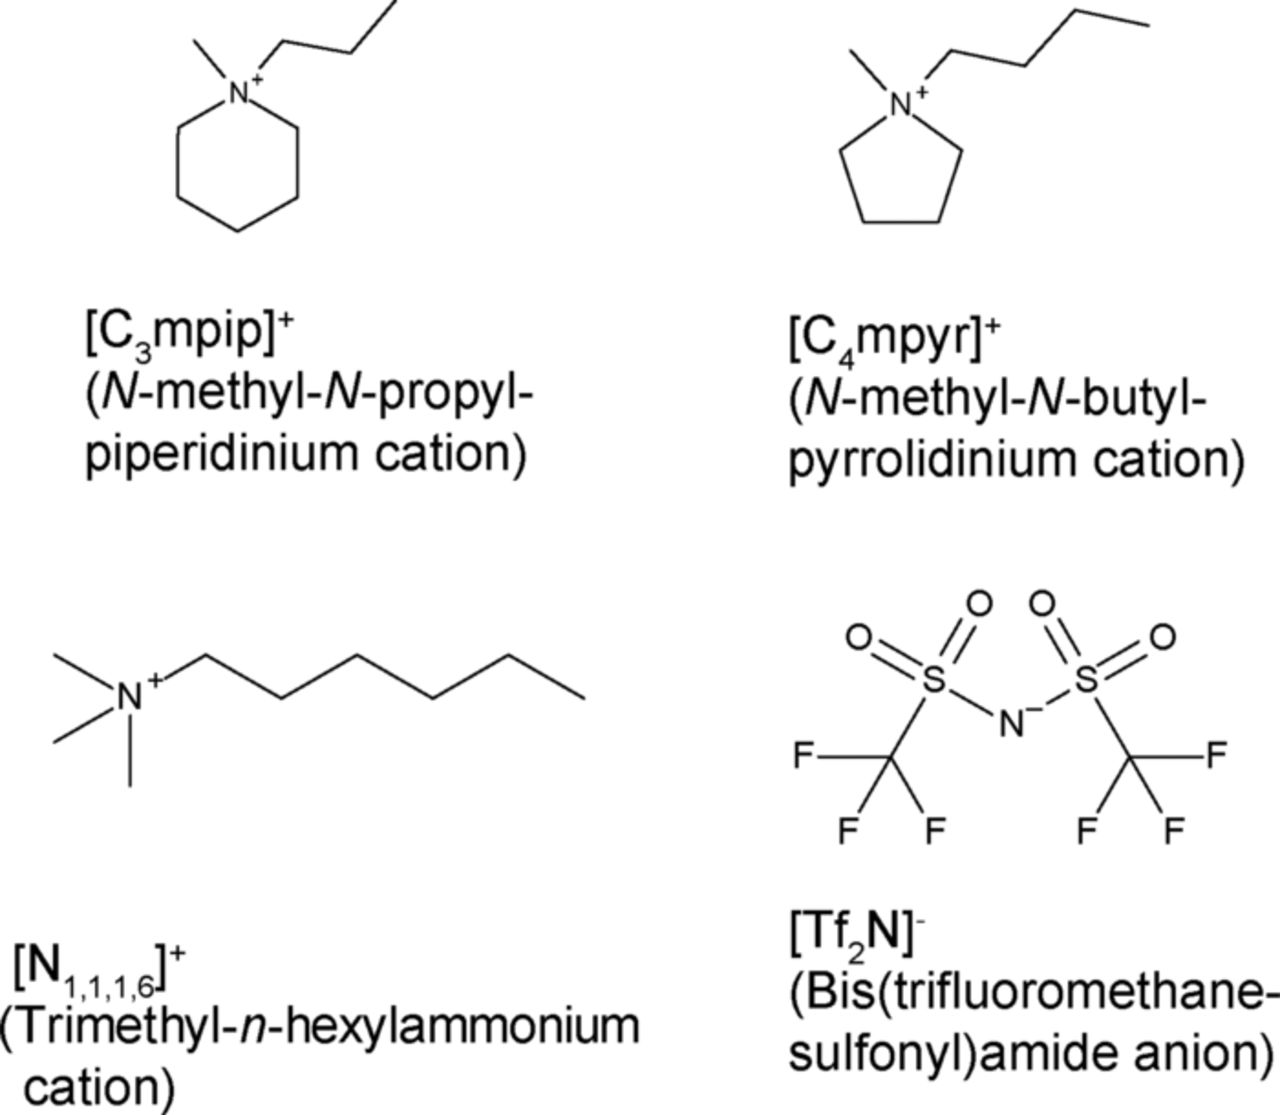
Figure 1. Chemical formulae and abbreviations of cations and anions of the room-temperature ionic liquids used in this study.
A coin type two-electrode cell was fabricated in an Ar-filled glove box (dew point: below −80°C). The working electrode was nickel foil (Nilaco, Japan, 99%), and the counter electrode was lithium foil pasted on copper foil (Honjo Metal, Japan, Lithium battery grade). The distance between the two electrodes was fixed at 1 mm by a spacer ring. On the basis of Shiraishi et al.'s study,9 lithium electrodeposition was carried out at a total charge of 3 C cm−2 (=3 A·s·cm−2). The current density was from 5 to 1000 μA cm−2. After electrodeposition the cells were opened in the Ar-filled glove box. The working electrode was washed with dimethylcarbonate and transferred directly to the scanning electron microscope using a custom-made transfer vessel. The surface morphology of the working electrode was observed by SEM.
For the measurement of lithium-ion diffusion coefficient, a coin-type three-electrode cell was fabricated in an Ar-filled glove box. Both working and counter electrodes were lithium foil (φ14 mm). The reference electrodes consisted of a piece of lithium foil attached to the nickel lead. Glass fiber filters (Whatmann, GF/A, 260 μm thickness) were used as separators. The potential of the working electrode was set to −0.5 V, and current profiles were obtained. Although such a measurement should primarily be carried out using a large counter electrode, located far enough from the working electrode, a symmetrical cell with an electrode with a 260-μm-thick separator was used for this experiment in order to simulate a practical cell. To calculate lithium-ion diffusion coefficient, the current profiles were analyzed using the Cottrell equation,
![Equation ([1])](https://content.cld.iop.org/journals/1945-7111/161/9/A1236/revision1/jes_161_9_A1236eqn1.jpg)
where I(t)lim is the limiting current, t is the time, n is the electrons per molecule oxidized or reduced to 1, F is Faraday's constant, A is the area of the electrode, c* is the bulk concentration, and D0 is the diffusion coefficient of lithium ion. In this experiment, n was 1 and A was 1.54 cm2; c* was 0.46, 0.45, and 0.44 mol dm−3 for [C3mpip][Tf2N], [C4mpyr][Tf2N], and [N6,1,1,1][Tf2N], respectively. c* was calculated from the density, which was measured using a pycnometer (AccuPyc II 1340, Micromeritics) in dry air at 25°C.
Results and Discussion
The voltage-coulomb amount profiles for the cells are shown in Fig. 2. In all cases, side reactions were observed when the voltage reached 1.5 V, which tended to consume more coulomb amount when the current density was small. The details of the side reactions are not well defined, but these reactions are thought to arise from the reduction of the native oxide on the substrate surface, or from the impurity in the electrolytes. For the cell with [C3mpip][Tf2N], the voltage rapidly dropped to below −4 V under a reduction current, with current densities of 500 and 1000 μA cm−2 (Fig. 2(a1)). This rapid drop was due to the extremely low concentration of lithium ions in the vicinity of the working electrode.26,27 Before the abovementioned voltage drop, two plateaus were observed at around −0.5 V and −2.0 V, which could be attributed to lithium deposition and a side reaction such as reduction of the ionic liquid, respectively. This rapid drop was also observed for the cell with [C4mpyr][Tf2N] and [N6,1,1,1][Tf2N], at current densities of 500 and 1000 μA cm−2.
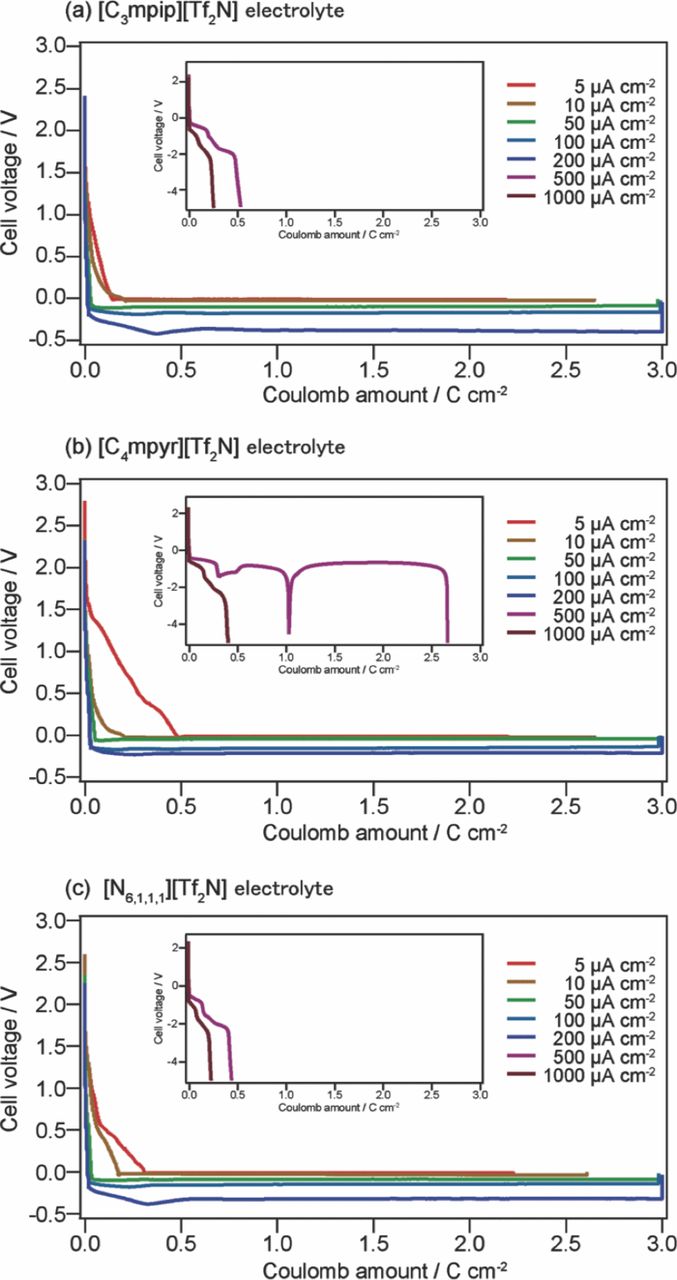
Figure 2. Voltage-coulomb amount profiles for cells with (a) [C3mpip] [Tf2N]-based, (b) [C4mpyr][Tf2N]-based, and (c) [N6,1,1,1][Tf2N]-based electrolytes at different current densities.
When the current density was 200 μA cm−2 or less, a plateau was observed at around 0 V for the three cells, considered to be due to lithium deposition. Fig. 3 shows the relationship between the plateau voltage and the corresponding current density of each cell. The difference between 0 V and the plateau voltage tended to increase when the current density was high and the electrolyte was more viscous. The plateau voltage is determined by the overpotential applied to the working electrode and the counter electrode. The decline of the plateau voltage from 0 V and the overpotential at the working electrode are proportional to each other, as the plating/stripping behavior obtained in cyclic voltammetry is symmetric. Note that the iR component derived from solution resistance is calculated to be very small related to the cell voltage, using measured ionic conductivity of the electrolytes (i.e. 0.84 mS cm−1 for [C3mpip][Tf2N]-based electrolyte). More details on the relationship between the plateau voltage and the current density will be discussed later, taking into consideration the viscosity and diffusion coefficient data.
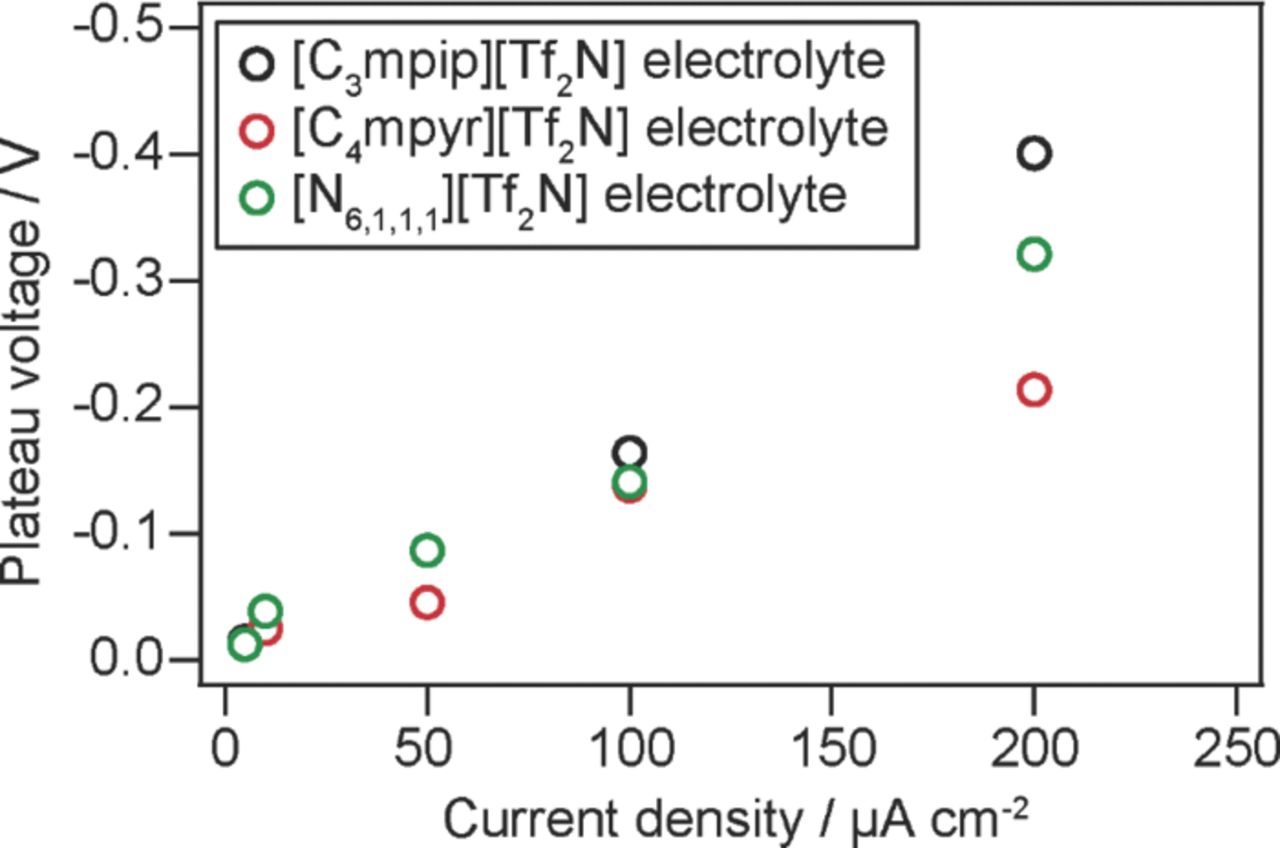
Figure 3. Relationship between the plateau voltage and the corresponding current density for each electrolyte.
Fig. 4 shows the SEM images of electrodeposited lithium on a nickel working electrode for the cell with three electrolytes of different current densities. Note that the observed coulomb amount for the cell with current densities of 500 and 1000 μA cm−2 was smaller than 3 C cm−2, which was the coulomb amount for the other cells. With an increase in current density, the size of the deposited particles decreased and the particles were more distributed. This can be explained as follows. Under the assumption that the lithium metal particles grown are semispherical in shape, the free energy change, ΔG, is expressed as
![Equation ([2])](https://content.cld.iop.org/journals/1945-7111/161/9/A1236/revision1/jes_161_9_A1236eqn2.jpg)
where ΔGV is the free energy change per unit volume; V is the volume of the lithium metal semisphere; σ1 and S1 are the surface energy per unit area and the area of the interface between electrolyte and the lithium metal nuclei respectively; σ2 and S2 are the surface energy per unit area and the area at the interface between the nickel substrate and the lithium metal nuclei, respectively; σ0 is the surface energy per unit area at the interface between the nickel substrate and the electrolyte.28 ΔGV has a negative value, −nFη, where n is the electrons per molecule oxidized or reduced, i.e., 1 in this case; F is Faraday's constant; and η is the overpotential. σ0, σ1 and σ2 assume positive values. When the lithium metal nucleus grows to a semispherical shape,
![Equation ([3])](https://content.cld.iop.org/journals/1945-7111/161/9/A1236/revision1/jes_161_9_A1236eqn3.jpg)
![Equation ([4])](https://content.cld.iop.org/journals/1945-7111/161/9/A1236/revision1/jes_161_9_A1236eqn4.jpg)
![Equation ([5])](https://content.cld.iop.org/journals/1945-7111/161/9/A1236/revision1/jes_161_9_A1236eqn5.jpg)
where r is the radius of the lithium metal semisphere. ΔG is now expressed as
![Equation ([6])](https://content.cld.iop.org/journals/1945-7111/161/9/A1236/revision1/jes_161_9_A1236eqn6.jpg)
The critical radius for the nucleation, r*, is determined by solving the equation dΔG/dr = 0
![Equation ([7])](https://content.cld.iop.org/journals/1945-7111/161/9/A1236/revision1/jes_161_9_A1236eqn7.jpg)
Thus, when a larger current density is passed, a higher overpotential η should also be applied, and the critical radius r* should become smaller. The total charge amount for the reduction of lithium ions to lithium metal is constant, and in the process, the number of nuclei should increase. This explanation agrees well with the results shown in Fig. 4, illustrating the relationship between the current density and the number of nuclei.
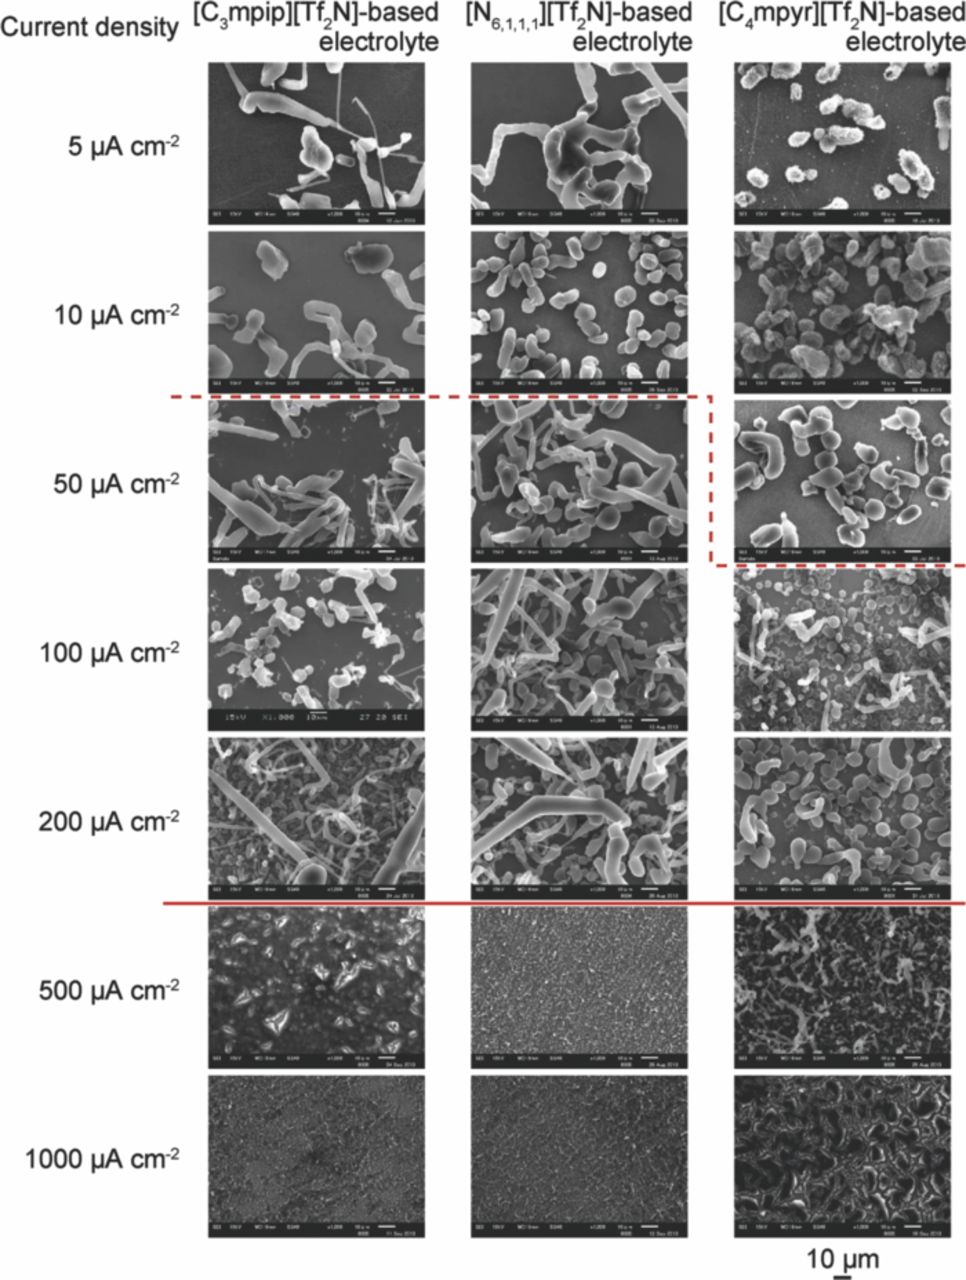
Figure 4. SEM images of electrodeposited lithium on a nickel working electrode for the cell with three electrolytes, at different current densities. All images are of the same scale, and the corresponding scale bar is located at the bottom right.
Next, the shape of the deposits is discussed. For the cell with [C3mpip][Tf2N], when the current density was 10 μA cm−2 or less, circular deposits were observed. Circular deposits were also observed when the current densities were smaller than or equal to 10 μA cm−2 and 50 μA cm−2 for the cells with [N6,1,1,1][Tf2N] and [C4mpyr][Tf2N], respectively. For the cell with [C3mpip][Tf2N], when the current density was 50 μA cm−2 or more (region between the dashed and solid lines in Fig. 4), needle-like deposits were observed, which are thought to have grown from semisphere-like nuclei. When the current densities were larger than or equal to 50 μA cm−2 and 100 μA cm−2 for the cells with [N6,1,1,1][Tf2N] and [C4mpyr][Tf2N] respectively, needle-like deposits were again observed, which were thought to have grown from semisphere-like nuclei. In general, noble metals such as copper and silver are electrochemically deposited in a dendritic form from an aqueous solution, under a rather larger current density. This is because the growth kinetics are diffusion-controlled in such a case. In the present study, lithium metal is also thought to be grown under diffusion-controlled kinetics, and hence, the dendritic form is observed when the current density is in the region denoted by the dashed line and solid line in Fig. 4. The dashed line indicates the boundary between diffusion-controlled and charge-transfer-controlled growth. The current density that corresponds to the dashed line is expected to be related to the diffusion coefficient of lithium ions in each electrolyte. Hence, the diffusion coefficients were measured (see the Experimental section). The diffusion coefficients were determined by using the Cottrell Equation (Eq. 1), and are summarized in Table I with the corresponding viscosity of each electrolyte. The diffusion coefficients are inversely proportional to the viscosity.
Table I. Diffusion coefficient of lithium ions and viscosity of each electrolyte.
| Electrolyte | Diffusion coefficient of lithium ions,/10−8 cm2 s−1 | Viscosity/mPa s |
|---|---|---|
| [C3mpip][Tf2N]-based electrolyte | 4.0 | 320 |
| [N6,1,1,1][Tf2N]-based electrolyte | 4.7 | 310 |
| [C4mpyr][Tf2N]-based electrolyte | 9.3 | 141 |
Fig. 5 illustrates the mechanism by which the current density determines the distribution of the lithium nuclei and the morphology of the lithium deposits. As for the distribution and the size, under a large current density, the nuclei are more distributed and the size of the nuclei is smaller. As for the morphology, when the current density is sufficiently small, the nuclei grow semispherically and the deposition becomes charge-transfer controlled. When the current density is sufficiently large, the nuclei grow in a dendritic form and the deposition is diffusion-controlled. When the current density is so large that the diffusion of lithium ions is slower than the lithium-ion reduction, the potential assumes a highly negative value and reactions other than lithium deposition become dominant.26,27 When the nucleation and growth of deposits are considered individually, the distribution of nuclei and charge-transfer-controlled growth can be combined. Fig. 6a shows the SEM image of the lithium electrodeposited following the above concept under the following conditions: a current density of 1000 μA cm−2 was applied for the first 0.15 C cm−2, and a current density of 50 μA cm−2 for the second 2.85 C cm−2 (Fig. 6b). Rather small lithium deposits were observed, and the deposits were well distributed. This is one way to optimize the electrodeposition conditions, i.e., the charging conditions for morphology control.
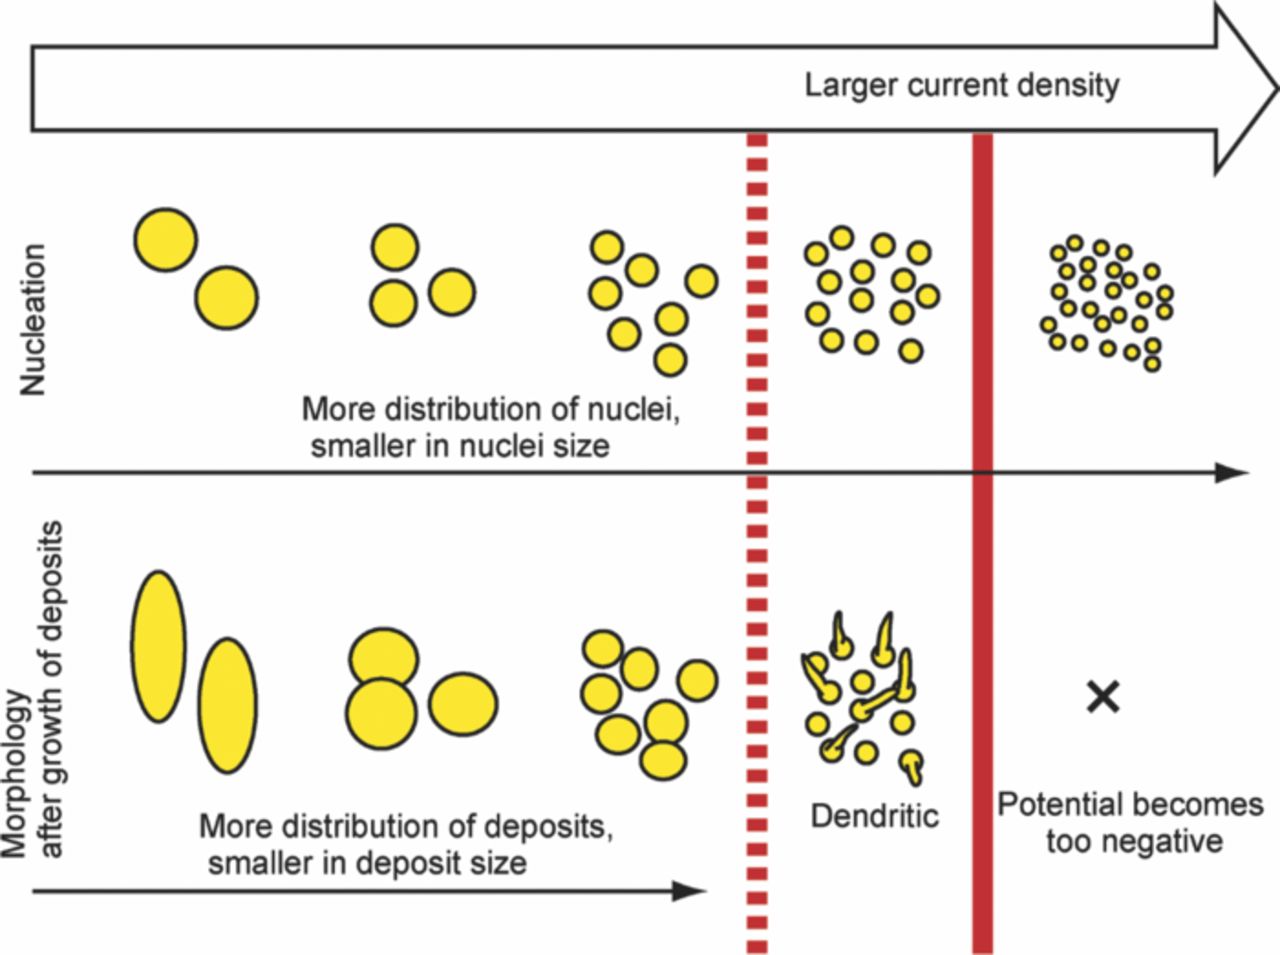
Figure 5. Schematic of the effect of current density on the distribution of lithium nuclei and the morphology of lithium deposits.
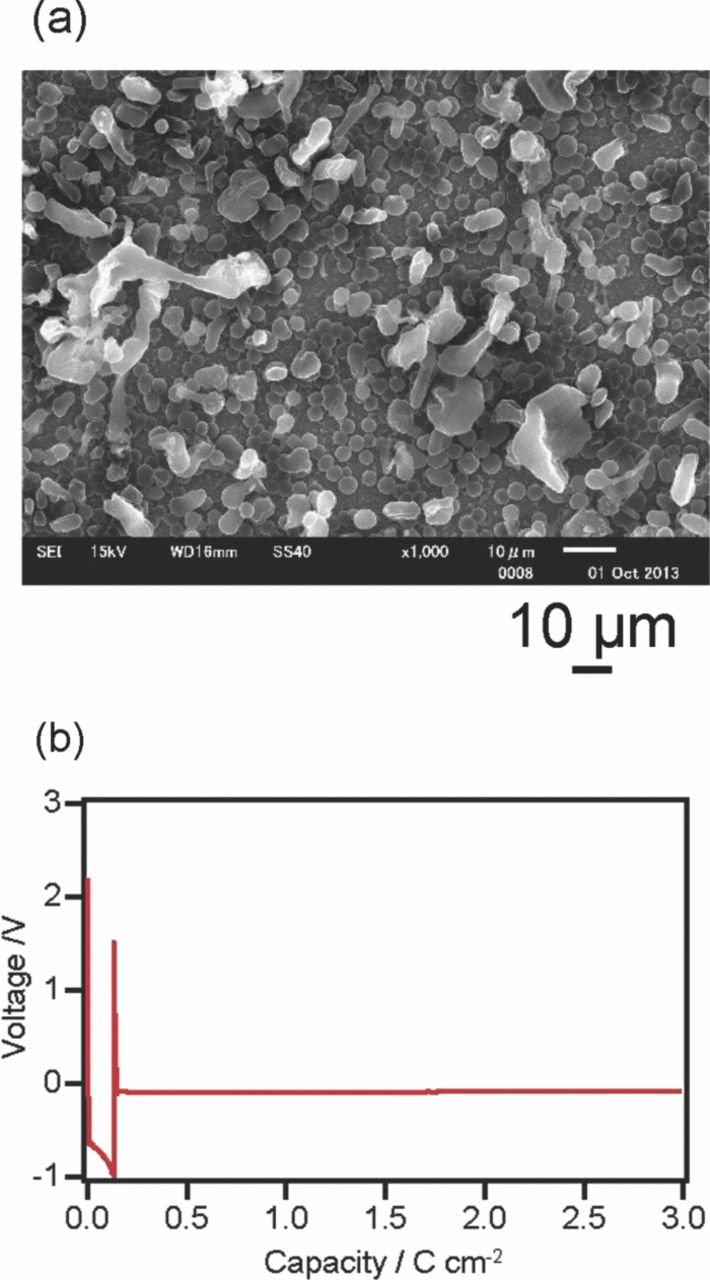
Figure 6. (a) SEM images of electrodeposited lithium on a nickel working electrode when a current density of 1000 μA cm−2 was passed for 0.15 C cm−2, and a current density of 50 μA cm−2 was subsequently passed for 2.85 C cm−2. (b)Voltage-coulomb amount profiles for the cell.
The scheme shown in Fig. 5 is very common for the electrodeposition of noble metals from an aqueous solution, but it has not been reported for lithium metal. This is believed to be due to the reductive reactivity of lithium with ordinal electrolytes such as an organic solvent, in which case surface films are formed on the lithium metal. In the present study, the effect of the film formed by the reaction between the lithium metal and the electrolytes is thought to be small, as the selected ionic liquids are very stable at a negative potential such as the Li/Li+ potential. To suppress dendrite formation, the current density should be in the region of charge-transfer-controlled growth. This region can be controlled by changing the diffusion coefficient of lithium ions, which is affected by the solvent type, temperature, and lithium salt concentration.
Conclusions
The morphology of electrodeposited lithium in room-temperature ionic liquids was investigated by ex situ SEM observations, and the dependence of the nuclear distribution of the electrodeposited lithium on current density was discussed with relation to the lithium-ion diffusion coefficient. As schematically displayed in Fig. 5, the nuclei are smaller and more distributed when the current density is large. The nuclei grow in a semispherical shape in the charge-transfer-controlled mode when the current density is sufficiently small. The nuclei grow in the dendritic form in the diffusion-controlled mode when the current density is sufficiently large. When the current density is much larger so that diffusion of the lithium ions is slower than lithium-ion reduction, the potential becomes too negative and reactions other than lithium deposition occur. Considering that more nuclei are generated under a large current density and are grown at a small current density, small lithium particles are obtained and the deposits are well distributed. A method to control the current region with charge-transfer-controlled growth is presented.
Acknowledgment
This work was supported by JST-ALCA Project, "Next-generation Rechargeable Battery."