Abstract
Self-assembly of organic molecules onto metallic surfaces is an efficient way to modify surface properties of metallic materials. The aim of this paper was to examine the possibility of improving the corrosion stability of copper nickel alloy in chloride environment by self-assembled films of palmitic and stearic acid. Electrochemical techniques such as potentiodynamic polarization and electrochemical impedance spectroscopy (EIS) were used to determine the protective properties of the fatty acids films. Fourier transform infrared spectroscopy (FTIR), atomic force microscopy (AFM) and contact angle (CA) measurements were used to evaluate structural properties of the surface layers. It was found that even a small difference in a fatty acid chain length might have a strong effect on layer stability in aqueous medium.
Export citation and abstract BibTeX RIS

This is an open access article distributed under the terms of the Creative Commons Attribution Non-Commercial No Derivatives 4.0 License (CC BY-NC-ND, http://creativecommons.org/licenses/by-nc-nd/4.0/), which permits non-commercial reuse, distribution, and reproduction in any medium, provided the original work is not changed in any way and is properly cited. For permission for commercial reuse, please email: oa@electrochem.org.
Self-assembled monolayers (SAMs) of various organic compounds have found their application in many fields such as sensors, electronic devices, lubrication or corrosion protection.1–7 Formation of SAMs and their characterization have been mostly conducted on pure metals, either bare - nonoxidized7–12 or oxidized,5–7,13–19 while studies on alloys are scarcer.2,19–27 The aim of the present work was to investigate the possibility of corrosion protection of cupronickel alloy (CuNi) by self-assembled monolayers of stearic (SA) and palmitic acids (PA). Long chain carboxylic acids were found to form highly organized films on natively oxidized Al,5,6,13,16,18 Ag,6,16 Cu,6,16 Fe,15,17,19 stainless steel2,17,19,24 and Mg alloys.26,27 The formation of self-assembled monolayers of long-chain carboxylic acids on the surface of CuNi alloy has been scarcely studied. Xu et al.28 have examined application of stearic acid for CuNi alloy protection but they did not examine the structure of the protective layer. As they used very high concentration stearic acid solutions (0.1 M), it is quite unlikely that monolayer structure was obtained.
In principle, SAMs are easily prepared by adsorption, either from the solution or vapor phase, but in practice many factors determine whether the well ordered and compact monolayer will be formed.1 Film formation is affected by temperature, solution exposure time, environmental conditions, solvent, etc. For example, incomplete film coverage has been related with low hydroxyl content, surface roughness, surface defects etc.29 Also, Pertays et al.13 are bringing up some factors that are connected with optimal assembly - variations in temperature, hydroxyl ion content and presence of airborne carbonaceous material.
In our previous work25 the possibility of stearic acid film formation on CuNi and its application for corrosion protection was examined. The influence of CuNi pretreatment, solution temperature and drying temperature on the protective properties of stearic acid layer was studied as well. Based on the electrochemical and spectroscopic studies, a preparation procedure was proposed that resulted in formation of an ordered and protective stearic acid thin film. In this work the durability of corrosion protection by SAMs of stearic and palmitic acid on CuNi alloy exposed to chloride medium was investigated. Cupronickel alloys are often used in marine applications such as for naval vessels, pipelines or desalination plants. Therefore, prolongation of their service time is of quite interest. Protective organic films were formed by a solution deposition method. Ethanol solutions of selected organic acids of different concentration were used. In this way both the solvent and the acids forming the protective layer could be considered as environment friendly compounds.
Experimental
Materials
Cupronickel alloy rod (Cu 70% - Ni 30%) with a 1.3 cm diameter was obtained from Goodfellow Inc., UK. In order to prepare working electrodes, CuNi rod was cut-out in 0.5 cm thick samples and on their back side a copper wire was soldered. At the end they were embedded into epoxy resin and the exposed surface of the working electrode was 1.33 cm2. Stearic and palmitic acids were obtained from Sigma-Aldrich Corp. USA and ethanol was obtained from Lach-ner d.o.o. Croatia.
Sample preparation
Electrodes were abraded with emery paper grade 1000, 1500 and 2000 and polished with α – Al2O3 particle size 0.1 μm, degreased with ethanol in an ultrasonic bath and rinsed with re-distilled water.
The SAM formation was carried out by the following procedure25: oxide formation (24 h, 80°C, in a regular air convection oven) followed by acid adsorption (20 h, 40°C) and final drying step (5 h, 50°C in an air convection oven). Finally, samples were rinsed thoroughly with ethanol in order to remove any physisorbed molecules. It was found that without the final drying step at elevated temperatures monolayers were easily removed by rinsing with ethanol. Similar observations have been reported by other authors24 for SAMs of alkanoic acids on SS316L. Acid adsorption took place in solutions of different concentrations of stearic (SA) and palmitic (PA) acids (0.001 M; 0.005 M; 0.01 M; 0.03 M). For comparison, two types of blank samples were prepared, one on which native oxide layer was formed during 24 hours of exposure to air at room temperature (blank 25°C) and the other that was oxidized in oven for 24 hours at 80°C (blank 80°C). All measurements were done in triplicate.
Surface studies
The water contact angle measurements (CA) on bare cupronickel and the SA or PA treated samples were performed using a goniometer DataPhysics Contact Angle System OCA 20, with a drop of 2 μL water under the ambient atmospheric conditions. The scanning electron microscopy (SEM) morphology analysis of freshly prepared samples and after exposure to corrosive medium was performed by VEGA 3 SEM TESCAN at an acceleration voltage of 20 kV. The FTIR measurements were carried out using Attenuated Total Reflectance method on a Perkin–Elmer Spectrum One FTIR spectrometer, with the scan range from 4000 – 650 cm−1, having a resolution of 0.5 cm−1, and the results shown in this paper were averages of 25 scans.
The surface topography and the roughness of bare and protected samples were determined by atomic force microscopy (AFM) using a Multimode AFM with a Nanoscope IIIa controller (Bruker, Billerica, USA) with a vertical engagement 125 μm scanner (JV). Tapping mode imaging was performed under ambient conditions in air, by using silicon tips (RTESP, Bruker, nom. freq. 320 kHz, nom. spring constant of 42 N/m) and at a scan resolution of 512 samples per line. The linear scanning rate was optimized between 1.0 and 2.0 Hz at a scan angle of 0°. Images were processed and analyzed by means of the AFM NanoScope software (version 5.12r5). Roughness Analysis software option was used to perform roughness analyses on 5 × 5 μm2 imaged surface area.
Electrochemical measurements
The electrochemical investigations were conducted in a three electrode cell, in a solution simulating seawater, 3% NaCl. A platinum foil and saturated calomel electrode were used as the counter and reference electrode, respectively. The polarization measurements were performed in the wide (±150 mV vs. open circuit potential) and narrow (±20 mV vs. open circuit potential) potential range, at a potential scan rate of 0.166 mV s−1. The electrochemical impedance spectroscopy (EIS) was performed at the open circuit potential (Eocp) in the frequency range 100 kHz to 10 mHz with a 10 mVrms amplitude. The electrochemical measurements were performed using a Bio-Logic SP-300 potentiostat.
Results and Discussion
FTIR measurements
FTIR spectroscopy was used to confirm fatty acid film formation and to analyze the alkyl chain ordering in the monolayer. In the FTIR spectra of the modified substrates, the C-H stretches of the methylene group are used as the reference peaks for alkyl chain organization in the monolayer.17,18 If the FTIR spectrum is characterized by ν(CH2)asym ≤ 2918 cm−1 and ν(CH2)symm ≤ 2850 cm−1 it indicates that the alkyl chains in the film are ordered with the molecules organized in all-trans configuration on the substrate. Therefore, it appears that both stearic and palmitic acid, when used in 1 mM concentration, formed well-ordered films on CuNi alloy (Figures 1a and 1b). FTIR spectra of samples treated with higher concentrations of SA and PA also showed characteristic adsorption peaks at ν(CH2)asym ≤ 2918 cm−1 and ν(CH2)symm ≤ 2850 cm−1 indicating that the alkyl chains in the layer were ordered with the molecules organized in all-trans configuration. Therefore it appears that well ordered films were formed for all studied fatty acid concentrations.
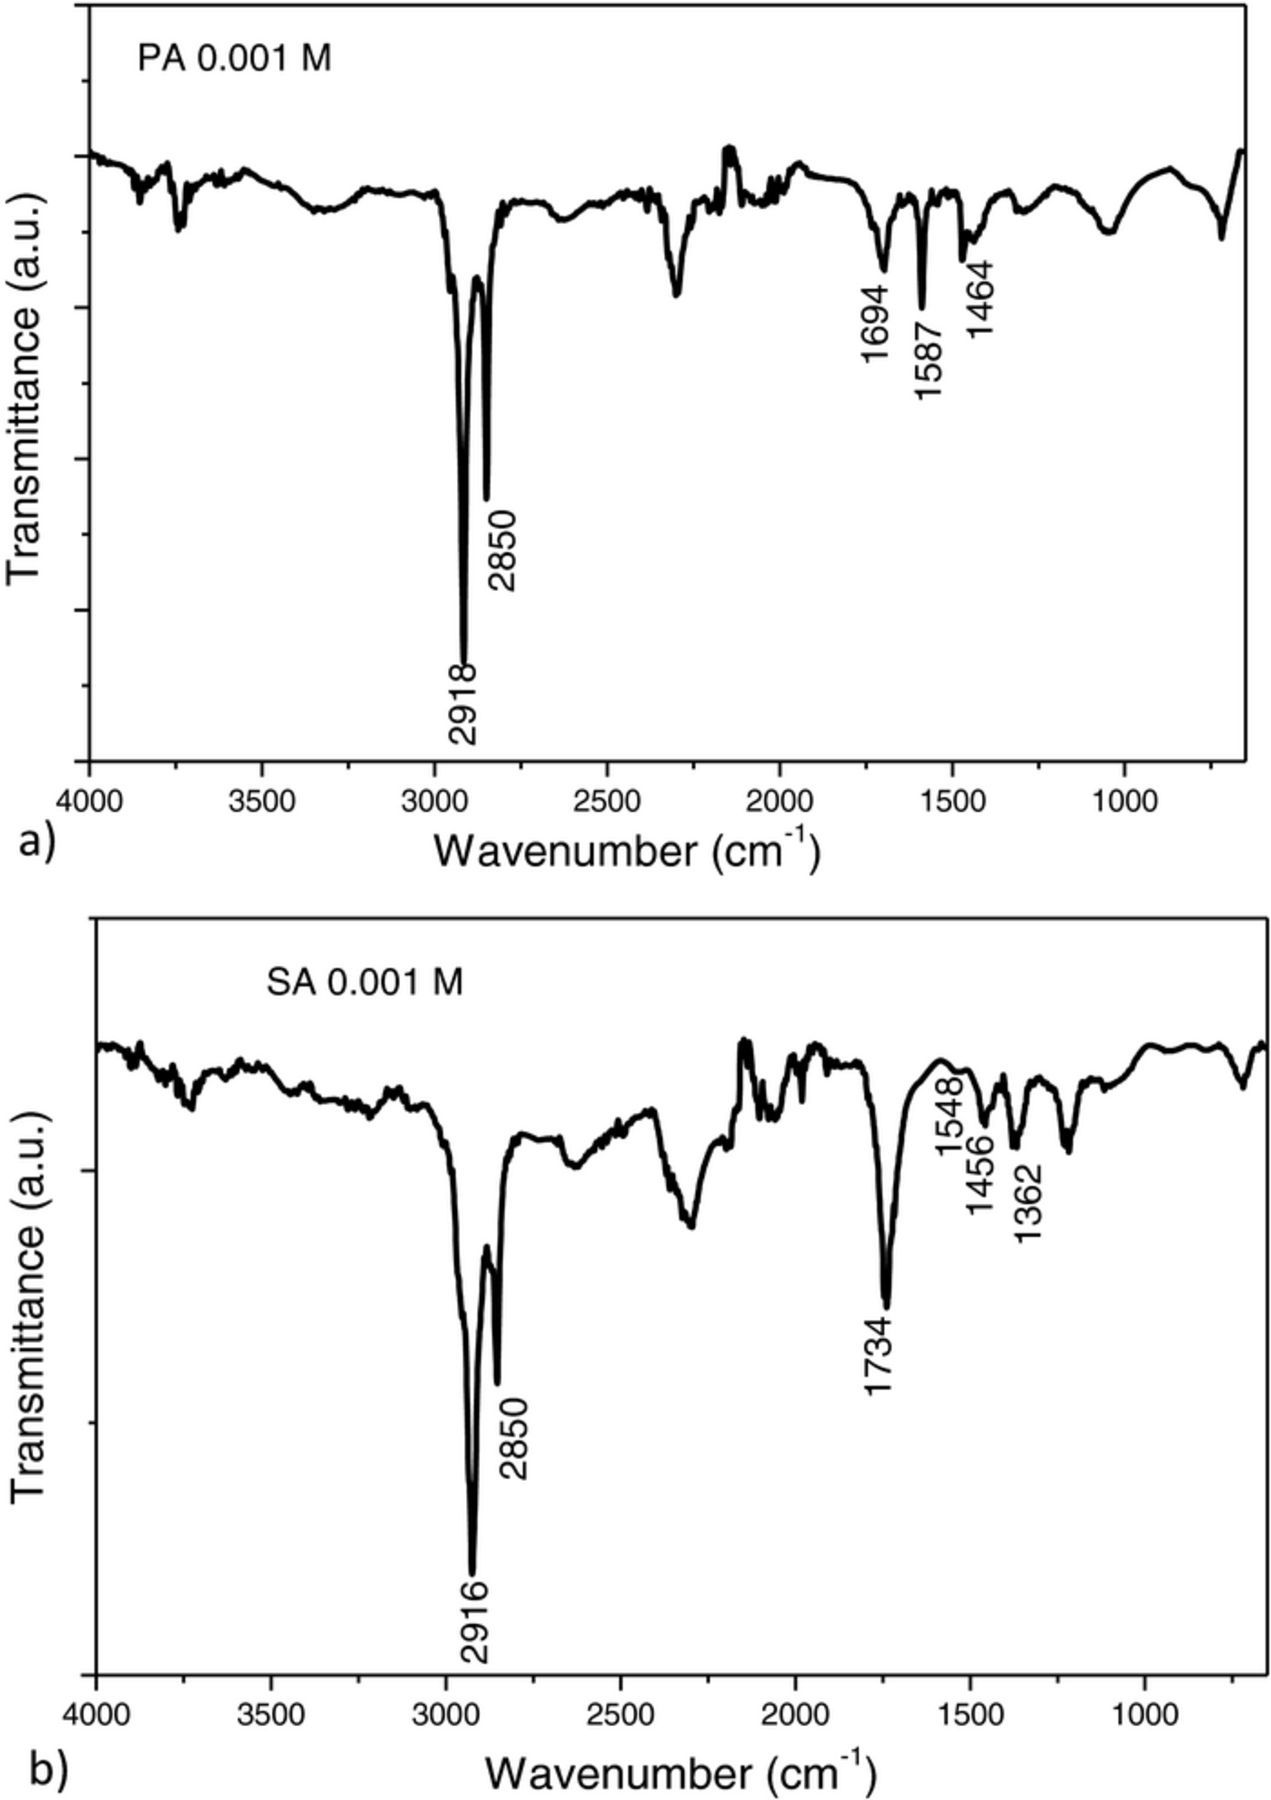
Figure 1. FTIR spectra of samples treated with a) 0.001 M palmitic acid and b) 0.001 M stearic acid.
The peak at 1730 cm−1 presents C=O stretching in a –COOH moiety, and the peak at 1700 cm−1 presents C=O stretching mode, which is characteristic of a hydrogen – bonded carboxylic moiety. The asymmetric COO− stretching mode is in the region 1650 – 1550 cm−1 and the symmetric COO− is in the region 1470 – 1360 cm−1. The presence of peak at 1730 cm−1 together with the presence of asymmetric and symmetric COO- stretching mode and the absence of peak at 1700 cm−1 indicate that the carboxylic headgroup underwent partial dissociation to form surface carboxylate species.30 The presence of asymmetric mode indicates a monodentate bonding configuration via single oxygen atom and the presence of symmetric mode alludes a bidentate bonding configuration via two oxygen atoms. Also, if there are both peaks present that indicates combination of mono- and bidentate bonding configuration.17 From FTIR spectra presented in Figures 1a and 1b it can be assumed that palmitic acid bonded on CuNi surface with combination of mono- and bidentate bonding and stearic acid with both oxygen atoms. FTIR spectra obtained at higher fatty acid concentrations are characterized by the appearance (SA) or increase in intensity (PA) of a peak corresponding to the C=O stretching mode at 1696 cm−1. Studies performed on stearic acid multilayers show that the intensity of this adsorption peak increases with the number of SA layers.31 Thus, it may be proposed that the SA and PA films formed at 1 mM concentration are probably monolayers while multilayers formed in the more concentrated solutions multilayers have formed.
Contact angle measurements
Contact angles of water were measured on two kinds of blank samples and on all samples treated with different concentrations of SA and PA. As can be seen from results presented in Table I, surfaces of both nontreated samples were hydrophilic, with contact angle of approximately of 60°. After the fatty acid film formation, surface became hydrophobic with contact angles above 100°. There was no big difference in contact angle values obtained for different concentrations of SA and PA. Still, on palmitic acid films the water contact angle was slightly higher than on stearic acid films. The hydrophobic property of the treated CuNi surface may be related to CH3 terminated SAM. These results are in good agreement with those given in literature for SAMs of carboxylic acids on other metallic surfaces.17,24
Table I. Comparison of water contact angles on nontreated samples and samples treated with different concentrations of SA and PA.
| Nontreated samples | Contact angle values (°) | |
|---|---|---|
| blank 25°C | 60 ± 3 | |
| blank 80°C | 62 ± 3 | |
| Treated samples | SA | PA |
| c = 0.001 M | 103 ± 1 | 109 ± 1 |
| c = 0.005 M | 102 ± 2 | 105 ± 1 |
| c = 0.01 M | 105 ± 1 | 111 ± 2 |
| c = 0.03 M | 103 ± 2 | 105 ± 1 |
AFM studies
While FTIR results were used to characterize alkyl chain ordering, AFM imaging was performed to obtain information about the height and integrity of the barrier between the metal and the environment. The surface morphologies of SA films on a cupronickel alloy are shown in Figure 2, while average roughness Ra values32 are given in Table II. The surface profile showed a nanometer range height variation for the blank sample. Modified surface with a similar roughness values compared to control bare surface of alloy are considered to be covered by films of monolayer height that follow the contour of the surface.19 Therefore it may be concluded that samples modified by 1 mM SA were covered by a SA monolayer which is in accordance with the conclusions based on FTIR data. At higher stearic acid concentration 3-D structured layer was formed. From AFM images it cannot be definitely concluded if upper part of this 3-D structure consisted of agglomerates or defect multilayer structure was formed. However, it should be stressed that samples were rinsed with ethanol before measurements were conducted, thus most of the weakly adhering SA molecules or agglomerates should have been washed off the CuNi surface. It should also be taken in account that preparation procedure involved drying step at 50°C during which the reorganization of molecules in the layer might occur, leading to more ordered structure. As FTIR data point to the presence of ordered structures for all fatty acid concentrations, it may be proposed that these 3-D structures represent multilayers with certain amount of defects.
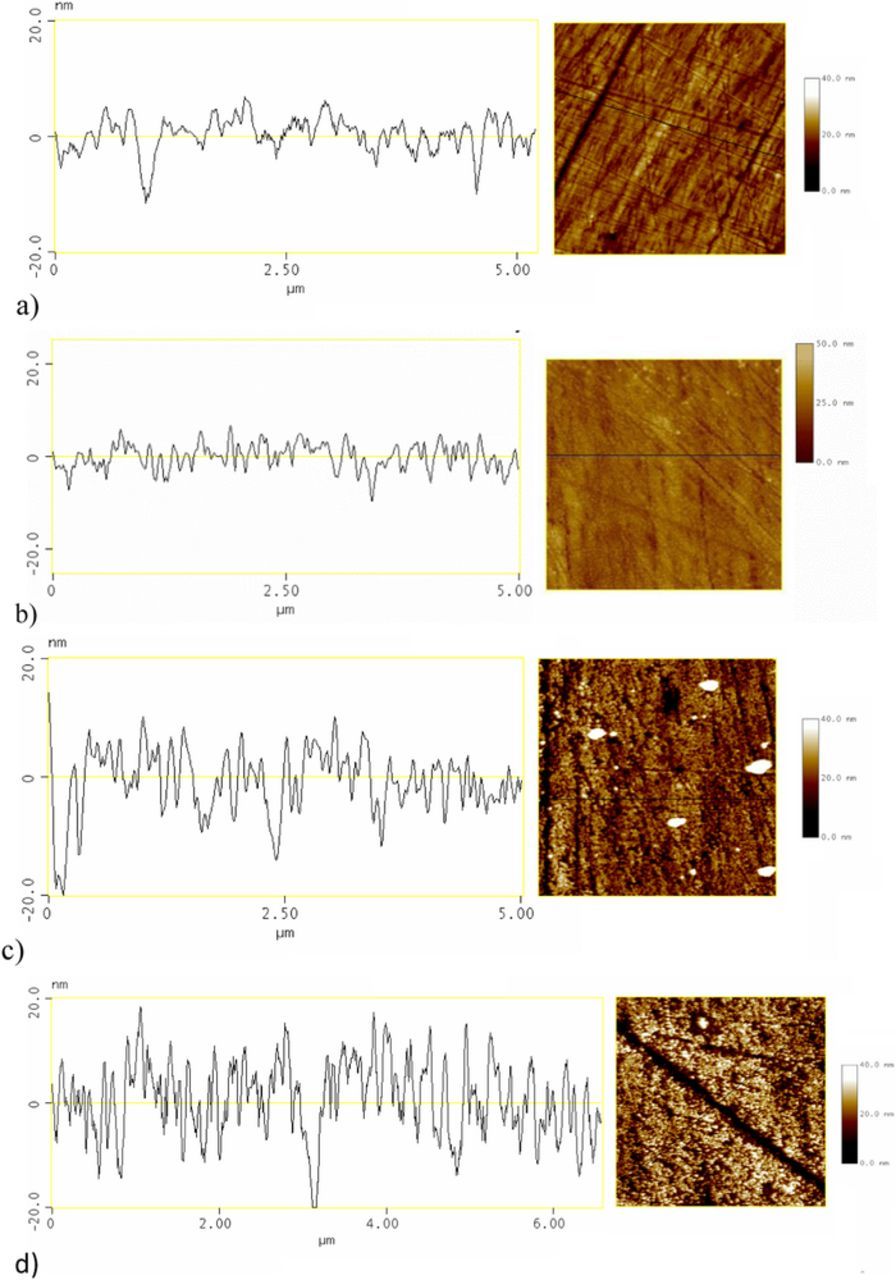
Figure 2. Surface topography and corresponding section analysis. of a) bare cupronickel alloy and samples modified in b) 1 mM stearic acid, c) 5 mM stearic acid and d) 30 mM stearic acid.
Table II. The roughness parameters of bare and treated CuNi samples.
| c(SA) /mM | 0 | 1 | 5 | 30 |
|---|---|---|---|---|
| Ra/nm | 2.42 ± 0.07 | 1.96 ± 0.03 | 5.2 ± 0.2 | 6.47 ± 0.01 |
The surface topography of bare CuNi and the one modified by 1 mM exhibited relatively similar features with visible polishing lines. It is also interesting to notice that parts of the surface corresponding to polishing lines became deeper with increase in stearic acid concentration, this may be an indication that the diffusion of SA into depression was limited.
The samples treated with higher concentrations of SA (for which multilayer structure was proposed) had blurry appearance, while those treated with the lowest concentration were shiny; the same was observed for PA treated samples. Therefore, it was assumed that the PA samples treated with 1 mM concentration were covered by a monolayer, while at higher PA concentrations multilayers were formed.
Electrochemical measurements
The protective properties of films of stearic and palmitic acid formed on CuNi samples were examined by potentiodynamic polarization in a wide potential range (±150 mV vs. open circuit potential). Measurements were conducted after 1h of immersion of samples in 3% NaCl solution, as this was sufficiently long time for all studied samples to reach the steady state. The representative polarization curves obtained for treated and blank CuNi samples (oxidized at 25 and 80°C) are given in Figure 3. As can be seen, all polarization curves recorded on either PA or SA treated samples showed lower current densities than those obtained for blank samples. With the increase of fatty acid concentration, cathodic current densities tended to decrease (except for the highest concentration PA and the lowest SA concentration). This indicates that an effective barrier to oxygen diffusion toward alloy surface was formed especially for higher fatty acid concentrations, exhibiting 3-D structures. The significant decrease of anodic current densities was observed mostly for the lower PA or SA concentrations while for the highest concentration anodic curve remained similar to nontreated samples.
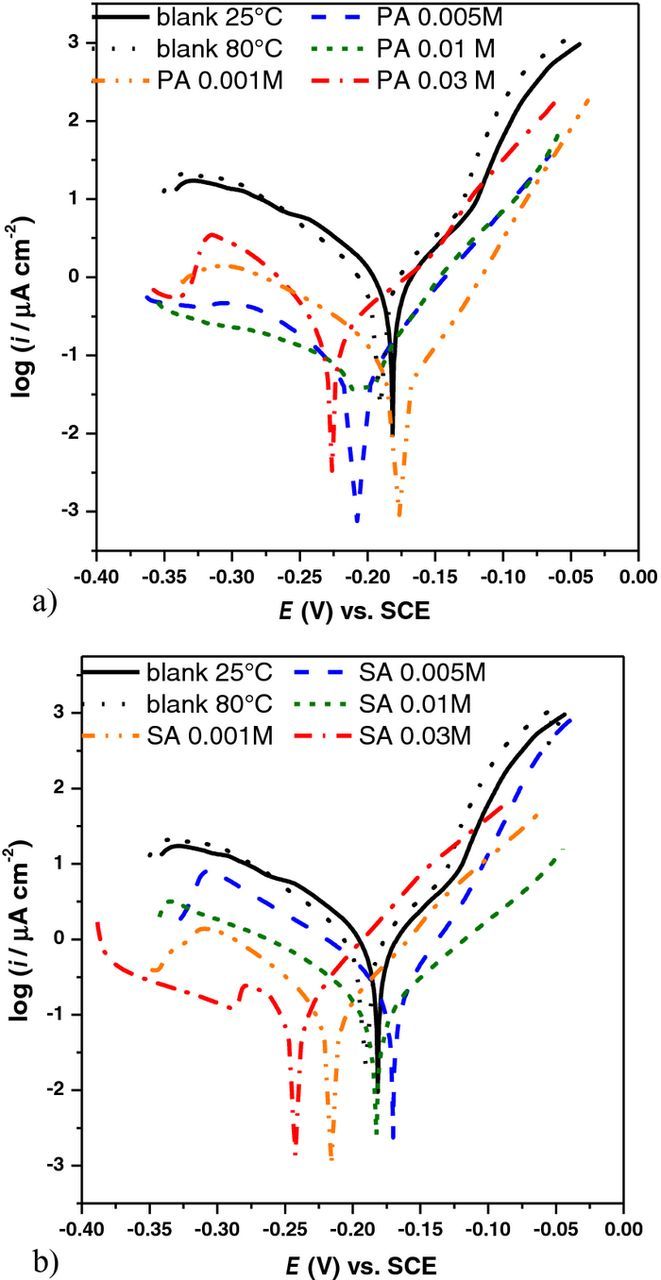
Figure 3. Polarization curves obtained in 3% NaCl for CuNi alloy (blank) and alloy modified with different concentrations of a) palmitic acid; b) stearic acid.
Table III presents the corrosion parameters obtained from the polarization curves by Tafel extrapolation method: corrosion potential (Ecorr), corrosion current density (icorr), anodic and cathodic Tafel slopes (ba and bc); inhibiting efficiency (ηi), calculated by Equation 1:
![Equation ([1])](https://content.cld.iop.org/journals/1945-7111/163/5/C145/revision1/d0001.gif)
where icorr,0 and icorr,i represent corrosion current densities of blank and treated sample respectively.
Table III. Corrosion parameters obtained by Tafel extrapolation method.
| ηi (%) | ||||||
|---|---|---|---|---|---|---|
| Sample | Ecorr (mV) vs. SCE | icorr (μA cm−2) | ba (mV dec−1) | −bc (mV dec−1) | Blank 25°C | Blank 80°C |
| Blank 25°C | −177 ± 6 | 1.115 ± 0.105 | 78 ± 21 | 97 ± 5 | - | - |
| Blank 80°C | −180 ± 9 | 1.100 ± 0.060 | 59 ± 9 | 83 ± 9 | - | - |
| PA 0.001 M | −174 ± 8 | 0.049 ± 0.010 | 46 ± 6 | 69 ± 4 | 95.6 | 95.5 |
| PA 0.005 M | −201 ± 10 | 0.053 ± 0.014 | 49 ± 2 | 98 ± 8 | 95.2 | 95.2 |
| PA 0.01 M | −209 ± 6 | 0.089 ± 0.010 | 52 ± 3 | 189 ± 54 | 92.0 | 91.9 |
| PA 0.03 M | −208 ± 25 | 0.157 ± 0.040 | 68 ± 8 | 63 ± 11 | 85.9 | 85.7 |
| SA 0.001 M | −201 ± 12 | 0.093 ± 0.020 | 50 ± 2 | 79 ± 16 | 91.7 | 91.5 |
| SA 0.005 M | −180 ± 12 | 0.189 ± 0.030 | 47 ± 8 | 66 ± 10 | 83.0 | 82.8 |
| SA 0.01 M | −182 ± 8 | 0.135 ± 0.011 | 63 ± 7 | 87 ± 12 | 87.9 | 87.7 |
| SA 0.03 M | −221 ± 30 | 0.119 ± 0.026 | 47 ± 1 | 80 ± 13 | 89.3 | 89.2 |
Based on the polarization measurements, it could be assumed that the increase in fatty acid concentration might have adverse effect on the inhibiting efficiency. On the one hand, increased fatty acid concentration results in a thicker, protective layer, on the other hand adsorption of acid from more concentrated solution leads to formation of higher number of nucleation sites33 and faster formation of multilayers, that can result in less ordered layer structure19 with higher number of defects. For example, the slightly higher cathodic currents obtained on PA 0.03 M sample compared to samples treated with lower PA concentrations, could be related to the reduction of corrosion products formed during the exposure to corrosive medium. ie. diffusion of copper ions from the substrate surface is slowed down by the presence of a thick 3-D structure. On the other hand, less compact film structure led to the lower surface coverage, enabling higher dissolution rate of the substrate, once aggressive compounds reached the CuNi surface. Thus increase of both anodic and cathodic current densities was observed leading to the increase of overall corrosion rate compared to lower PA concentrations.
The ratio between the inhibiting efficiency of anodic and cathodic corrosion process determines the value of corrosion potential. If a decrease in cathodic reaction rate is more pronounced than a decrease in anodic reaction rate, the corrosion potential will be shifted toward more negative values. In the opposite case, the corrosion potential will be shifted toward more positive values. For this reason, the most negative Ecorr values were observed for the samples treated with the highest PA or SA concentration, as the protective film was thick and efficiently slowed down the cathodic corrosion reaction while decrease in anodic reaction rate was not significant. For other fatty acids concentrations, the corrosion potential was not significantly changed compared to a blank sample (about ±20 mV) as both anodic and cathodic corrosion processes were slowed down.
From the results presented in Table III it can be seen that the corrosion current densities were relatively similar for both nontreated samples, and 5–20 times lower for treated samples. The inhibiting efficiency in case of the PA was around 95% for all samples, except the sample treated with the highest concentration. The inhibiting efficiency for SA was slightly lower, but still in the range 83 – 92%. These values are in line with the results obtained by other authors who have examined corrosion protection of copper and its alloys by self-assembled monolayers of long chain organic compounds: for example Feng et al.9 observed ηi = 96% for copper in 0.5 M NaCl protected by a SAM of 1-dodecanthiol. Xu et al.28 obtained much lower protection of cupronickel with SA, only 66.85%, which is probably related to a different film formation procedure.
It is important to notice that oxidation of blank sample at 80°C did not result in a significant change of corrosion properties of CuNi, i.e. oxide layer formed at elevated temperature was not the primary cause of increased corrosion resistance of treated samples.
Although SAMs of both studied carboxylic acids provided good initial corrosion protection to the underlying alloy it was important to verify if the protection remained over time or decreased with prolonged exposure of samples to chloride medium. For that reason polarization measurements in narrow potential range were performed over time. (Figure 4).
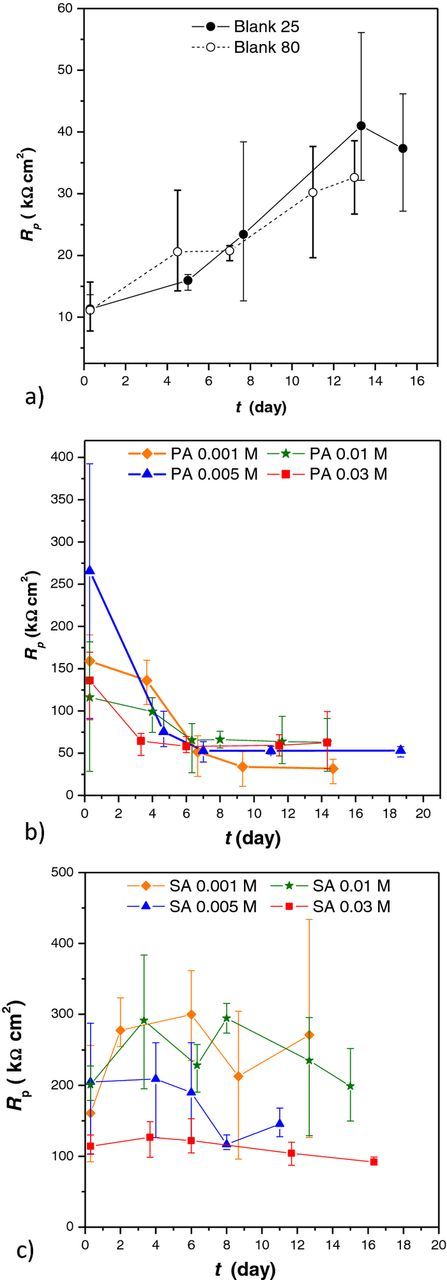
Figure 4. Polarization resistance as a function of immersion time in the sodium chloride solution for (a) nontreated samples and samples treated with (b) palmitic acid and (c) stearic acid.
Results obtained for both blank samples indicated improvement of corrosion resistance with increased exposure to corrosive medium. This observation is in accordance with literature data explaining this behavior by a buildup of protective corrosion products on the CuNi surface.34,35
Polarization resistances (Rp) measured after 1 hour immersion for both PA and SA treated samples were much higher than that of nontreated samples. Rp values for PA samples were higher than for SA, but they decreased with time and after 10 days approached values similar to that of nontreated samples. The polarization resistances of SA treated samples varied with time but after 10 days of immersion they were still higher than that of nontreated samples.
In order to better understand corrosion behavior of studied samples EIS was performed. From the EIS spectra obtained for blank samples after one hour of immersion (Figs. 5a and 5b), two processes with time constants at medium frequencies were detected for both nontreated samples. After six days, a third phase angle maximum was observed for the Blank 25 sample (Fig. 5c) which might correspond to a redox process involving corrosion products that build up above the oxide film.36 Kato et al.37 showed that protective film formed on CuNi in chloride solution is comprised of a relatively thick outer layer, mainly Cu2(OH)3C1, and an inner protective thin layer containing appreciable chloride, oxygen, and copper, and some nickel. The outer phase of basic copper chloride formed early in the film formation process by a reconstitution of the initial cuprous oxide phase with involvement of a transient carbonate phase. In case of the Blank 80 sample the low frequency time constant was not observed. Probably the oxide layer formed at higher temperature was more compact and stable thus hindering formation of Cu2(OH)3C1.
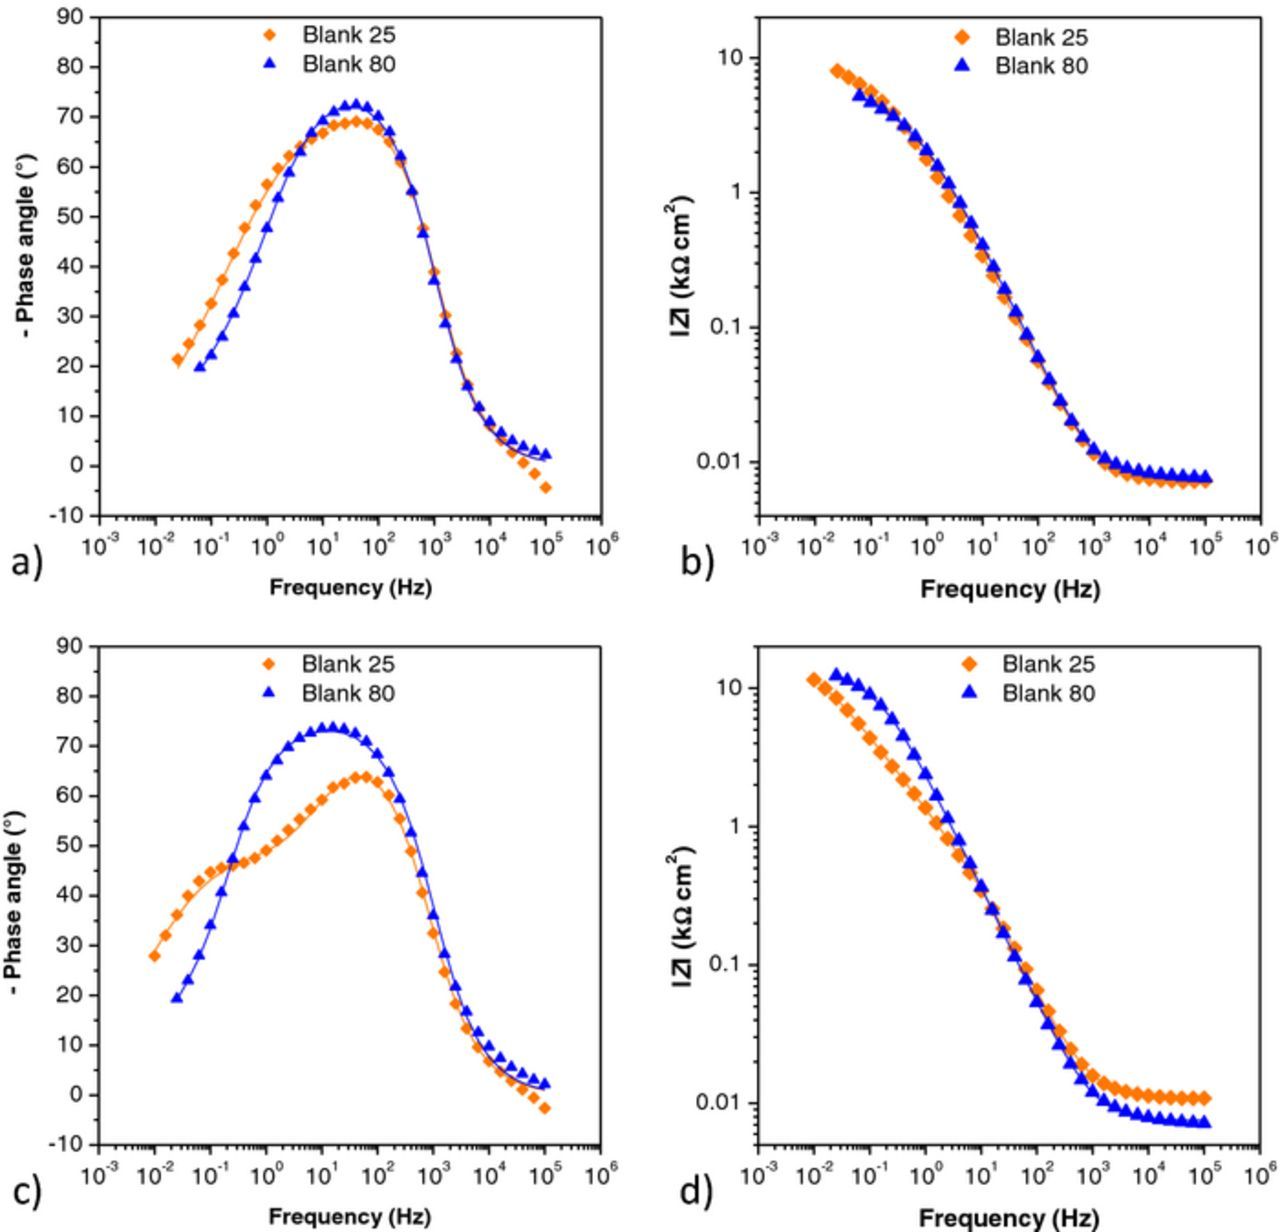
Figure 5. EIS – Bode plots for blank samples, a) and b) after one hour; c) and d) after six days. Symbols: experimental data; solid lines: modeled data according to electrical equivalent circuits given in Fig. 7.
For all four PA treated samples after one hour of immersion (Figs. 6a and 6b) phase angle maximums were observed at higher and medium frequencies. The time constant at higher frequencies was probably related to the presence of a surface layer and the other at medium frequencies to corrosion of the substrate. Appearance of the time constant related to the surface layer indicates that on all samples a protective layer was formed. This is in accordance with the fact that the impedance modulus at the lowest frequencies of all PA treated samples was more than ten times bigger than that of blank samples. However, it decreased in time (Fig. 6d) approaching the impedance values of blank samples (Fig. 5d), which is an indication of PA layer desorption. The decrease of impedance was especially pronounced for the sample treated with the lowest PA concentration. This behavior is in good agreement with the results obtained by polarization measurements in a narrow potential range (Fig. 4b) where polarization resistance of PA treated samples was decreasing in time.
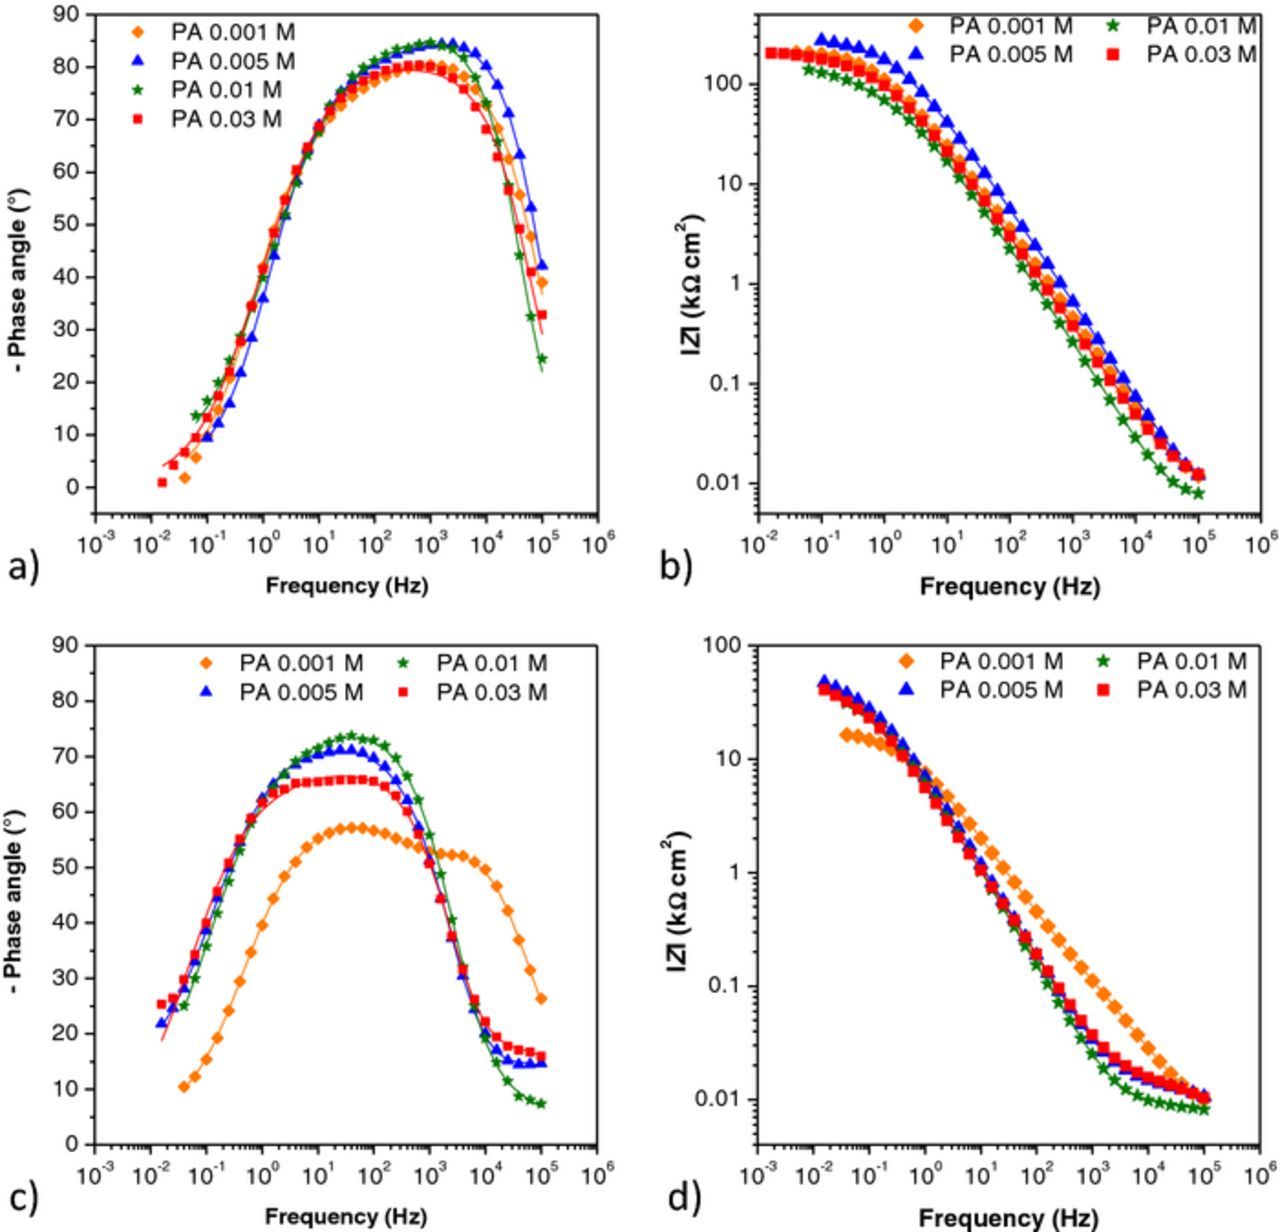
Figure 6. EIS– Bode plots for samples treated with all four concentrations of palmitic acid, a) and b) after one hour; c) and d)) after six days. Symbols: experimental data; solid lines: modeled data according to electrical equivalent circuits given in Fig. 7.
For fitting the impedance data shown in Figures 5 and 6, electrical equivalent circuits are proposed as shown in Figure 7. All electrical circuits include the electrolyte resistance between the working and reference electrodes, Rel. Due to the frequency dispersion, capacitive elements in real electrochemical systems are usually represented by constant phase element CPE. The impedance of CPE is defined as
![Equation ([2])](https://content.cld.iop.org/journals/1945-7111/163/5/C145/revision1/d0002.gif)
where Q is the constant of the CPE element, j imaginary number, ω is the angular frequency, and n is the CPE exponent where −1 ≤ n ≤ 1.38 The value of n is associated with the non-uniform distribution of current as a result of roughness and surface defects. The n values of nearly one suggest nearly ideal capacitive behavior. The value of pseudocapacitance C can be calculated using relationship C = (QRb1−n)1/n according to Brug et al.39
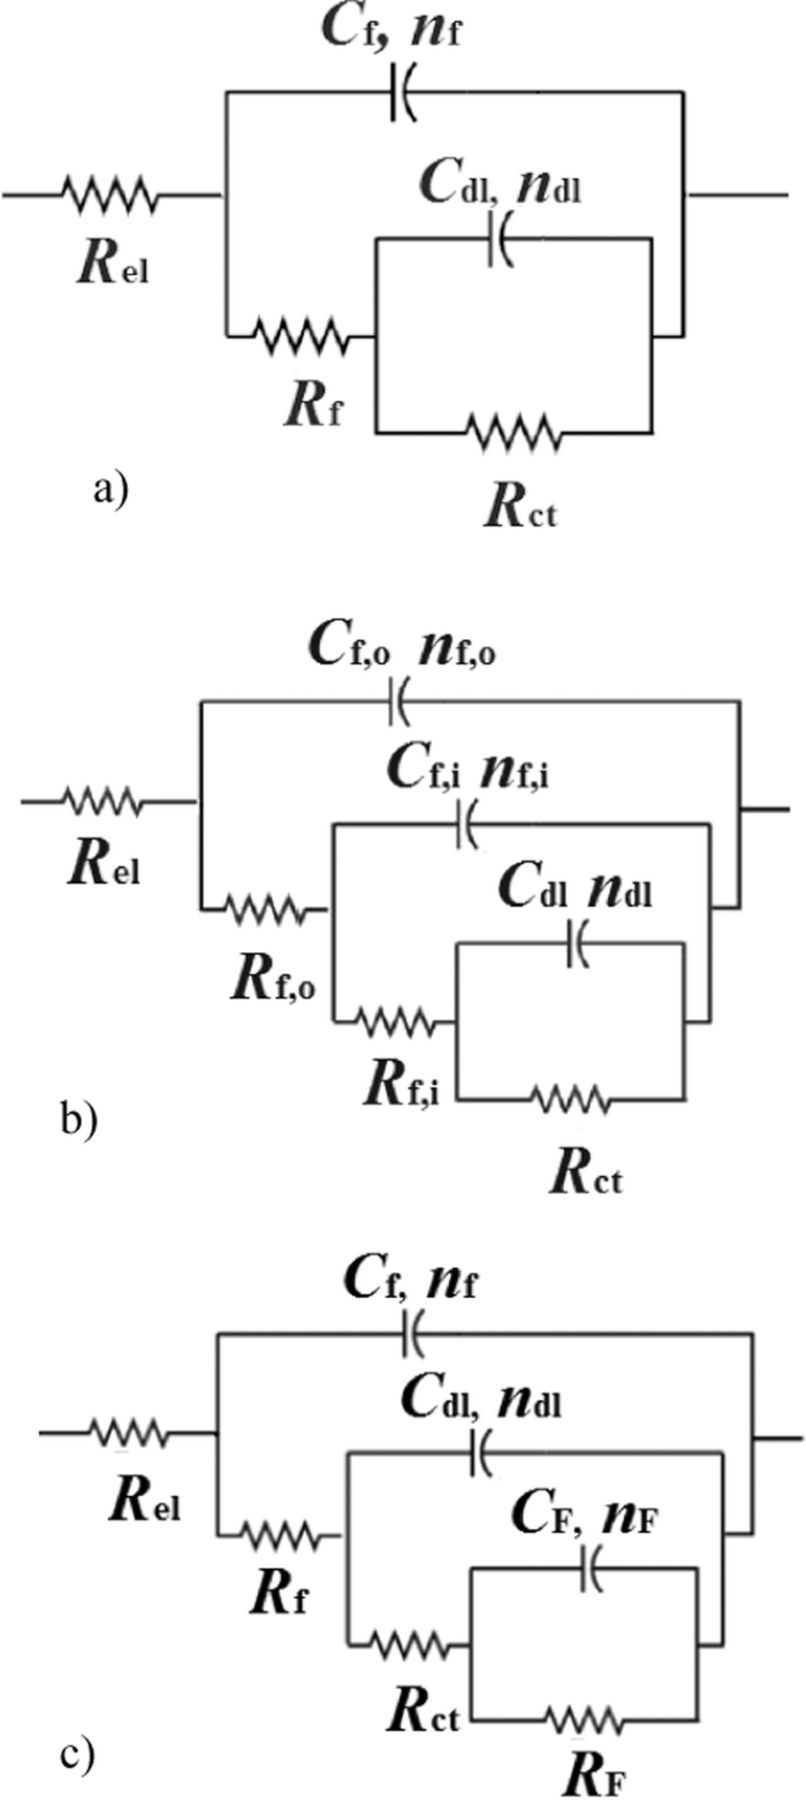
Figure 7. Equivalent electrical circuits used for fitting the EIS data: a) 2RC circuit, b) 3RC circuit used for fitting treated samples, c) 3RC circuit used for fitting blank 25 sample.
The 2RC circuit (Figure 7a) used for fitting the EIS spectra of Blank 80, most of the PA treated samples and the first spectrum of Blank 25, consists of Rf – Cf and Rct – Cdl couples. The Rf – Cf couple describes a time constant observed at high frequencies, where Rf corresponds to the resistance due to an ionic flow and the Cf to the capacitance of the surface oxide or organic film associated with the dielectric property of this film. The Rct – Cdl couple presents the corrosion reaction at the metal substrate/solution interface, where Rct is charge transfer resistance and Cdl is double layer capacitance.
The 3RC circuit given in Figure 7b was used for fitting some of the EIS spectra obtained for PA or SA treated samples (explained in following sections). This equivalent circuit describes an additional process observed at the highest frequencies attributed to formation of an outer porous layer, with Cf,o as a capacitance and Rf,o as a pore resistance of porous layer.
The 3RC circuit describing behavior of the blank samples (Figure 7c) has an additional time constant at low frequencies corresponding to a redox process involving the corrosion products, presented by faradaic resistance, RF, and faradaic capacitance, CF.40
The impedance parameters obtained by fitting the EIS data for blank and PA treated samples to selected electrical equivalent circuits are presented in Figure 8.
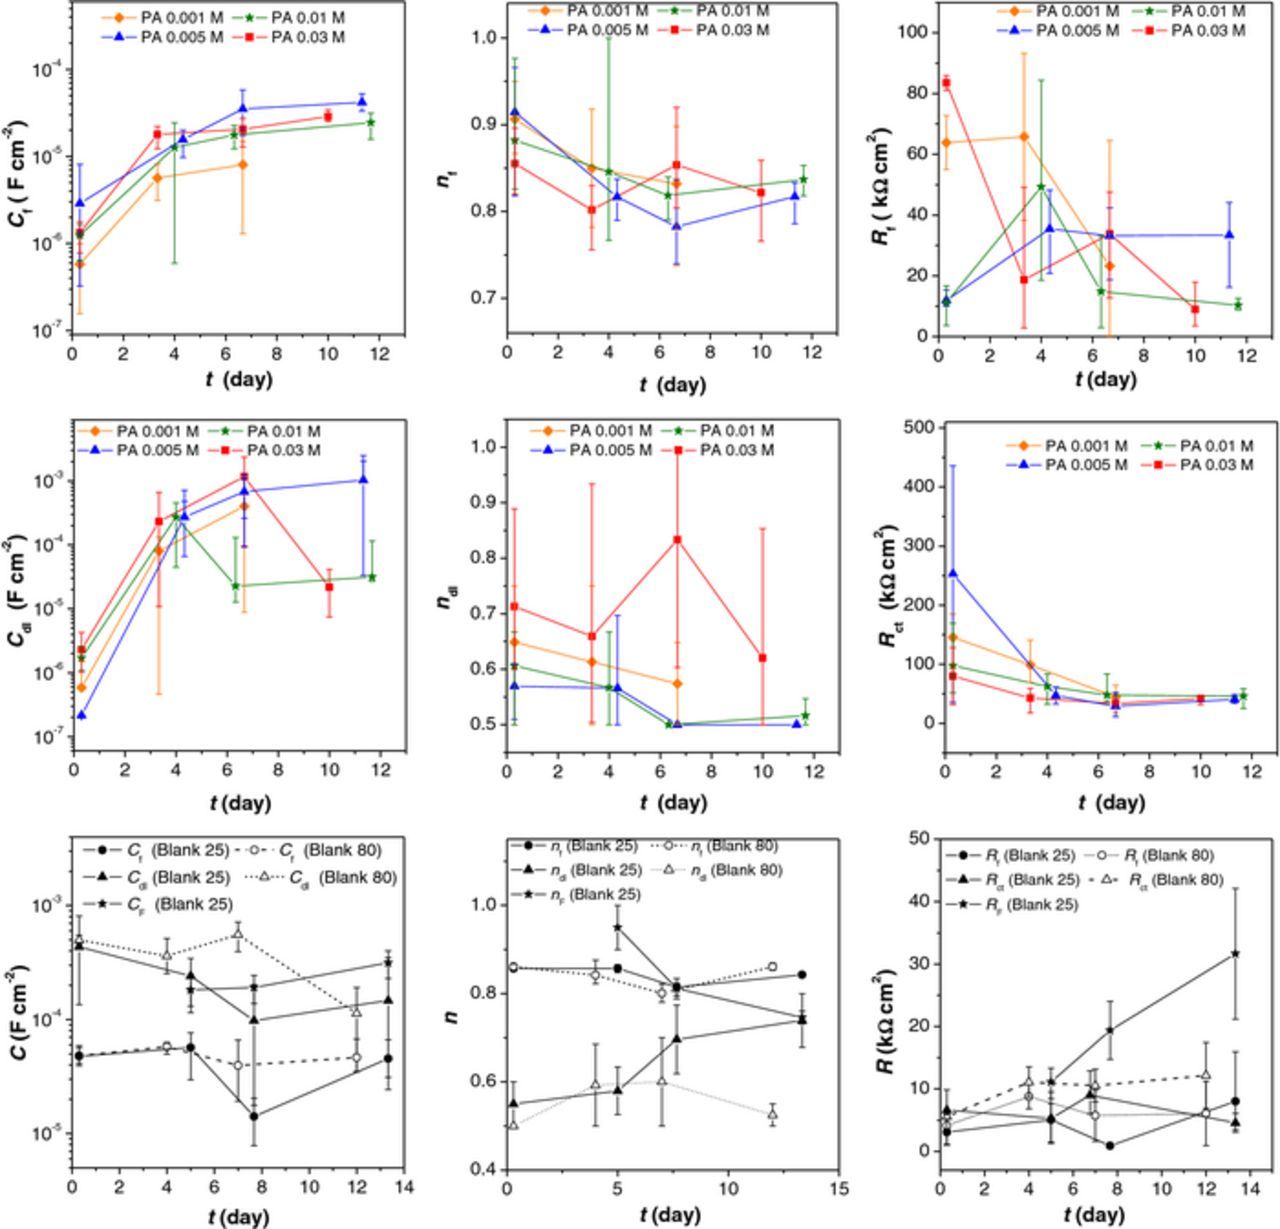
Figure 8. Fitted EIS data (Cf – film capacitance, Rf- film resistance, Cdl- double layer capacitance, Rct – charge transfer resistance, CF- Faradaic capacitance, RF – Faradaic resistance, nf, ndl, nF – coefficients describing non ideal capacitive behavior) obtained for blank samples and samples treated with palmitic acid.
The oxide layer resistance and capacitance of the Blank 80 sample is higher than that of the Blank 25 (Fig. 8). It can be assumed that the heating pretreatment led to formation of thinner and more compact oxide layer compared to the layer formed at room temperature. Time evolution of CF and RF values for Blank 25 indicates that the amount of corrosion products increased with time but at the same time they became more protective.
For all samples treated with PA, the film capacitance increased while the film resistance decreased with time, which may be explained by simultaneous water penetration into the pores of the PA film and its dissolution. Only for the lowest concentration this trend changed on the sixth day of exposure to NaCl solution (i.e. Cf has decreased) which is probably because of oxide formation on the surface. The charge transfer resistance decreased with time for all samples, and after eight days of the immersion, values were similar to the nontreated sample Blank 80. In the same manner, the double layer capacitance increased in time, and then decreased approaching the values for Blank 80. All these changes in EIS parameters imply that all PA layers, dissolved with time. The EIS spectra of PA treated samples after longer exposure to corrosive medium exhibited an additional time constant at high frequencies (i.e. spectra were best fitted with the 3RC circuit given in Figure 7b). However, fitting of this circuit involved significant extrapolation as the time constant of this process was outside the experimental frequency range. Still, appearance of this high frequency time constant indicated formation of thick but poorly protective (Rf,o around 5–10 Ω cm2) outer layer.
EIS was also performed for samples treated with stearic acid (Figure 9). After one hour of immersion, the impedance modulus at the lowest frequencies of all samples was around 100–300 kΩ cm2, similar to the values observed for the PA treated samples. After several days of immersion impedance slightly changed (Fig. 9d) but it was still significantly bigger than that of blank or PA treated samples. Phase angle curves for the first day of immersion showed a broad peak at medium and high frequencies (Fig. 9a). With time, an additional small peak appeared at the highest frequencies. Despite the fact that for the highest SA concentration (0.03 M) the value of impedance modulus (Figs. 9b and 9d) was practically constant with time, changes in the shape of phase angle curve reflected transformations in the layer upon the exposure to chloride medium.
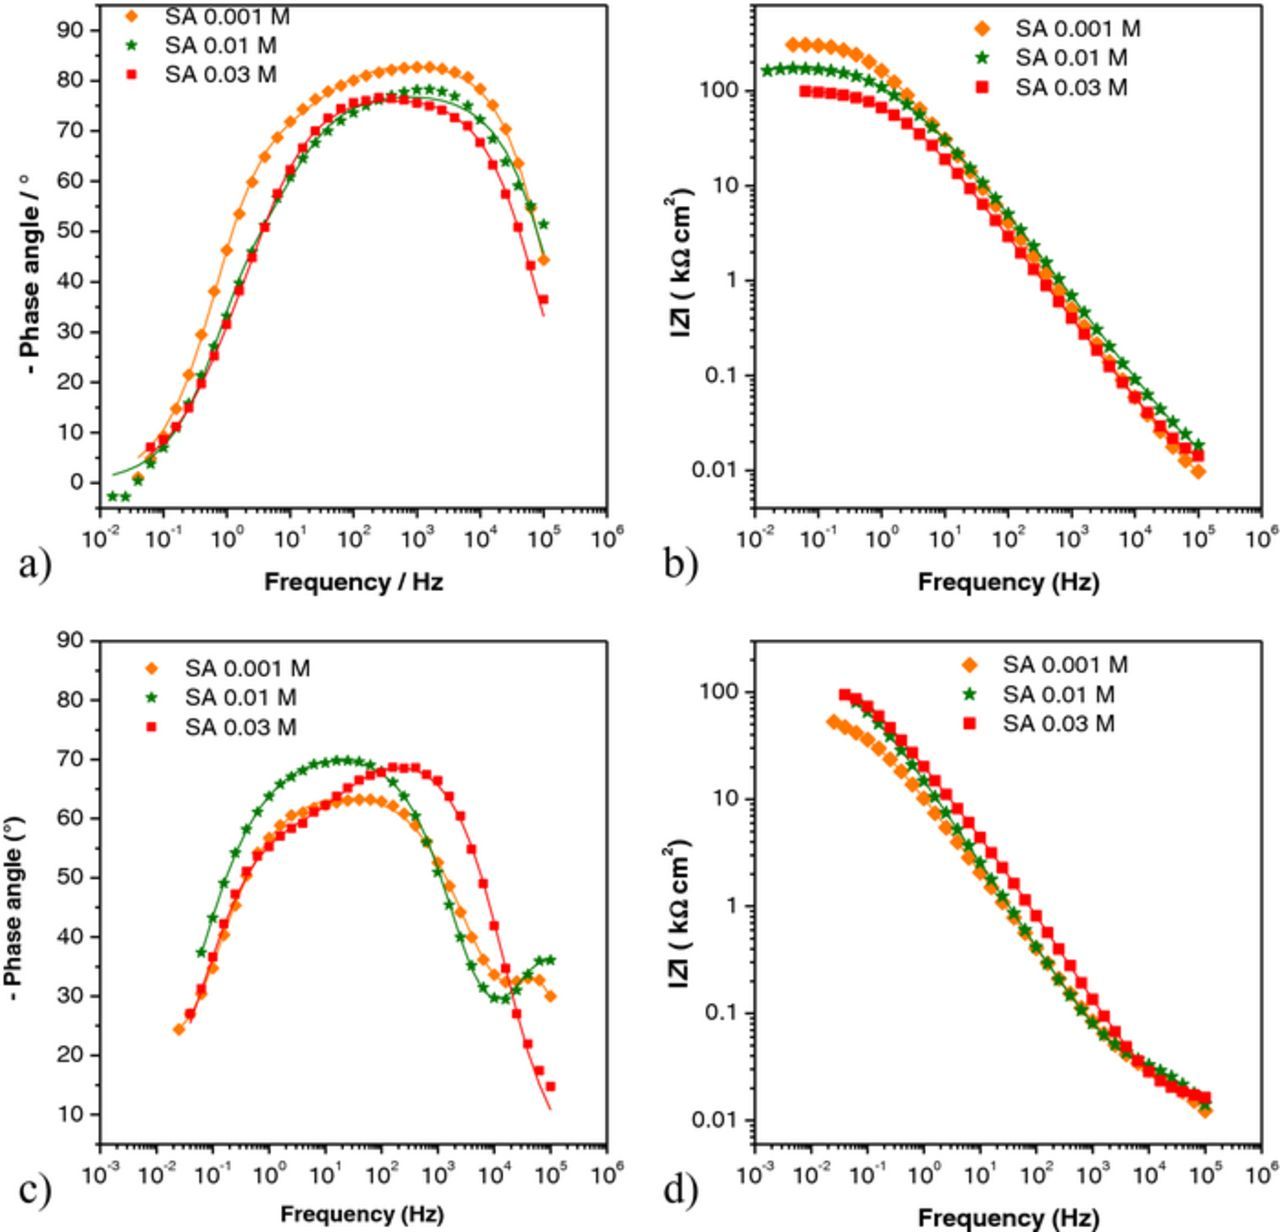
Figure 9. EIS data – Bode phase angle for samples treated with all four concentrations of stearic acid, a) and b) after one hour; c) and d)) after six days. Symbols: experimental data; solid lines: modeled data according to electrical equivalent circuits given in Fig. 7.
The EIS spectra obtained after one hour of immersion were fitted to the 2RC circuit (Figure 7a) while those obtained after several days of immersion with the 3RC circuit (Figure 7b) except for the sample treated with 0.03 M SA.
The Rf,o – Cf,o circuit was not clearly observed on EIS spectra obtained after 1 hour of immersion, unlike for spectra recorded upon longer exposure to chloride solution. Tao et al.16 showed that exposure of Al or Cu covered by long chain n-alkanoic acids leads to structural rearrangements of the quasi 2-D structures to 3-D distributions of domains of bulk-like crystalline and disordered phases. Such transition has probably also occurred on PA and SA treated samples studied in this work. As can be seen in Figure 10, both the capacitance (Cf,o) and resistance (Rf,o) of the outer porous layer decreased with time. Such behavior could be attributed to penetration of water into the SA film causing the partial dissolution of SA molecules and growth of the holes in the layer.41,42 For the highest SA concentration (0.03 M) formation of an outer porous layer was not clearly observed but it cannot be completely ruled out as it is possible that it would be seen at frequencies higher than those used in this study. As for inner layer parameters, (Cf,i and Rf,i), film capacitance increased with time, while resistance decreased for all samples due to water penetration into the film. The decrease in film resistance was the smallest for the SA 0.01 M sample and the greatest for the SA 0.03 M sample. The charge transfer resistance oscillated with time for all samples, but it should be pointed out that these values were higher than values for nontreated sample, with SA 0.001 M as the exception. From the given results it can be concluded that the layer formed with SA 0.01 M provided the best protection, without significant layer destruction during the exposure to the aggressive media.

Figure 10. Fitted EIS data (Cf,o – outer film capacitance, Rf,o – outer film resistance, Cf, i – inner film capacitance, Rf,i – inner film resistance, Cdl- double layer capacitance, Rct – charge transfer resistance, nf,o, nf,i, ndl – coefficients describing non ideal capacitive behavior) obtained for samples treated with stearic acid.
Scanning electron microscopy
Finally, scanning electron microscopy measurements were performed. Samples were analyzed before and after exposure to the NaCl for 10 days, and results are presented on Figure 11 for Blank 25, SA and PA 0.001 M.
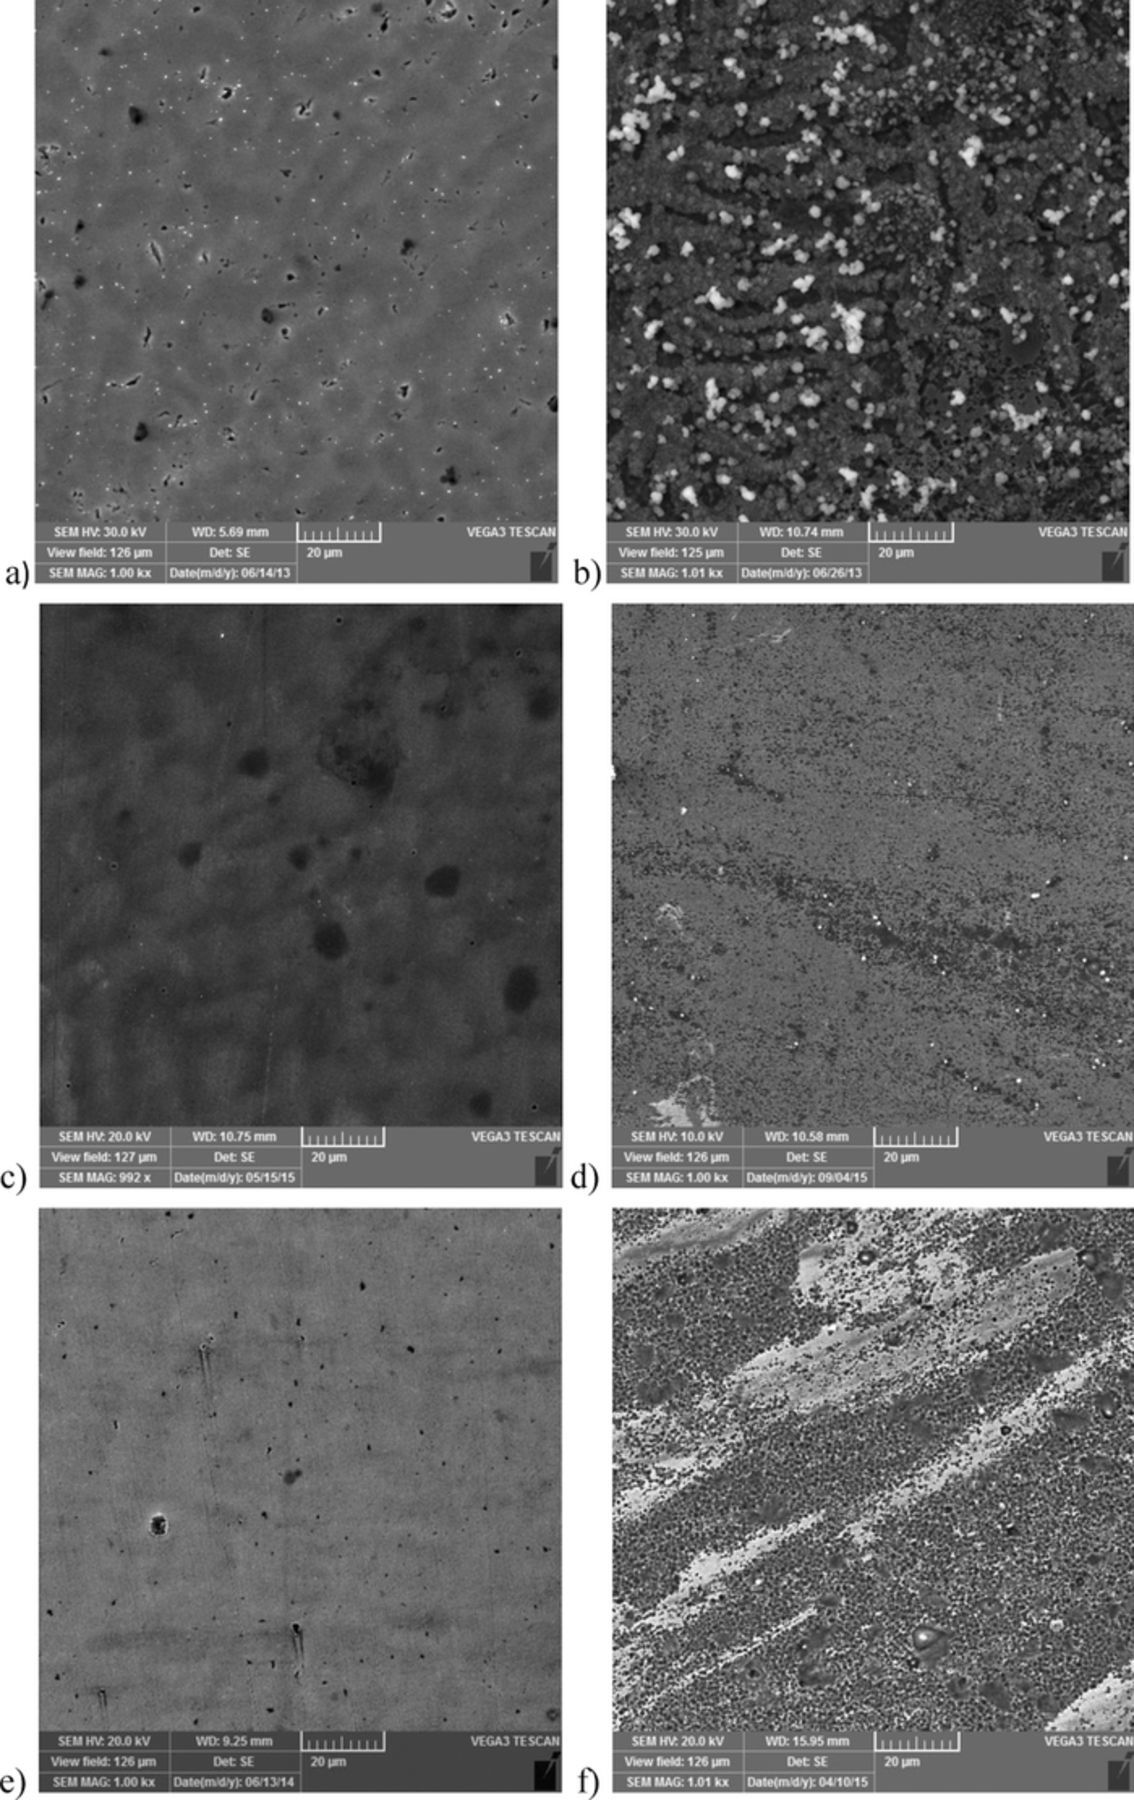
Figure 11. SEM images of: Blank 25 sample (a) before and (b) after exposure to NaCl; sample treated with SA 0.001 M, (c) before and after (d) exposure to NaCl; sample treated with PA 0.001 M, (e) before and (f) after exposure to NaCl.
It can be seen that before exposure to NaCl the surface of nontreated sample was smooth with small cracks in the oxide layer, and after 10 days in the NaCl solution, the surface was covered with corrosion products which is in good correlation with previous results.
The SA 0.001 M sample surface was relatively uniform with only few small cracks and residual drying traces on the surface. After exposure to the NaCl, defects in the surface layer were visible but the surface was not significantly damaged.
The SEM image of the PA 0.001 M treated sample reveals cracks in the layer, already before exposure to NaCl. After 10 days of immersion, surface layer was destroyed, which is also in correlation with previously presented results.
Our results show that although there is no significant difference in initial corrosion protection offered by palmitic or stearic acid layer, the former one will be destroyed during several days of exposure to chloride solution while second one will dissolve much slower, thus providing prolonged corrosion protection. FTIR measurements showed that SA was attached to CuNi surface by two oxygen atoms while PA by combination of monodentate and bidentate bonding. This may be one of the reasons why stable corrosion protection was observed only for stearic acid layers. Another possible reason for the observed difference between SA and PA layers could be the difference in the length of the alkyl chain. Many studies have shown that chain length is an important factor in self-assembled monolayer formation11,18,26 because cohesive interactions increase with the chain length increase and the packing becomes denser.6 Solubility in water also decreases with an increase in an alkyl chain length, thus the slightly higher solubility of palmitic acid in water, compared to that of stearic acid, might also lead to easier destruction of the protective layer.
Conclusions
In this work the influence of carboxylic acid chain length and concentration on protective properties of self-assembled layer was studied. Results obtained reveal that a slight difference in a number of methyl groups has an important effect on the protective properties of carboxylic acid layer. While SA layers provided long term protection, that of PA vanished with the time of exposure to corrosive medium.
AFM studies have shown that adsorption of carboxylic acids from the solutions with acid concentration higher than 0.001 M resulted in 3-D structure formation. Although thicker layers exhibited better barrier properties toward oxygen diffusion, the overall protective effect was not particularly improved compared to thin layers formed at 0.001 M fatty acid concentration.
Acknowledgments
The research leading to these results has received funding from Croatian Science Foundation under grant agreement 9.01/253.