Abstract
Carbon capture and valorization is a new route increasingly discussed to reduce greenhouse gas emissions. One of the paths foreseen for CO2 valorization is its transformation into fuels by electrochemical reduction of carbon dioxide. In this approach, molten carbonates are of particular interest since they can be used to capture CO2 molecule because of its high solubility; hence, valorization by electrolysis is possible in molten carbonate media. To better understand CO2 reduction, chronopotentiometric and chronoamperometric techniques were used at gold and graphite electrodes immersed in four alkali carbonate eutectics, Li-Na, Li-K, Li-Na-K and Na-K. The results complemented a previous work based on cyclic voltammetry and confirmed the existence of a main CO2 reduction phenomena around −1.2 V vs Ag/Ag+ that involves two one-electron steps or a two-electron unique step. Transition time analysis showed that the reduction mechanism is either simultaneous reduction of CO2 adsorbed and diffusion species or rapid equilibrium between adsorbed and diffusing species. Furthermore, we identified another electrochemical system involving adsorbed CO2 and CO at higher potentials. In summary, we have succeeded in proving and précising some previous results, as well as identifying reduction mechanisms.
Export citation and abstract BibTeX RIS

This is an open access article distributed under the terms of the Creative Commons Attribution Non-Commercial No Derivatives 4.0 License (CC BY-NC-ND, http://creativecommons.org/licenses/by-nc-nd/4.0/), which permits non-commercial reuse, distribution, and reproduction in any medium, provided the original work is not changed in any way and is properly cited. For permission for commercial reuse, please email: oa@electrochem.org.
Carbon capture and valorization is a way increasingly discussed to reduce greenhouse gases emissions. The regulatory framework emerging for that purpose will bring large amounts of carbon dioxide to the market, with various degrees of purity and concentrations. One of the paths foreseen for CO2 valorization is its transformation into fuels, which are value-added products with already broad market. Reducing carbon dioxide electrochemically is one of the possible ways to produce fuels.1,2 Today, there are already advanced studies regarding high temperature Solid Oxide Electrolysis Cells. Ceramatec, Utah,3 uses co-electrolysis of water and carbon dioxide to produce syngas, which is further converted into fuels via the Fisher-Tropp process. In molten carbonates, Licht et al.4 demonstrated the feasibility of the electrolysis thanks to the so-called STEP process (Solar Thermal Electrochemical Production), although there is no pilot plant yet.
Molten carbonates are of particular interest compared to other electrolytes.5 They are advantageous from technological and economical viewpoints. First, they can be used to capture CO2 molecule thanks to its high solubility rate in molten carbonates and, second, it could be valorized by an electrolysis process.6 Therefore, gaseous effluents from industry could be used without being pretreated to obtain a high degree of purity. Second, increasing the temperature of the melts lowers the electrical power required to perform the electrolysis.7 Since process heat is easily recycled and is cheaper than electricity, this would decrease the electrolysis cost. Consequently, molten carbonate electrolysis cells could be more competitive than other conversion technologies such as hydrogenation and electrochemical reduction in chlorides or ionic liquids.8
Several studies9–12 have been carried out on CO2 reduction but its specific mechanism in molten carbonate is not fully justified yet. It has been suggested that CO2 can be reduced indirectly through the reduction of carbonates and their regeneration by absorption of CO2.13–15 Other authors studied the direct reduction of CO2 into CO via a radical CO2−.16
Peelen et al.17 have studied CO2 reduction in Li2CO3-K2CO3 (62:38 mol%), in the temperature range of 575–800°C via linear sweep voltammetry and chronoamperometry. Their analysis and the calculation from Cottrell equation suggested a one-electron transfer, diffusion-controlled mechanism:
![Equation ([1])](https://content.cld.iop.org/journals/1945-7111/164/8/H5175/revision1/d0001.gif)
![Equation ([2])](https://content.cld.iop.org/journals/1945-7111/164/8/H5175/revision1/d0002.gif)
The overall reaction being:
![Equation ([3])](https://content.cld.iop.org/journals/1945-7111/164/8/H5175/revision1/d0003.gif)
According to a preliminary study by cyclic voltammetry, by our research team,18 two phenomena occurring at −1.2 V vs Ag/Ag+ and at −0.8 V vs Ag/Ag+, respectively, have been identified. In Li-Na carbonate eutectic, two peaks instead of one have been observed below −1 V vs Ag/Ag+ (Figure 1). Analogously, the following two mechanisms were suggested for the overall reduction:18
![Equation ([1])](https://content.cld.iop.org/journals/1945-7111/164/8/H5175/revision1/d0004.gif)
![Equation ([4])](https://content.cld.iop.org/journals/1945-7111/164/8/H5175/revision1/d0005.gif)
![Equation ([5])](https://content.cld.iop.org/journals/1945-7111/164/8/H5175/revision1/d0006.gif)
and:
![Equation ([1])](https://content.cld.iop.org/journals/1945-7111/164/8/H5175/revision1/d0007.gif)
![Equation ([2])](https://content.cld.iop.org/journals/1945-7111/164/8/H5175/revision1/d0008.gif)
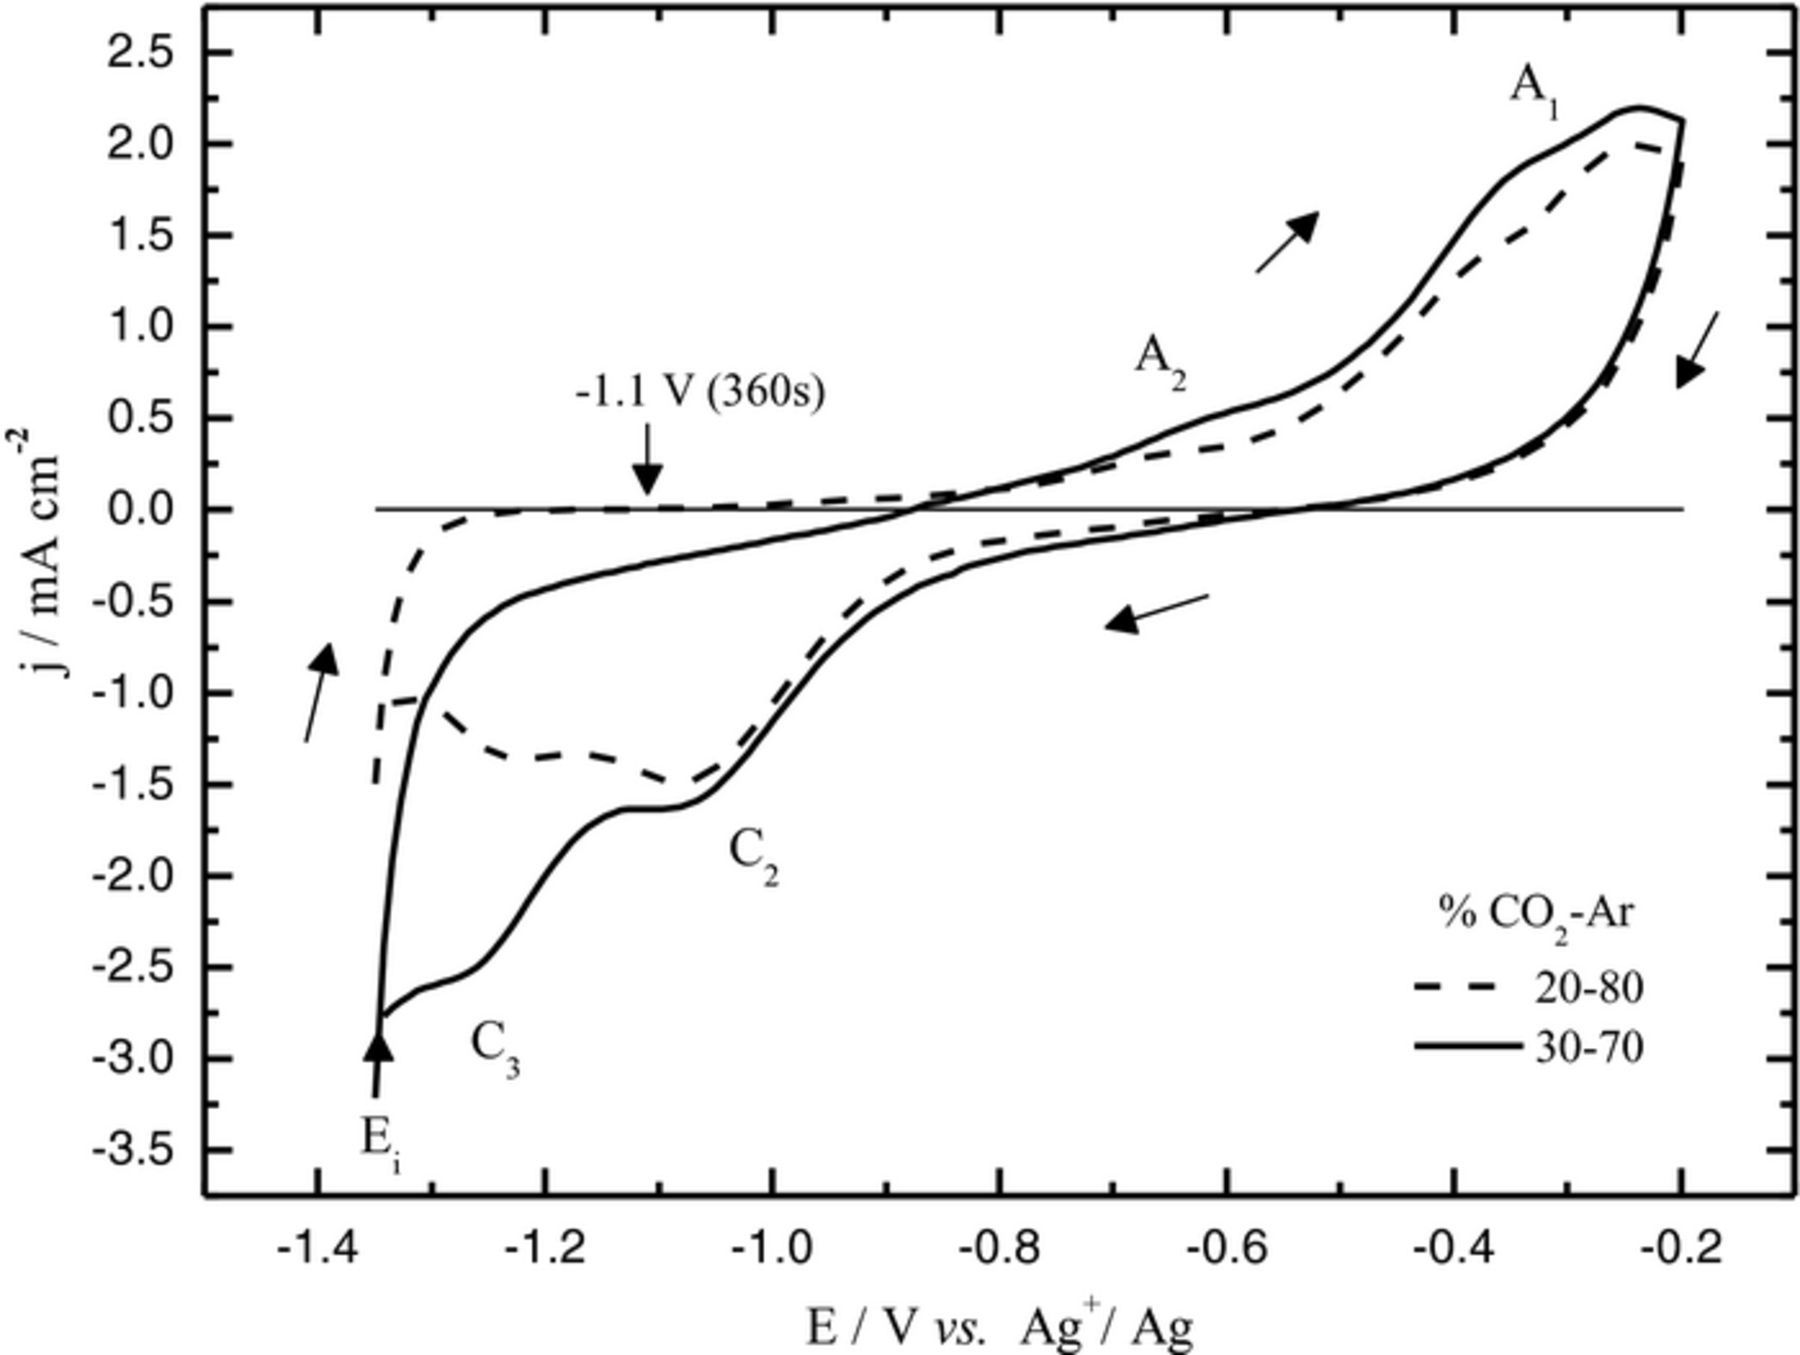
Figure 1. Cyclic voltammograms at a gold electrode in Li-Na carbonate eutectic at 600°C, v = 100 mV/s, after a pre-electrolysis at −1,1 V vs Ag/Ag+ during 360 s; (dashed line)  = 0.2 atm.; (solid line)
  = 0.3 atm.18
The few mechanistic studies on CO2 electroreduction were based on cyclic voltammetry at a gold electrode in the molten carbonate bulk.14,17,18 Knowing that the surface of gold is very sensitive to carbonates and is quite often passivated, it is very difficult to obtain reproducible results;18 thus, it is important to perform other measurements, e.g. by normal and current reversal chronopotentiometry (CRC), enabling the observation of successive potential steps corresponding to mechanistic pathways. Confirming by chroamperometry the nature of the obtained currents (diffusion-limited, adsorption, ...) is also useful to define/confirm the whole mechanistic route. All the common alkali carbonate eutectic mixtures were analyzed mainly by chronopotentiometry and, in some cases, by CRC or chronoamperometry. The influence of CO2 pressures and temperatures were investigated in Li2CO3-Na2CO3 (52:48 mol%), Li2CO3-K2CO3 (62:38 mol%) and Li2CO3-Na2CO3-K2CO3 (43.5:31.5:25.0 mol%), using gold and graphite electrode materials.
Experimental
Electrochemical measurements were realized in custom-made half-cells described in previous publication.19 The high-temperature electrochemical half-cell was a single-compartment crucible with dimensions of 70 × 50 mm2 contained in an alumina Al2O3 reactor with dimensions of 250 × 60 mm2 hermetically sealed by a stainless steel cover with a Viton O-ring. Temperature was controlled at a constant value of 650° by means of a calibrated chromel/alumel thermocouple. Working electrodes were alternatively gold and graphite plates of 1 × 1 cm2, attached to a gold wire. Before each measurement, golden electrodes were polished on SiC grinding paper, grain size P2400 and P4000, at 250 rpm; followed by immersion in an ultrasonic bath (50:50 vol%, ethanol:water) for ten minutes. The atmosphere was composed of a mixture of CO2 and Ar of high grade purity (e.g., 99.98%). The total pressure over the melt was 1 atm. Chronopotentiometric measurements in alkali molten carbonate eutectics (all reactants from Sigma-Aldrich of analytical grade 99.9%) were taken at constant current for 30 s and then the electrode was left at rest potential for 20 min for equilibration. Current was increased in steps of 0.5 or 1 mA and chronopotentiometry was measured again. This procedure was performed on the same electrode for a range of current at given temperature and partial pressure conditions. Table I summarizes the studied atmospheres and temperatures for each eutectic. Reversed chronoamperograms at Au electrodes in Li-K at 650°C, with  of 0.05, 0.1, 0.2 and 0.3 atm, were also conducted. Chronoamperometry was also used in Li-K eutectic on a gold electrode at 650°C at potentials of −0.9 and −1.2 V vs Ag/Ag+ and
  of 0.05 and 0.1 atm. respectively.
Table I. Experimental conditions of chronopotentiometry.
| Temperature | Partial pressure | Electrode | |
|---|---|---|---|
| Eutectic | (°C) | CO2 (atm.) | material |
| Na2CO3-K2CO3 56:44 mol% | 750 | 0.5 | Au |
| Li2CO3-Na2CO3 42:58 mol% | 600 | 0.5 | Au |
| 650 | |||
| 700 | |||
| Li2CO3-K2CO3 62:38 mol% | 650 | 1.0 | Au, C |
| 0.5 | |||
| 0.2 | |||
| 0.05 | |||
| Li2CO3-Na2CO3-K2CO3 | 550 | 0.5 | Au |
| (43.5:31.5:25.0 mol%) | 600 | 0.5 | |
| 1.0 |
Results and Discussion
General features of chronopotentiograms
Chronopotentiograms corresponding to CO2 reduction in four alkali carbonate eutectics, Li-Na (52:48 mol%), Li-K (62:38 mol%), Li-Na-K (43.5:31.5:25.0 mol%) and Na-K (58:42 mol%) are depicted in Figs. 2a–2d. Even though these curves can roughly be seen as similar, they differ by the potentials of the plateaus and by their shape. In all cases, as expected, the transition time, τ (time at which the concentration of the active reactant at the interface is consumed20), tends to decrease with the absolute value of the imposed current (higher currents consuming more rapidly the electroactive species). Another general feature is that quarter time potentials, Eτ/4 (related to the time elapsed since the application of current is equal to one-fourth of the transition time21–23), in most of the cases (Figs. 2a, 2c, 2d) become slightly more negative as the absolute value of the current increases, which indicates that the corresponding electrochemical reaction is not fully reversible.22 This phenomenon is quite clear in the case of Li-Na-K at 600°C (Fig. 2c), but less pronounced at higher temperatures, 650°C in Li-Na (Fig. 2a) and 750°C in Na-K (Fig. 2d). In Li-Na (Fig. 2a), a first plateau is observed at around −1.1 to −1.2 V vs Ag/Ag+, corresponding to the main reduction peak of CO2 observed at the same potential by cyclic voltammetry (CV) and that has been attributed to the reduction of soluble CO2 into soluble CO.18 Another plateau at around −1.4 V vs Ag/Ag+ is due to the reduction of carbonates from the electrolyte. A similar CO2 reduction plateau (II) is observed in Li-Na-K (Fig. 2c) but at slightly lower potentials, which is in accordance with a slower electrochemical reaction (Eτ/4 potentials are more affected at higher currents). The second plateau due to the reduction of carbonates, occurring at potentials values more negative than −1.6 V vs Ag/Ag+, shows again that systems are less reversible in Li-Na-K (600°C) (Fig. 2c) than in Li-Na (650°C) (Fig. 2a), which is mainly an effect of temperature. However, when zooming into lower currents of Li-Na-K chronopotentiograms, we find small plateaus at around −0.75 V vs Ag/Ag+, which are related to the CV peak observed at nearly the same potential in in previous work.18 Li-K (Fig. 2b), under a lower partial pressure of CO2 ( of 0.05 atm. instead of 0.5 atm.) shows clearly the same plateau, with a sharp shape which is probably due to adsorbed CO2 reduction (Eτ/4 with a constant value); another plateau follows at less than −1.2 V vs Ag/Ag+ corresponding to the main CO2 reduction peak observed by CV in previous work.18 The same tendency is observed for Na-K (Fig. 2d) at higher temperature but with a slight slope for the first plateau. The plateau beginning at −0.8 V vs Ag/Ag+ could be due to the reduction of pre-adsorbed CO2, but without strong evidence. In the case of Li-Na carbonate eutectic at 700°C, at very low imposed currents, as shown in Fig. 3, chropotentiograms display a new reduction plateau at around −0.35 V vs Ag/Ag+, which was hypothetically attributed in a previous paper18 to the reduction of CO2ads into COads; in effect, by CV in Na-K at 750°C, a reduction peak clearly appeared at a similar potential, associated to the reversible COads oxidation peak. The influence of temperature is evident when comparing Fig. 2a and Fig. 3, the plateau appearing at −1.2 V vs Ag/Ag+ in Fig. 2a appears only from −6.0 to −7.0 mA in the form of a poorly defined transition, which means that CO2 at the electrode is depleted faster at 700°C than at 650°C. Moreover, an equally poorly defined transition appears between −4.5 and −5.5 mA and also disappears rapidly at more negative currents. Finally, in Li-K at 650°C at a graphite electrode (Fig. 4), two reduction plateaus can be observed: one at around −0.95 V vs Ag/Ag+ and the other at around −1.2 V vs Ag/Ag+ stable in the practical conditions used since the reduction of carbonates under these conditions is not observed until a potential between −1.6 and −2.0 V vs Ag/Ag+ 2. These two plateaus probably correspond to Reactions 1 (around −0.95 V vs Ag/Ag+) and 4 (around −1.2 V vs Ag/Ag+), with two steps of one electron followed by the neutralization of CO2 −2.
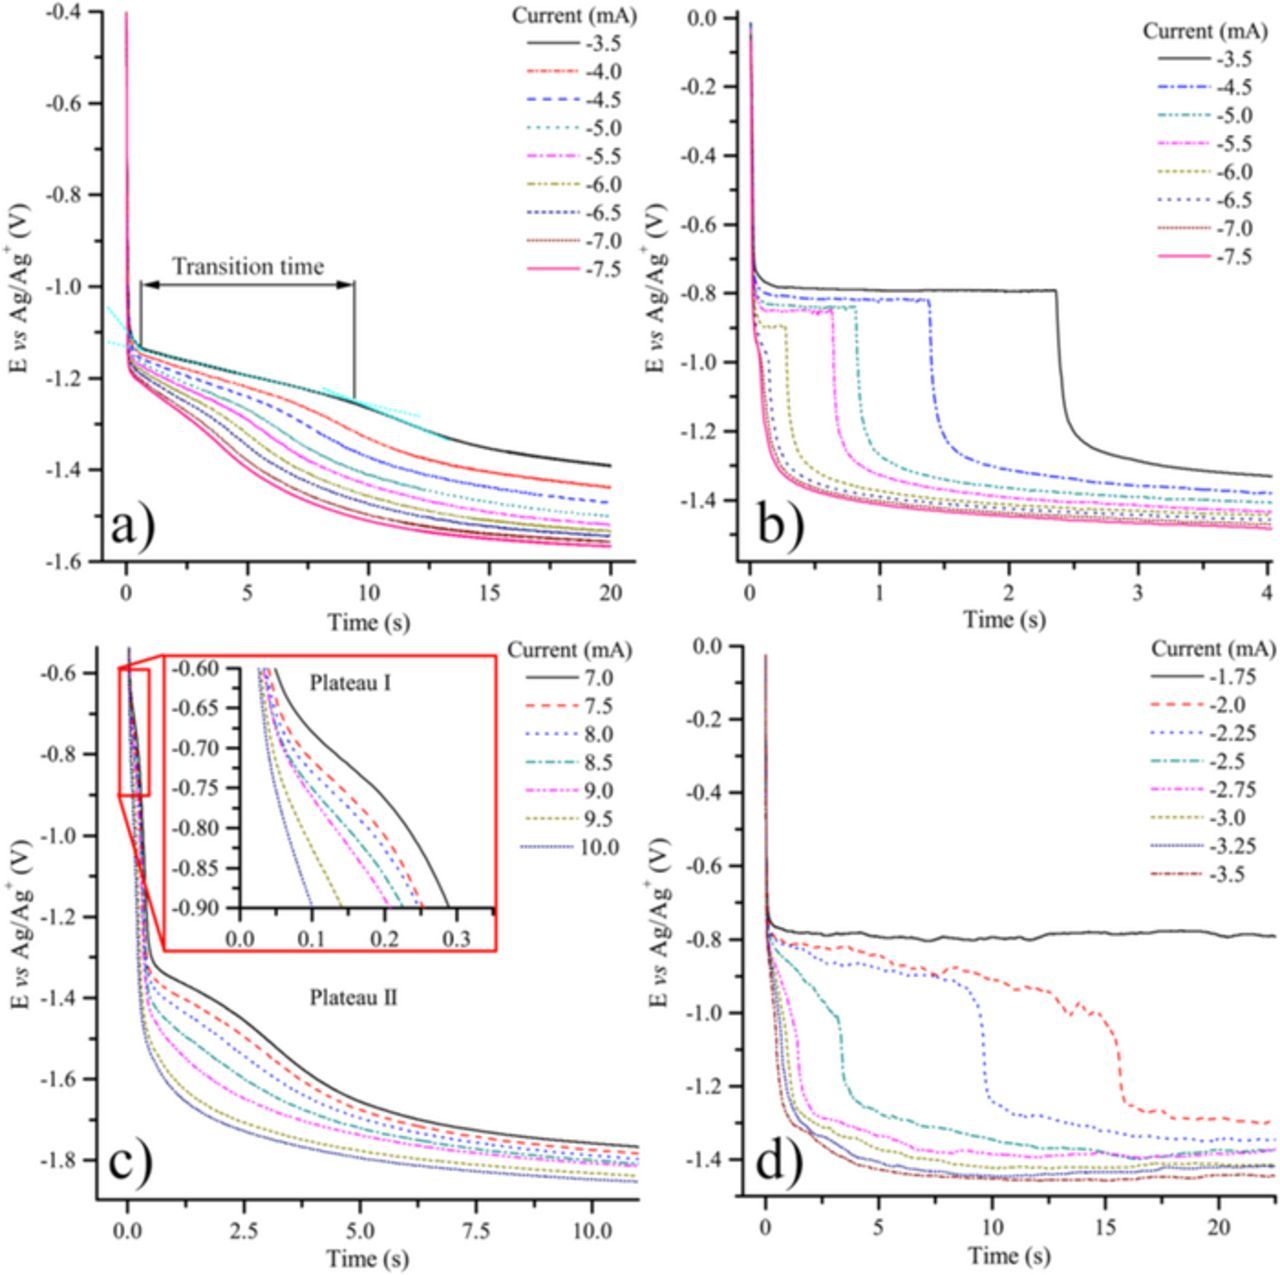
Figure 2. Chronopotentiometry at a gold electrode in different carbonate eutectics: a) Li-Na at 650°C and  0.5 atm.; b) Li-K at 650°C and
  0.05 atm.; c) Li-Na-K 600°C and
  0.5 atm. and d) Na-K at 750°C and
  0.5 atm.
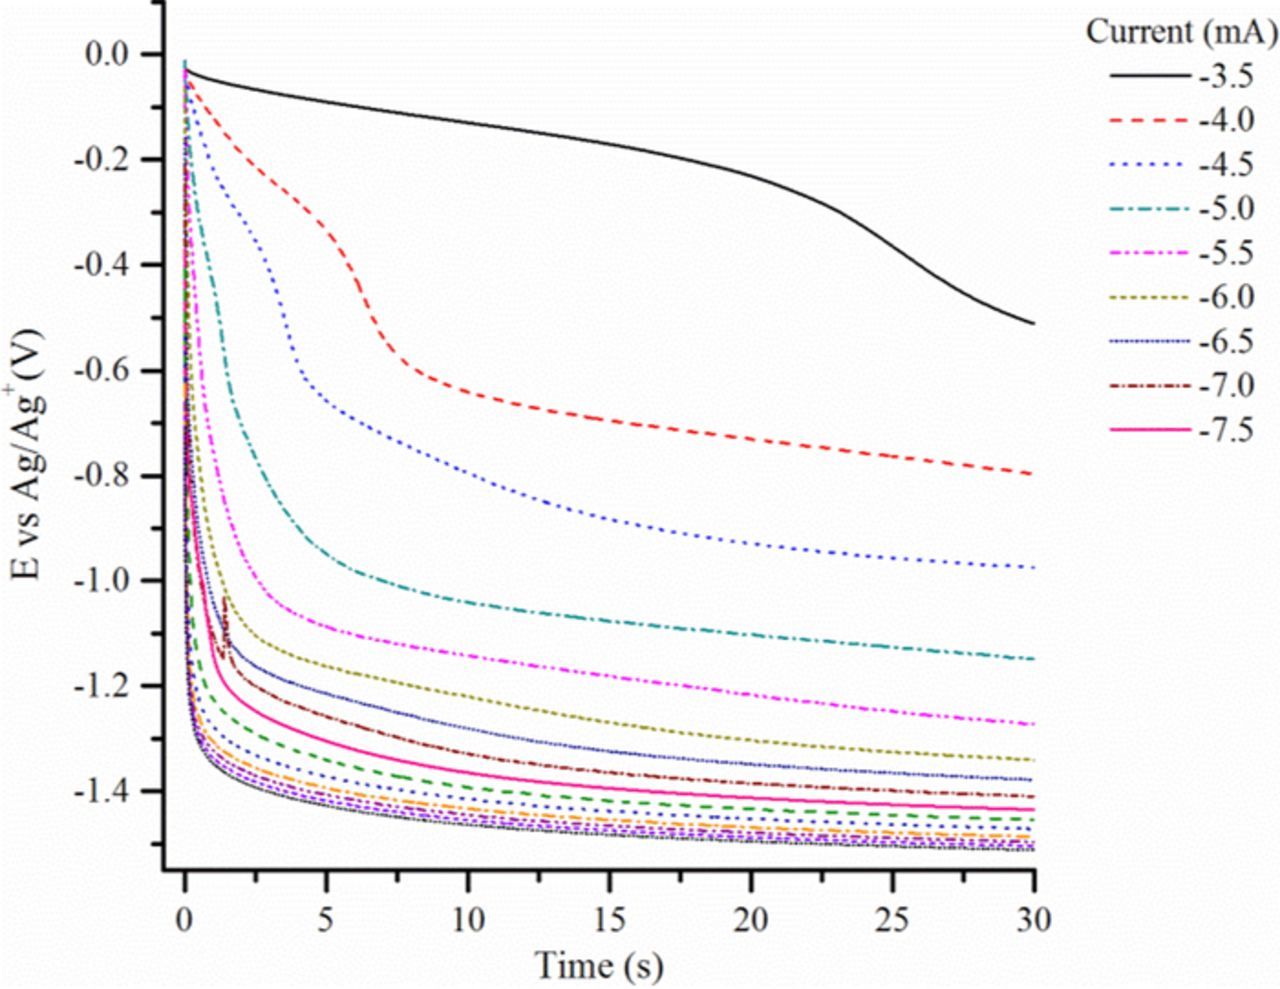
Figure 3. Chronopotentiometry at a gold electrode immersed in Li-Na eutectic at 700°C and  0.5 atm.
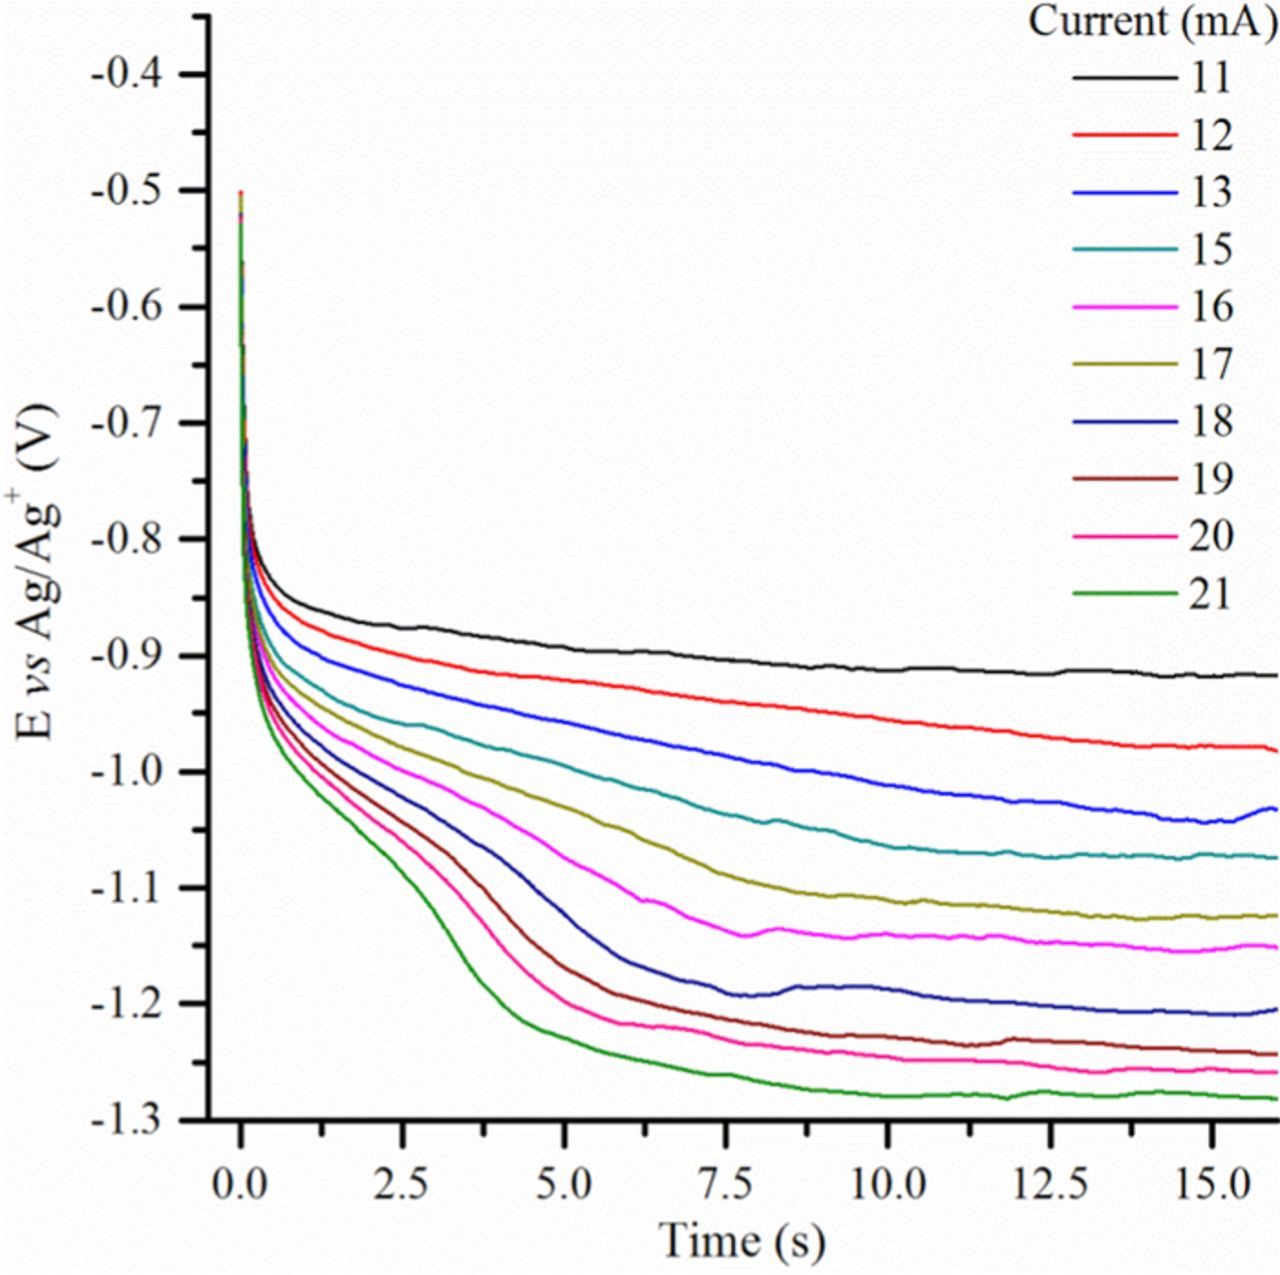
Figure 4. Chronopotentiometry at a graphite electrode immersed in Li-K eutectic at 650°C and  0.5 atm.
Fig. 5 shows the transition time dependence on applied current as a function of temperature, oxoacidity of the carbonate melt ( ), nature of the electrolyte and working electrode; the legends PI and PII correspond to the so called Plateau I and Plateau II that are not always present under the different conditions tested herein. As already mentioned, the quarter potential Eτ/4 tends to decrease with the increase in the transition time (related to the decrease of the absolute value of current), which indicates that the electrochemical systems involved are quasi reversible, as analyzed before by CV.18 Fig. 5a (Li-Na with
  = 0.5 atm. at a gold electrode) shows the evolution of Eτ/4 with temperature, and is related to different reduction processes, as mentioned before; around −0.1 V vs. Ag/Ag+ (plateaus I) and around −1.2 to −1.4 V vs. Ag/Ag+ (plateaus II). For plateau II (Fig. 5a), when increasing the temperature from 600 to 650°C, the transition time becomes larger, which is consistent with the fact that both the solubility and the diffusion coefficient of CO2 increase with the temperature. Another observation is that the potentials (Eτ/4) are more negative at lower temperature (Figs. 2c and 5a, 5c), which seems to be related to a slightly slower kinetics. For plateaus I (Fig. 5a), the behavior is quite different at the two studied temperatures, with a constant transition time at 600°C, showing probably an adsorption phenomenon that is not present at 700°C. Thus, it is more difficult to conclude about plateau I (Fig. 5a), but as we mentioned it could be related to adsorbed species (CO2ads reduced into COads).18 Fig. 5b shows the influence of
  on the transition times in Li-Na at 650°C. The four series displayed can be divided in two groups; in the first one, the quarter potentials belonging to plateau I (PI) are between −0.75 and −0.85 V vs Ag/Ag+ and, in the second, the potentials of plateau II (PII) varying between −1.0 and −1.2 V vs Ag/Ag+. Transition times tends to increase with the partial pressure of carbon dioxide in the case of plateau II which represents the reduction of soluble CO2 into soluble CO; this is in agreement with the fact that increasing the amount of CO2 requires higher currents for being entirely consumed. Situation is more complex in the case of plateau I and we can just note that the transition times are larger at CO2 0.1 atm. than at 1 atm., which is difficult to explain. Evolution of the quarter time potentials is in favor of a quasi reversible system. In the case of a graphite electrode in Li-K eutectic at
  = 0.05 atm. (Fig. 5c), the influence of temperature for plateau II (Eτ/4 at around −1 V vs Ag/Ag+) is similar than in Fig. 5a: with potentials lower at 600°C and systems that are quasi reversible.
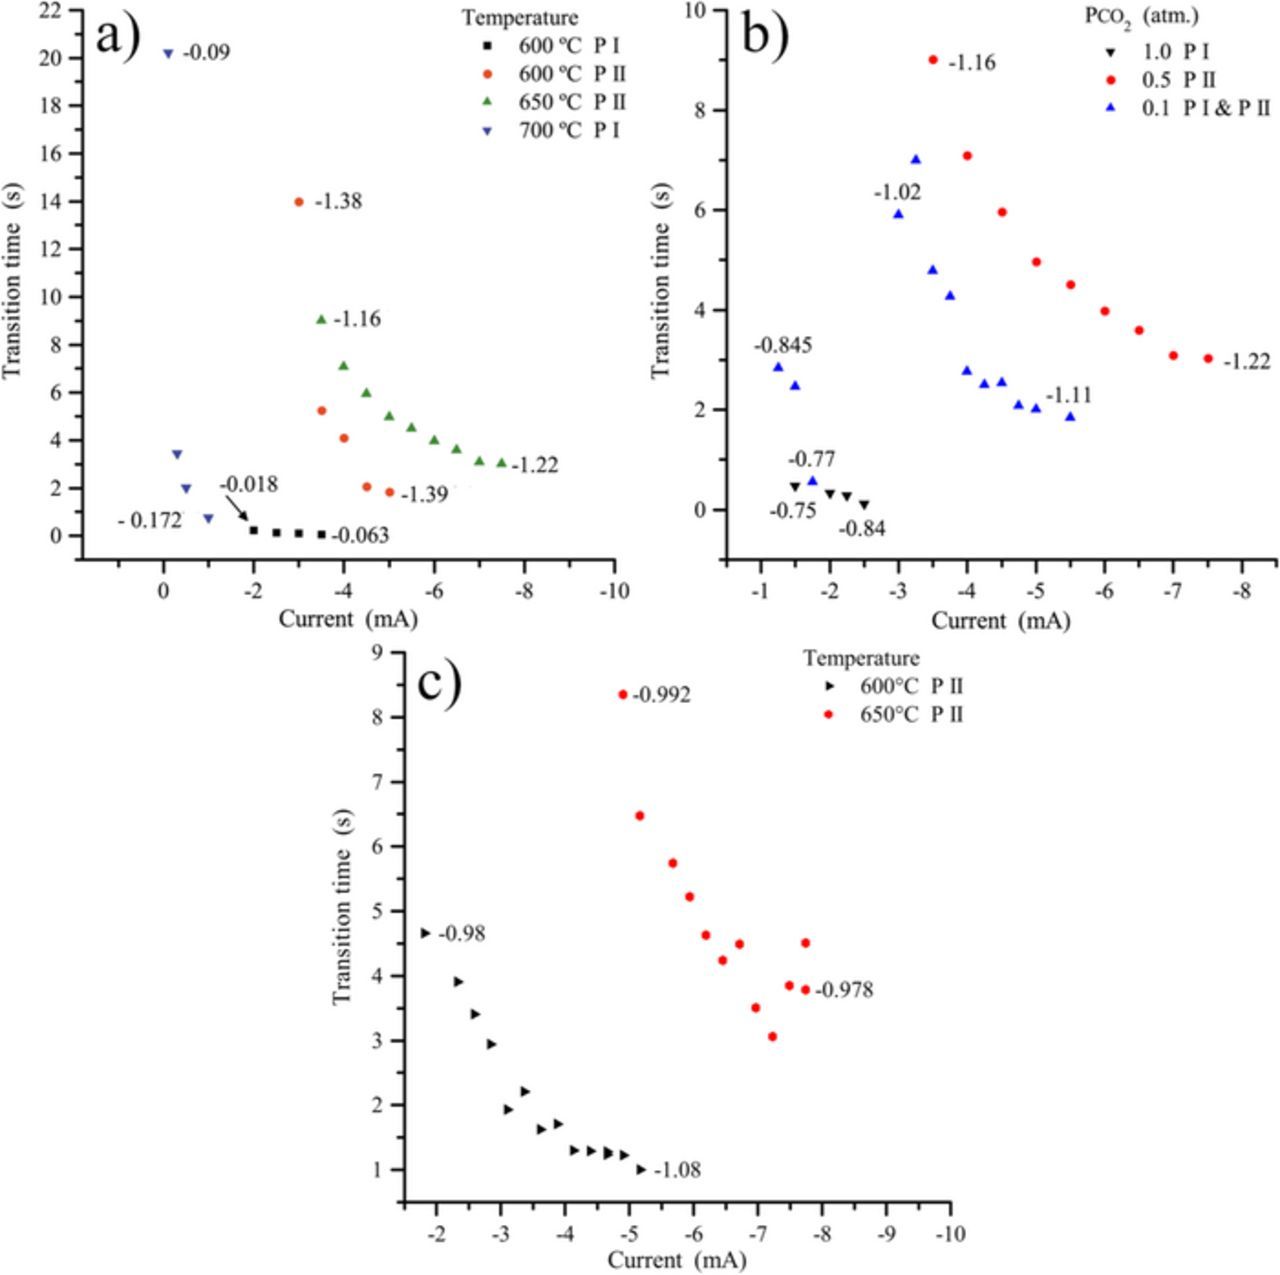
Figure 5. Transition time dependence on applied current in different conditions: a) gold electrode in Li-Na at  = 0.5 atm. and different temperatures; b) gold electrode in Li-Na eutectic at 650°C and different
  , and c) graphite electrode in Li-K eutectic at
  = 0.05 atm. and different temperatures. The numbers beside the points indicate the value of Eτ/4 (quarter potential) in V vs Ag/Ag+.
Current reversal chronopotentiometry
Current reversal chronopotentiometry (CRC) tests were carried out for exploring the reversibility and the characteristics of the reduction product. CRC graphs at a gold electrode in Li-K eutectic at 650°C,  = 0.1 atm., displayed in Fig. 6a, show that two plateaus are successively observed in reduction (P I and P II), as well as in re-oxidation (P III and P IV). However, when a reversal current is applied immediately after P I (Figure not shown), no reverse plateau is observed and P I appears to correspond to an irreversible reaction. Since the potential continues to decrease after P II (Fig. 6a), it is possible that P III (Fig. 6a inset) corresponds to the re-oxidation of the last product generated between 0.5 and 1 s and P IV to the re-oxidation of product P II; thus, it seems that P III and P IV are both linked to P II. The observation of two reverse plateaus when P II is re-oxidized may correspond to a quasi reversible two-step oxidation reaction, or to the oxidation of soluble CO and adsorbed CO as proposed by Chery et al.18 Another CRC at a gold electrode in Li-Na at 650°C,
  = 0.1 atm., shown in Fig. 6b, displays a well-defined plateau in reduction, corresponding to the potential of P II, and another one in oxidation P IV. The transition times ratio is
  : the reduction product is soluble.
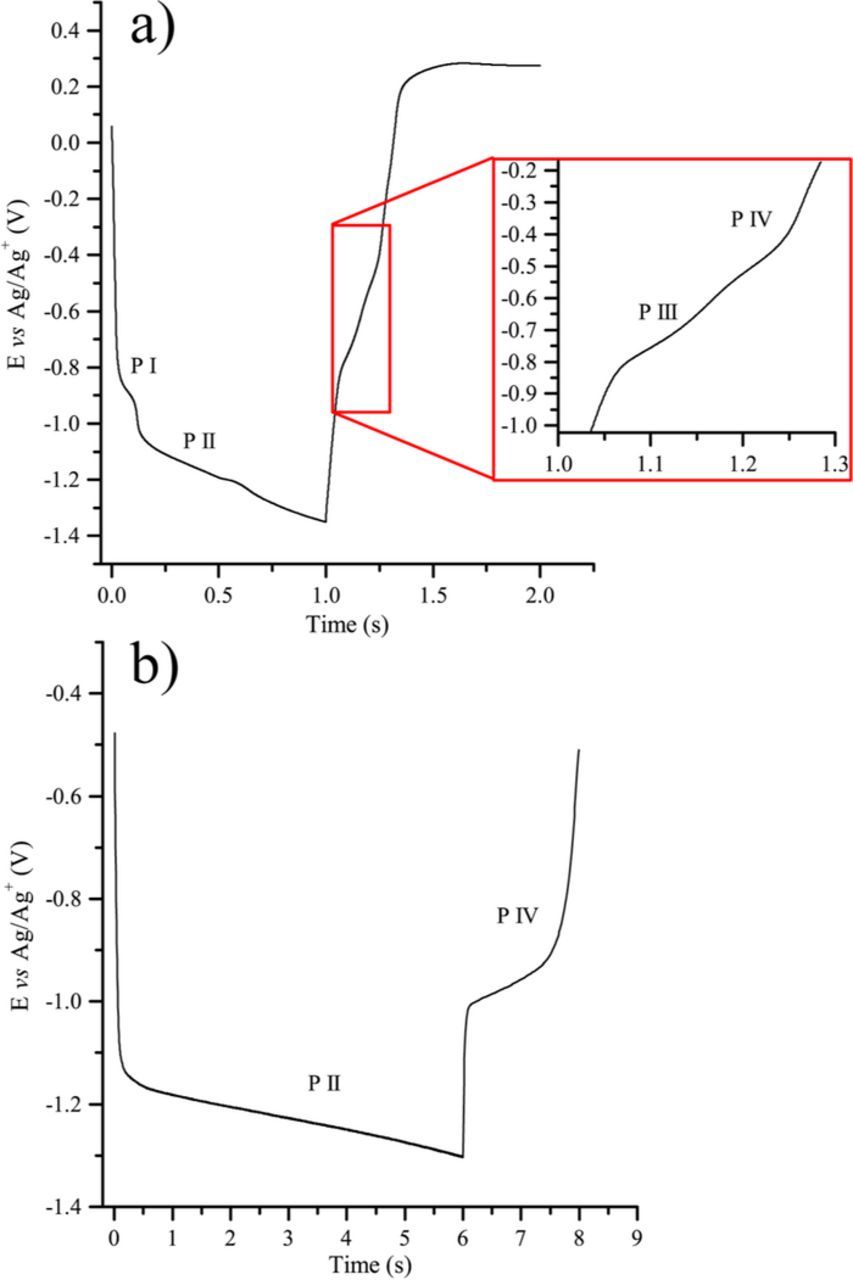
Figure 6. Current reversal chronopotentiometry performed at a gold electrode: a) Li-K eutectic at 650°C,  = 0.1 atm., initial current of −8 mA during 1 s, then 8 mA during 1 s; b) in Li-Na eutectic at 650°C,
  = 0.5 atm; initial current of −10 mA during 6 s, then 10 mA during 2 s.
Transition time analysis
Transition time τ, for a reversible electron transfer, is linked to the current by Sand's law:20
![Equation ([6])](https://content.cld.iop.org/journals/1945-7111/164/8/H5175/revision1/d0009.gif)
If the reaction presents adsorption steps involving more than one electrochemical species, τ expression will extend beyond Sand's law relation. To take into account adsorption phenomena, the relations listed in Table II could be considered for elucidating the predominant reaction mechanism and the number of electrons n transferred in each step. It should be outlined that to determine n, accurate values of COD1/2O are required as well as careful measurements. For the analysis of τ we have considered the chronopotentiograms taken at a graphite electrode immersed in Li-K eutectic at 650°C and  of 1, 0.5 and 0.2; (e.g. Fig. 2b) as well as those taken at a gold electrode immersed in Li-Na-K electrolyte at
  of 0.5 atm. at 550 and 600°C (e.g. Fig. 2c). These data were the most reliable chronopotentiometric measurements among the experiments performed, in the sense that τ shows a clear linearity with one or more of the proposed models. Each series of plateaus were analyzed for each of the four proposed mechanisms by plotting different combinations of the data as shown in Table II. If any of the plots results in a straight line, the mechanism represented by that plot is dominant (e.g. Fig. 7). From the linear regression with the best linearity, we can deduce the possible predominant mechanism and from the slope the value of n. In the case of Li-K at 650°C, we took the value of
  from Meléndez-Ceballos et al.24 (1.1 × 10⁻⁶ cm2·s−1) and the concentration C0O was calculated from the solubility obtained in previous research3: 13.5 mol L−1 atm−1. We also used other values of diffusivity and solubility given by Nishina et al.,26 but the results were impossible to interpret, proving the necessity of counting on new sets of experimental data. In the case of Li-Na-K eutectic, as we did not have values from our own, the values of
  and C0O for each temperature were calculated directly from Nishina et al.26 Table III summarizes the results of the linear regression for the four mechanisms described and the number of electrons n obtained. Based on the linearity of the linear regressions, Li-K seems to change from the mechanism of simultaneous reduction of the species (SR) to the rapid equilibrium mechanism (FE) when decreasing
  . The value of n was found to be 1 electron for high concentrations and around 2 for lower
  . However, at very low concentration, the linearity is not so good and the error in n increases. For Li-Na-K at 550°C SR is the dominant mechanism with a number of electrons close to 2 for both reactions. When increasing the temperature and
  , the phenomena seems to be mixed between the SR and FE mechanisms, and the computed n decreases.
Table II. τ relations for electrochemical reactions including one adsorption step.
| Mechanism | Potting | Equation | |
|---|---|---|---|
| SR | Simultaneous reduction of diffusing electroactive species | iτ vs τ1/2 |  |
| in solution and of adsorbed electroactive species | |||
| RA-RD | Reduction of adsorbed species | iτ vs 1/i |  |
| previously to diffusing species | |||
| RD-RA | Reduction of diffusing species | (iτ)1/2 vs 1/i1/2 |  |
| previously to adsorbed species | |||
| FE | Equilibrium mechanism (rapid equilibrium between adsorbed and diffusing species) | Cτ1/2 vs C2/i |  |
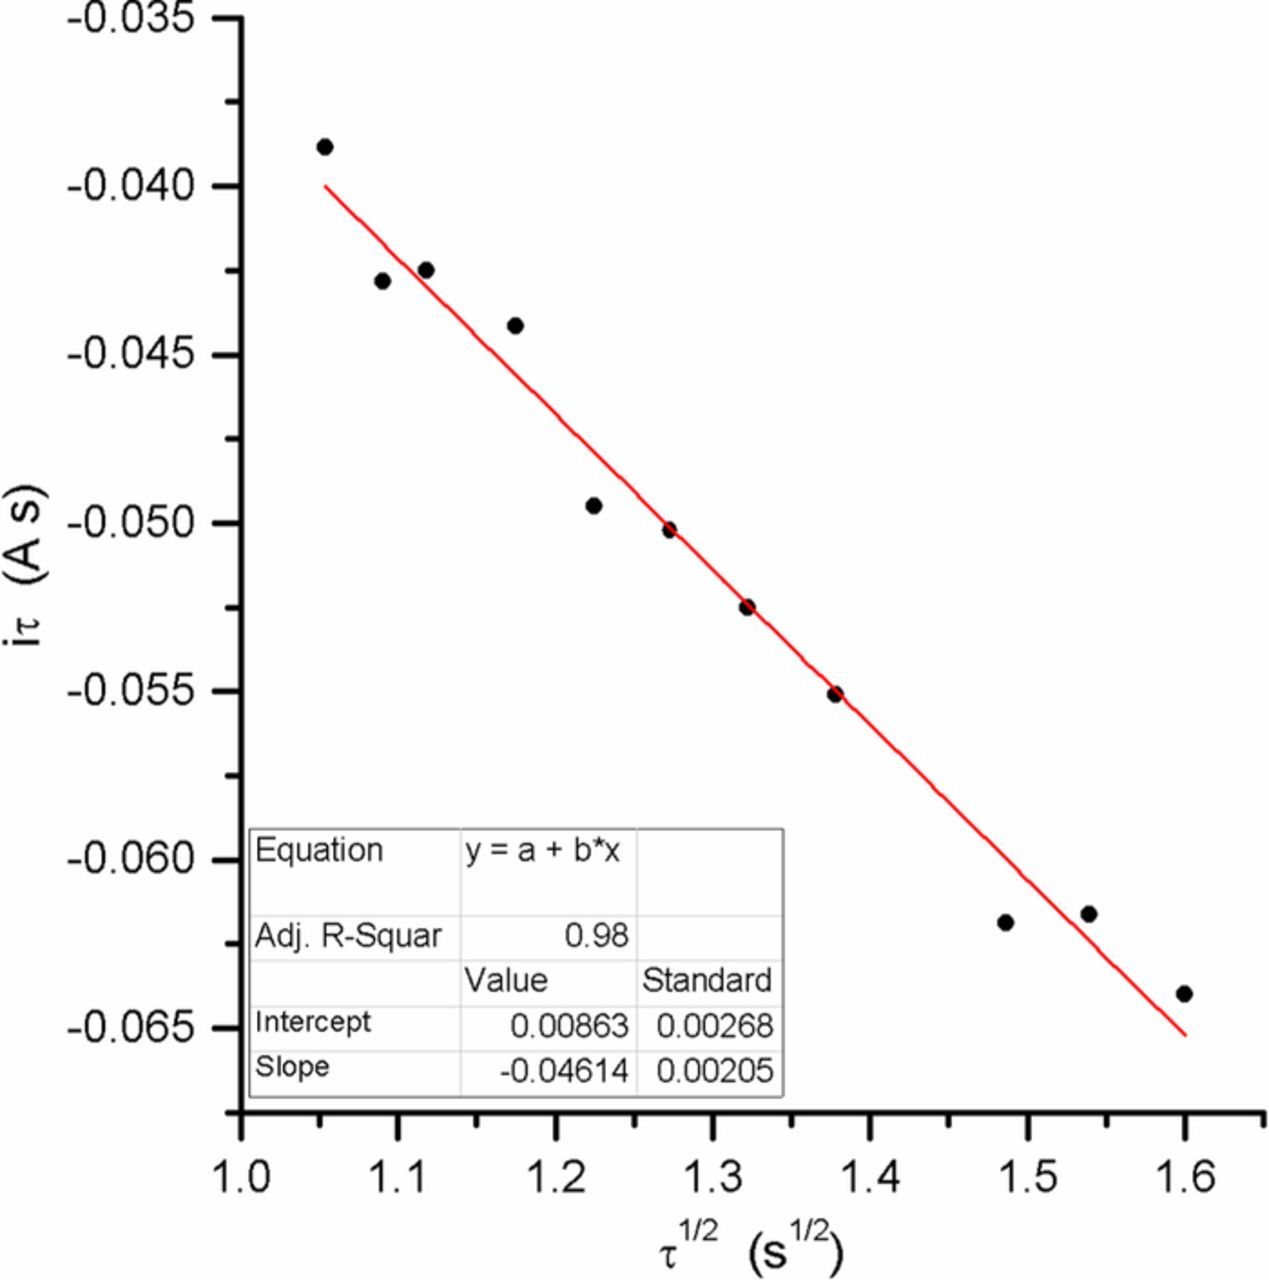
Figure 7. Example of iτ vs. τ1/2 plot and linear regression for the SR mechanism (τ data obtained from chronopotentiometric measurements performed on a graphite electrode for Li-K eutectic at 650°C and  = 1 atm.)
Table III. Transition time analysis of the four cases proposed in Table II.
| Li-K 650°C |  |
||||||
|---|---|---|---|---|---|---|---|
| 1 atm. | 0.5 atm. | 0.2 atm. | |||||
| Mechanism | R2 | n | R2 | n | R2 | n | |
| SR | 0.98 | 1.0 | 0.93 | 1.3 | 0.89 | 4.0 | |
| RA-RD | 0.89 | 2.5 | 0.79 | 3.5 | 0.84 | 7.6 | |
| RD-RA | 0.89 | 0.5 | 0.79 | 0.5 | 0.83 | 1.0 | |
| FE | 0.96 | 1.8 | 0.95 | 2.5 | 0.97 | 5.6 | |
| Li-Na-K 550°C | 0.5 atm. | ||||||
| Plateau I | Plateau II | ||||||
| Mechanism | R2 | n | R2 | n | |||
| SR | 0.99 | 1.5 | 0.98 | 2.0 | |||
| RA-RD | 0.94 | 4.3 | 0.69 | 5.0 | |||
| RD-RA | 0.91 | 4.7 | 0.69 | 4.5 | |||
| FE | 0.96 | 3.3 | 0.87 | 3.6 | |||
| Li-Na-K 600°C | 1 atm. | ||||||
| Plateau I | Plateau II | ||||||
| Mechanism | R2 | n | R2 | n | |||
| SR | 0.97 | 1.0 | 0.93 | 1.8 | |||
| RA-RD | 0.82 | 2.5 | 0.82 | 5.0 | |||
| RD-RA | 0.83 | 1.7 | 0.79 | 2.7 | |||
| FE | 0.96 | 1.7 | 0.96 | 3.6 | |||
Chronoamperometry
In order to confirm our hypotheses on CO2 reduction mechanisms, we performed chronoamperometric measurements. Two kind of curves were obtained with specific shapes according to the imposed potential. In the first one, displayed in Fig. 8a, we can observe at around −0.9 V vs Ag/Ag+ a distortion of the iτ plot with respect to a Cottrell behavior, which most probably indicates an adsorption step and is in agreement with the results obtained by chronopotentiometry. For the second one at around −1.2 V vs Ag/Ag+ (Fig. 8b), current decreases abruptly and then slightly until reaching the residual current. Cottrell plots (j vs 1/t1/2) did not give strictly a straight line, which is supposed to be the case for a diffusion-controlled reaction. However, many parameters may influence the recording of the current (e.g. possible agitation by convection, electrode vibration due to convection, non-ideal stationary system), so that the hypothesis of a diffusion-controlled mechanism should not be discarded. Therefore, according to chronoamperometry, we conclude that CO2 undergoes two reduction mechanisms. The first one at the higher potential is irreversible, as no reverse plateau (chronopotentiometry) or peak (by CV17) were observed, and is not diffusion-controlled. As this system is not always clearly observed, it might be due to the reduction of adsorbed CO2, in specific adsorption sites, into CO−2, which is unstable and, therefore, its oxidation cannot be observed. For the second at the lower potential, the reaction is quasi-reversible. Our work does not contradict previous hypothesis of a reaction involving two diffusing species, with a soluble product. This reaction corresponds, as also seen by chronopotentiometry and CV,18 to the reduction of soluble CO2 into CO, but with different complex steps including adsorption phenomena.
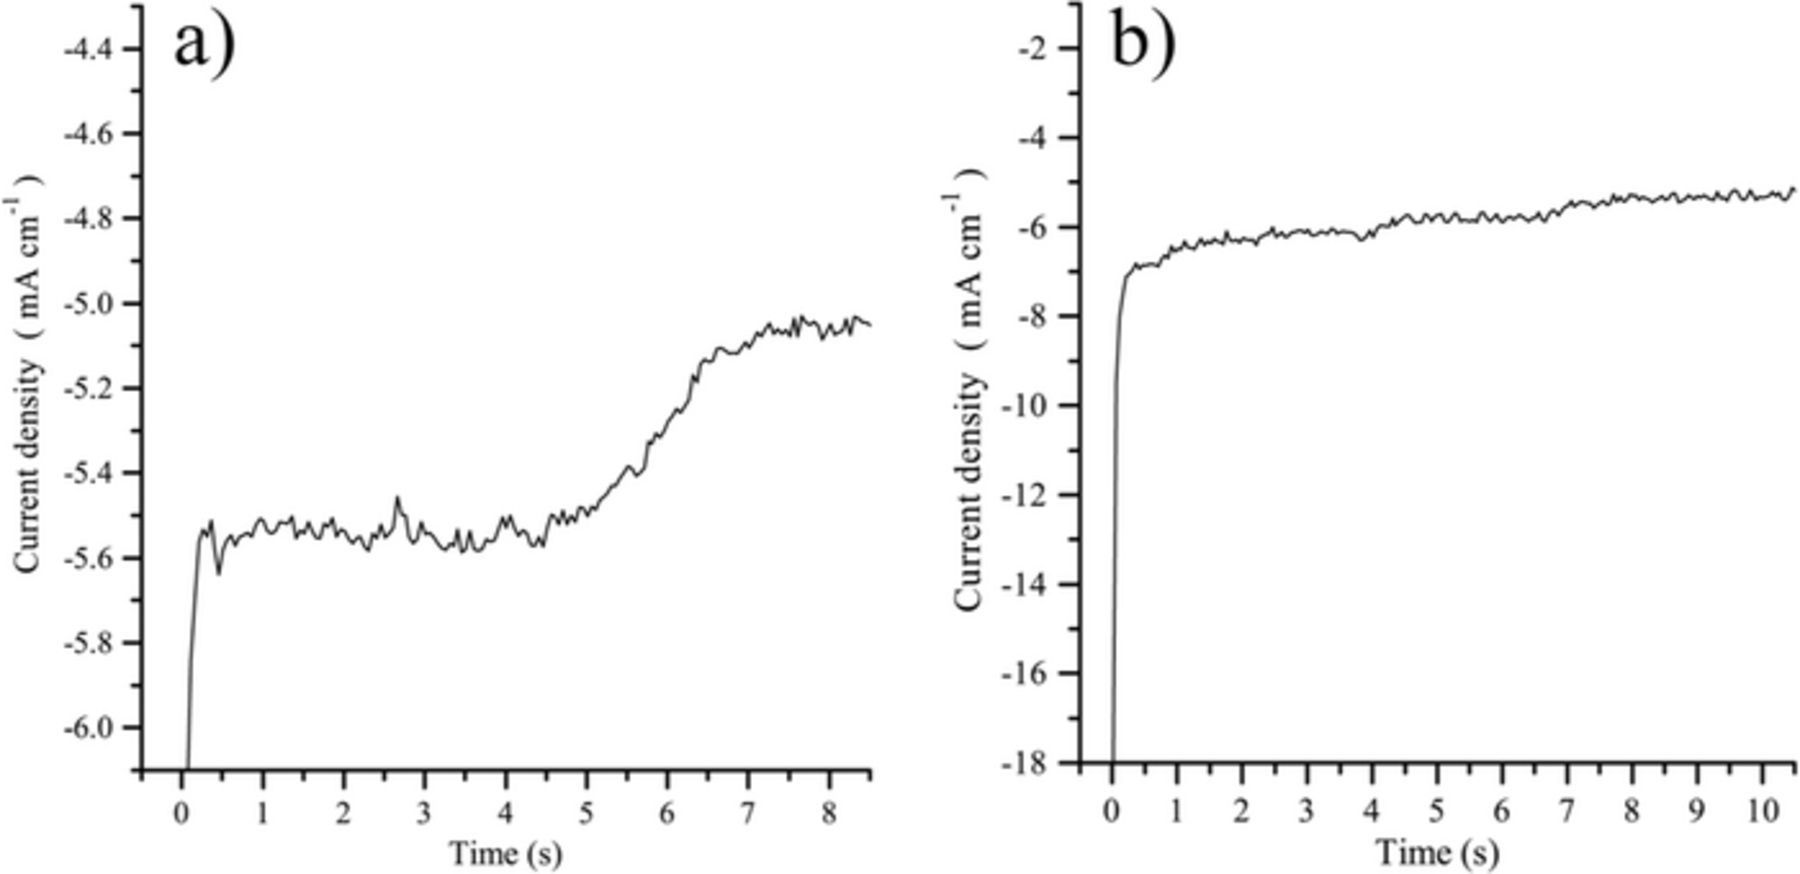
Figure 8. Chronoamperometry performed at a gold electrode in Li-K eutectic at 650°C; a)  = 0.05 atm., E = −0.9 V vs Ag/Ag+; b)
  = 0.1 atm., E = −1.2 V vs Ag/Ag+.
Conclusions
Reduction of CO2 in molten carbonates at gold or graphite electrodes is complex and depends on many factors. As the hypotheses proposed from cyclic voltammetry data were far for being fully proven, the challenge of the present work was quite important and delicate: using complementary electrochemical tools, such as chronopotentiometry, reversal current chronopotentiometry and chronoamperometry, delicate, not only to confirm but to get a new insight on the mechanisms. According to the experimental conditions, which means nature of electrodes, temperature, partial pressure of CO2 and electrochemical parameters (potentials or currents imposed, procedure, etc.), significant results were obtained, showing in synthesis the following facts:
- (a)There is a main CO2 reduction phenomenon yielding the formation of CO (Reaction 5) at roughly −1.2 V vs Ag/Ag+ (value that also depends on the temperature, nature of the eutectic, etc.). This transformation, involving soluble species and most probably adsorbed and instable intermediates, occurs in two one-electron steps or in two-electron unique step. The most probable intermediate species are CO−2 (in all cases one or two steps) and CO2 −2, only observed in a second reduction step when sufficiently stable. At high and intermediate
 , a one-electron step is surely the unique step and we only identified a two-electron steps at low under specific conditions (e.g. gold electrode in Li-K eutectic at 650°C, = 0.1 atm.), meaning that CO2 −2 is in general too instable to provoke its own reduction step. The number of electrons according to the most reliable results obtained by transition time analysis seems to evolve from a one-electron to a two-electron step from high to low values of , and in the same way from the mechanism of simultaneous reduction of the species (SR) to the rapid equilibrium mechanism between adsorbed and diffusing species (FE). It should be added that measurements at high were easier to interpret. The re-oxidation phenomenon due to soluble CO and identified by reversal current chronopotentiometry is less easy to be observed due to the low solubility of CO in molten carbonates.24
 - (b)A pre-reduction phenomenon also occurs at roughly in some specific conditions (e.g. gold electrode in Li-Na-K at 600°C and 0.5 atm.) and appears to be due to adsorbed CO2 species on specific adsorption sites of the working electrode. This phenomenon is found around −0.8 V vs Ag/Ag+, and produces very low intensity peaks by cyclic voltammetry.18
- (c)Finally, CO2 can be reduced to CO at around −0.35 V vs Ag/Ag+ with both species in an adsorbed form. CO oxidation was identified by reversal current chronopotentiometry. A full analysis of this system is impossible at this stage.


For concluding, we have succeed in proving some previous results and identifying some mechanistic approaches, defining whether the systems are diffusion-controlled or not, soluble or insoluble, in one or two steps and according to what kind of mechanism with a mixed diffusion-adsorption phenomenon. Anyhow, at high  , the mechanism of simultaneous reduction of the species (SR) was found to be dominant. To complete our understanding, fine in situ analyses of the electrode surfaces would be necessary but delicate to realize.
Acknowledgments
This work was supported by the French program PLANEX ANR-11-EQPX-0-01 and benefited of a Mexican CONACYT Ph.D. scholarship 314518.