Abstract
Bimetallic alloys based on Pt and Y are potential cathode catalysts for proton exchange membrane fuel cells (PEMFCs) due to their high oxygen reduction reaction (ORR) activity. Nevertheless, the synthesis of carbon supported PtxY catalysts is challenging due to the low standard reduction potential of yttrium compared to platinum. Hence, extended electrochemical testing in actual PEMFCs remains elusive, especially with respect to catalyst degradation upon voltage-cycling. In this publication, we present the synthesis of a bimetallic PtxY/C catalyst via impregnation of commercial Pt/C with an yttrium halide precursor and subsequent heat-treatment in H2 at 1200°C. This catalyst showed a high specific ORR activity, at a mass activity similar to Pt/C due to its comparably low electrochemical surface area (ECSA). On the other hand, the large particle size of the here synthesized PtxY/C catalyst (≈10 nm) resulted in a significantly enhanced stability versus degradation in an accelerated stress test (AST) based on voltage-cycling between 0.6 and 1.0 VRHE at 50 mV s−1, showing a superior ECSA, ORR activity and H2/air performance after 30000 cycles compared to a standard Pt/C catalyst.
Export citation and abstract BibTeX RIS

This is an open access article distributed under the terms of the Creative Commons Attribution 4.0 License (CC BY, http://creativecommons.org/licenses/by/4.0/), which permits unrestricted reuse of the work in any medium, provided the original work is properly cited.
The overall costs of proton exchange membrane fuel cells (PEMFCs) are a major hurdle for their large-scale implementation in fuel cell electric vehicles (FCEVs).1 Along with other factors, the high costs originate from the use of platinum based electrocatalysts for the hydrogen oxidation reaction (HOR) as well as for the oxygen reduction reaction (ORR). While the anode Pt loadings of state-of-the-art membrane electrode assemblies (MEAs) can be reduced to very low levels (≈0.05 mgPt cm−2 or below) owing to the fast HOR kinetics,2 the slow ORR kinetics commonly require cathode electrode loadings on the order of 0.1–0.3 mgPt cm−2.1 Therefore, one strategy to decrease the noble metal content in the MEA is to develop Pt based cathode catalysts with enhanced ORR activity, whereby it has been shown that the alloying of Pt with other transition metals, e.g., Co or Ni, can enhance the ORR activity per Pt mass by a factor of ≈3–4.3,4 In addition to those commonly used 3d transition metals, theoretical calculations by Greeley et al. suggested bimetallic alloys based on Pt and Y to be another class of exceptionally active ORR catalysts.5 Initial measurements on polycrystalline bulk alloys in a rotating disk electrode (RDE) setup confirmed this hypothesis, showing a specific activity for the ORR at 0.9 V vs. the reversible hydrogen electrode (RHE) potential of ispec0.9 V ≈ 9.4 mA cm-2Pt for Pt3Y compared to ispec0.9 V ≈ 1.5 mA cm-2Pt for pure Pt (both at 23°C in 0.1 M HClO4, extracted from Figure 4a), suggesting a ≈6.5x higher specific activity of Pt3Y vs. Pt.5 Furthermore, the group hypothesized that the combination of those two metals might be beneficial with respect to catalyst durability in acidic electrolytes (i.e., in a PEMFC) due to the large heat of mixing upon alloying. Later on, Hernández-Fernández et al. prepared PtxY alloy nanoparticles by a gas-aggregation technique and showed its superior ORR activity compared to pure Pt in RDE measurements.6
Despite their promising ORR activity, the synthesis of PtxY alloy catalysts and their subsequent implementation into a PEMFC remains challenging due to the low standard reduction potential of yttrium and the associated synthetic difficulties to prepare sufficiently large quantities of PtxY nanoparticles supported on carbon, so that MEAs could be prepared for fuel cell testing. Even though ongoing research efforts led to first steps towards a larger scale synthesis of carbon supported PtxY alloys (PtxY/C),7,8 many catalysts presented in the literature are either non alloyed, consisting of yttrium (hydr)oxide decorated Pt9–11 or were prepared by approaches which are not conducive to the preparation of carbon supported PtxY nanoparticles (bulk alloys,5,12 dealloying of bulk alloys,13 gas-phase deposition methods,6,14,15 or electrodeposition on glassy carbon substrate).16 So far, the only PtxY catatlyst tested in an actual PEMFC cell were PtxY alloys sputter-deposited on a diffusion medium substrate coated with a carbon/ionomer composite layer,14 but even though its H2/O2 performance was shown to be superior to sputter-deposited Pt, no ORR activity or durability data were evaluated, so that a comparison with the state-of-the-art cannot be made.
In this publication, we report a facile synthesis route for carbon supported PtxY alloy nanoparticles from a commercial Pt/C precursor by reduction of YCl3 in H2 atmosphere at elevated temperature, similar to the approach recently employed by Roy et al.8 Following a detailed physical-chemical characterization of the PtxY/C catalyst by X-ray diffraction (XRD), transmission electron microscopy (TEM), and elemental analysis, its electrochemically active surface area (ECSA) and ORR activity was determined by RDE measurements. Subsequently, MEAs with PtxY/C as cathode catalyst were prepared and evaluated in a single-cell PEMFC to verify its suitability for fuel cell applications. Following the method outlined in our recent study,17 voltage-cycling accelerated stress tests (ASTs) were conducted in a single-cell PEMFC (triangular scans between 0.6 and 1.0 VRHE at 50 mV s−1 and 80°C) to investigate the PtxY/C catalyst stability with regards to its ECSA, its ORR activity, and its H2/air performance over the course of 30,000 voltage cycles.
Experimental
All air- or moisture sensitive chemicals were handled in an Ar-filled glove box (M. Braun Inertgas-Systeme GmbH, Germany) or by using standard Schlenck techniques. All solvents used in the synthesis were of high purity, dried and de-gassed before use. Ultrapure water had a resistance of 18.2 MΩ cm (MilliQ Ingegral, Merck Millipore KGaA, Germany). All gases were supplied by Westfalen AG (Germany) with a 6.0 grade for RDE and 5.0 grade for all other experiments (except for CO gas, which had a purity of 4.8). Comprehensive experimental details on RDE,18,19 and MEA preparation/fuel cell testing17 were given in previous publications, but the most pertinent information is given below. If not otherwise stated (e.g., Ecell), potentials referred to in CVs, polarization curves, and voltage-cycling experiments are referenced to the reversible hydrogen electrode (RHE) potential at a nominal H2 pressure of 100 kPaabs (VRHE), obtained by correcting the measured potential for the Nernstian shift resulting from H2 partial pressures different than 100 kPaabs. Furthermore, note that all pressures in fuel cell tests were measured and controlled at the inlet of the fuel cell and are reported as absolute pressures. If not stated otherwise, area-normalized currents refer to the geometric area of the electrode.
Thermogravimetric analysis (TGA)
TGA measurements were performed with a TGA/DSC 1 instrument, equipped with a gas controller (GC 200, Mettler Toledo Corp., Switzerland) set to flows of 40 mL min−1 of 5% H2 in Ar as reactive gas and to 20 mL min−1 Ar as cell purge gas. Heating from 25 to 1200°C was performed at a ramp of 20 K min−1. The samples were placed in a 70 μL sapphire crucible with lid (THEPRO GbR, Germany) in an Ar-filled glove box (M. Braun; H2O and O2 concentration < 0.1 ppm) and transferred to the TGA furnace with minimum exposure to ambient air. The weight loss of K2PtCl4 (99.99%, metal basis, Sigma Aldrich Corp., Germany) was measured to identify the reduction temperature of Pt.
Catalyst preparation
For the preparation of PtxY alloys supported on carbon, the appropriate amount of YCl3 was mixed in the glove box with a Vulcan carbon supported 20%wt Pt/C catalyst (TEC10V20E, Tanaka Kikinzoku Kogyo K.K., Japan) in an agate mortar at a molar Pt:Y ratio of 1:1. Approximately 1.5 g of the mixture were added to a 25 mL Schlenck tube and dispersed in 6 mL acetonitrile (≥99.9%, Sigma Aldrich Corp., Germany), corresponding to 24 mL  , and then sonicated (Elmasonic S 30 H, Elma Schmidbauer GmbH, Germany) for 3 min. Subsequently, the suspension was cooled by immersion into liquid nitrogen and freeze-dried in vacuum for at least 24 h. The dried catalyst precursor was transferred back into the glove box and homogenized by grinding in a mortar. For the thermal reduction, the desired amount of the precursor (on the order of 0.2 g) was transferred into a 150 μL sapphire crucible with lid. Several crucibles were placed into an aluminum oxide crucible and transferred to an Ar-purged tube furnace (LK 1300-150-600-3, HTM Reetz GmbH, Germany), equipped with an Al2O3 tube, while care was taken to minimize the contact of the sample with ambient air. The tube furnace was pre-heated to 1200°C under a constant flow of Ar (500 mL min−1), while the samples remained outside of the heating zone (T < 100°C). Once the temperature of 1200°C was reached, the gas flow was changed to 5% H2 in Ar (500 mL min−1), and then the crucible was pushed into the heated zone, using an aluminum oxide rod, entering the tube through a polysiloxane sealing. After the desired reaction time (1 h), the heating was turned off, allowing the samples to cool slowly to room temperature (≈5 h) in a pure Ar atmosphere (Ar flow of 200 mL min−1).
After the above described synthesis, the catalyst samples were handled and stored in ambient air. Leaching of the catalysts was carried out by dispersing them (≈0.1 L g-1catalyst) in continuously Ar-purged 1 M H2SO4 (ACS reagent, Sigma Aldrich Corp., Germany). After 3 h, the sample was recovered by centrifugation (5 min at 11500 rpm), followed by repeated washing with deionized water until a neutral pH was reached (≈5 times). Finally, the catalyst was dried overnight at 60°C in air; the typical amount of catalyst prepared in one synthesis run was ≈1 g.
For comparison, the as-received 20%wt Pt/C catalyst was heat treated at 1200°C in 5% H2 in Ar according to the same heating protocol as the PtxY/C catalyst, while the heating time was increased to 10 h. This catalyst is referred to as Pt/C-HT.
X-ray diffraction
X-ray powder diffractograms were measured with a Stadi P instrument (Stoe & Cie GmbH, Germany) with Cu Kα1 radiation (λ = 1.54059 Å, 50 kV, 30 mA, Ge(111) monochromatized) and a Mythen 1 K areal detector (Dectris Ltd., Switzerland) in transmission mode. The samples were prepared in glass capillaries (0.5 mm outer diameter, Hilgenberg GmbH, Germany). Four diffractograms recorded from 15–100° 2θ with a step size of 0.015° and a hold time of 11 seconds per step were averaged to enhance the signal to noise ratio. Angle correction of the diffractometer was done based on a Si standard, measured prior to every catalyst; manual background correction (especially in the region of the broad reflex from the carbon support) was conducted using the WinXPOW software suite (v. 3.0.2.1). Refinement of diffractograms was performed by structure independent profile fits using the Lebail method and the Topas Software (v. 6). The Thompson-Cox-Hastings pseudo-Voigt function was used for peak profile shape fitting.
RDE measurements
Glassy carbon (GC) electrodes (5 mm diameter, Pine Research Instrumentation, USA), supported by a PTFE-body (Pine Research Instrumentation, USA) were polished with 0.05 μm Al2O3 polishing suspension (Bühler AG, Germany), sonicated various times in ultrapure water and cleaned by subsequent dipping in 5 M KOH (99.99% purity, semiconductor grade, Sigma Aldrich Corp., Germany), 2 M HClO4 (60%, Cica Reagent, Kanto Chemical Co., INC., Japan), and ultrapure water. Inks were prepared by adding ultrapure water to the dry catalyst, followed by high purity 2-propanol (Chromasolv Plus, 99.9%, Sigma Aldrich Corp., Germany). The solvent mixture consisted of 80%vol 2-propanol and 20%vol H2O. The catalyst content of the ink was adjusted to achieve a thin catalyst layer thickness of ≈1 μm by choosing noble metal loadings of ≈9 μgPt cm−2 (corresponding to ≈36 μgVulcan cm−2 at a packing density of ≈28 μm (mgVulcan cm−2)−1).20 The catalyst suspension was sonicated for 30 min in a sonication bath to achieve a homogeneous suspension. The temperature of the bath was maintained lower than 25°C to avoid evaporation of the solvent. Subsequently, Nafion (5%wt in lower aliphatic alcohols, 15–20% H2O, Sigma Aldrich Corp., Germany) was added to the suspension to result in an ionomer to carbon (I/C) ratio of 0.1/1 gI g-1C. Prior to coating, the ink was sonicated in a low energy sonication bath (USC100T, VWR International GmbH, Germany) for at least 15 min. Finally, 7 μL of ink were dropped on a GC, covered with a small glass vial and left to dry at room temperature.
Electrochemical measurements were performed using an Autolab potentiostat (PGSTAT302N, Metrohm AG, Switzerland) and a rotator (Pine Research Instrumentation, USA) with a polyether ether ketone shaft at room temperature (25°C). Apart from measurements to develop the activation procedure, all experiments to determine the ORR activity followed a catalyst cleaning by cycling the potential 50 times between 0.05 and 1.20 VRHE at 50 mV s−1 (room temperature). Afterwards, the electrolyte solution was replaced by fresh 0.1 M HClO4 and saturated with O2. The resistance was determined by electrochemical impedance spectroscopy (EIS) from 100 kHz to 100 Hz at open circuit potential (OCP) with an amplitude of 10 mV. After fully saturating the electrolyte with O2, polarization curves were recorded from 1.10 to 0.05 VRHE at 10 mV s−1 and 1600 rpm. To determine the ECSA, CO stripping was performed by applying a constant potential of 0.06 VRHE and purging CO for 3 min. Subsequently, CO was removed from solution by Ar-purging for 30 min while the potential was kept constant. The adsorbed CO was oxidized in a stripping CV starting with a positive potential scan from the adsorption potential of 0.06 to 1.00 VRHE and then cycling between 0.05 and 1.00 VRHE at a scan rate of 10 mV s−1. The second CV was used as baseline to correct for the capacitance and the roughness factors (rf) were calculated from the resulting integral, using a specific charge of 420 μC cm-2Pt. At the end of the measurement, the electrolyte was saturated with pure H2 to calibrate the reference electrode with the platinum ring (of the ring-disc electrode) via conducting scans into the hydrogen oxidation and hydrogen evolution potential region (−0.05 and 0.1 VRHE) at a scan rate of 50 mV s−1 and a rotation rate of 1600 rpm. The potentials at the zero-current intercept of the anodic and cathodic scan were extracted and the average of the two potentials was taken as the RHE potential. This procedure was used already in earlier publications by our group.19,21
Membrane electrode assembly preparation
All fuel cell tests were conducted with 5 cm2 MEAs, fabricated by the decal transfer method. Catalyst inks were prepared by mixing the catalyst with a low equivalent weight ionomer in a water-solvent dispersion (700 g  , Asahi Kasei Corp., Japan). The ink components were added into a 15 mL capped bottle (HDPE), already containing 16.5 g of 5 mm ZrO2 beads as grinding medium in the following sequence: catalyst, water, 1-propanol, and finally the ionomer dispersion. The water concentration of the ink was 10%wt, while the solid content was 0.04 g mL-1ink, adjusted to an I/C ratio of 0.65/1 gI g-1C. The inks were mixed by placing the bottles onto a roller mill at 60 rpm for 18 h at 25°C. Thereafter, the inks were coated on virgin PTFE decals using the Mayer rod technique with the appropriate bar on a coating machine (K Control Coater, RK PrintCoat Instruments Ltd., England) and dried at ambient temperature followed by drying at 80°C in air. The anode was identical for all experiments, with a loading of 0.1 mgPt cm−2 based on a Vulcan carbon supported 20%wt Pt/C catalyst (same as used for the PtxY/C catalyst synthesis; see above) and with an I/C ratio of 0.65/1 gI g-1C. The MEAs were assembled by hot pressing a 15 μm membrane (Asahi Kasei Corp., Japan), placed between the anode and cathode decals, at 155°C for 3 min with an applied pressure of 0.11 kN cm−2. The platinum loading of the here prepared PtxY/C and Pt/C-HT cathodes was 0.12 mgPt cm−2 with a maximum deviation of ±5%, determined by weighing the decals before and after the catalyst layer transfer. As a reference, the performance of MEAs with PtxY/C cathodes will be compared with that of MEAs with cathodes based on the same commercial 20%wt Pt/C catalyst that served as precursor for the here synthesized PtxY/C catalyst, whereby the cathode loading of the Pt/C MEAs was slightly lower (0.10 mgPt cm−2); note that the anode electrodes were the same and that the Pt/C MEA data have been taken from Harzer et al.17 At least two independent fuel cell measurements were conducted and subsequently averaged with error bars corresponding to the mean absolute deviation.
Fuel cell testing equipment
Electrochemical measurements were performed on an in-house manufactured, single-cell hardware, using commercial graphite flow fields (0.5 mm lands/channels; manufactured by Poco Graphite, Entegris GmbH, Germany, according to our design).22 Gas diffusion layers (GDLs) were the same in all experiments (H14C7, Freudenberg KG, Germany) and the GDL compression was adjusted to 20 ± 1% by quasi-incompressible, PTFE-coated fiberglass gaskets (Fiberflon, Fiberflon GmbH & Co. KG, Germany), assembled at a torque of 12 Nm (for details see Simon et al.).23 Fuel cell tests were performed on automated test stations (G60, Greenlight Innovation Corp., Canada) equipped with a potentiostat (Reference3000, Gamry Instruments, USA) to conduct EIS.
Voltage-cycling AST procedure and PEMFC diagnostics
All MEAs were conditioned using a voltage-controlled conditioning procedure (H2/air flows of 1390/3320 nccm at 80°C, 100% relative humidity (RH), and 150 kPaabs; nccm is defined at standard conditions of 273 K and 101.3 kPa): 0.6 V for 45 min, 5 min at OCV, and 10 min at 0.85 V; this sequence was repeated 10 times, after which constant performance was reached. MEAs composed of the heat-treated Pt catalyst (Pt/C-HT) and the PtxY/C catalyst were activated by 50 potential cycles between 0.07 and 1.20 VRHE at a scan rate of 50 mV s−1, 40°C, ambient pressure, and 200/50 nccm of fully humidified 5% H2 in N2/dry N2, respectively. Before each set of differential flow polarization curves and diagnostic measurements, an MEA recovery step was implemented, consisting of a constant potential hold time at 0.3 V for 2 h in H2/air (2000 nccm/5000 nccm) at 40°C, 270 kPaabs, and 100% RH.
Cyclic voltammetry (CV) of the cathode was recorded at a scan rate of 150 mV s−1 between 0.07 and 1.00 VRHE, at 40°C, and ambient pressure. The counter/reference electrode was supplied with 200 nccm fully humidified 5% H2 in N2, and the working electrode was initially purged with dry N2 at 50 nccm, interrupting the gas flow to record the CVs. CO stripping was performed by adsorbing CO (10% CO in N2, 100 nccm) for 10 min at 40°C and 150 kPaabs, while maintaining the cathode potential at 0.1 VRHE. Subsequently, residual CO was removed from the cell and the gas lines by purging with nitrogen for ≈1.5 h. A CV from the holding potential to 1.1 VRHE at a scan rate of 100 mV s−1 was executed to oxidize the adsorbed CO. Two additional sweeps were recorded to verify the full oxidation and removal of CO from the electrode and the gas feed system. The ECSA was determined by integrating the area of the first anodic scan with the subsequent sweep as baseline, using a specific charge of 420 μC cm-2Pt.
The proton conduction resistance in the cathode catalyst layer,  (in units of Ω cm2), was determined from AC impedance spectra, recorded in H2/N2 (anode/cathode) at 0.2 V with a peak-to-peak perturbation of 3.5 mV between 500 kHz and 0.2 Hz (20 points per decade), according to a procedure reported in the literature,24,25 and analyzed based on a transmission line model.26 In order to ensure reproducibility, the measurement was repeated three times at each condition: 100, 70, 50, and 30% RH, while maintaining constant gas partial pressures (i.e., at cell pressures of 270, 255, 246, and 236 kPaabs, respectively) under differential flow conditions (H2/N2 at 1000/1000 nccm) at 80°C. The proton resistivity,
  (in units of Ω cm), was calculated by dividing
  by the cathode electrode thickness. The electrode thickness was calculated from the carbon loading of the electrode and its specific packing density in the catalyst layer (22 ± 4 μm (mgC cm−2)−1).17
Differential flow polarization curves were recorded in current-control mode at 80°C, 170 kPaabs, 100% RH for both reactants, and constant flows of 2000 nccm of H2 on the anode and 5000 nccm of O2 or air on the cathode. Anode and cathode were operated in counter flow mode. At these conditions, the inlet to outlet pressure drop in anode and cathode was approximately 2 and 22 kPaabs, respectively. Prior to recording polarization curves from low to high current densities, the cell voltage was set to 0.75 V for 15 min to reduce Pt oxides. Each current density point was held constant for at least 10 min, averaging the resulting voltage over the final 30 s. The ORR kinetics (mass activity, specific activity, and Tafel slopes) were determined from H2/O2 polarization curves after application of two corrections: i) the potential was corrected for the iR-drop, using the high frequency resistance (HFR) obtained from the x-axis intersect in the Nyquist plot measured by galvanostatic electrochemical impedance spectroscopy (GEIS) in the frequency range from 100 kHz to 10 Hz at each current density (applying a 10% AC amplitude with respect to the current, limited to a minimum/maximum of 0.1/3.0 A); and for the effective proton conduction resistance ( ) ii) the current was corrected for the ohmic short of the membrane, as well as for the H2 crossover, both determined in H2/N2 (600/150 nccm) at 170 kPaabs, 80°C, and 100% RH by applying a constant potential of 0.2, 0.3, 0.4, 0.5, 0.6 and 0.7 V for 2 min each.
Aging of the cathode electrodes was performed at 100 kPaabs, 80°C, 100% RH, and H2/N2 flows of 200 nccm/75 nccm on anode/cathode, respectively. ASTs were composed of triangular wave modulation between 0.6 and 1.0 VRHE at 50 mV s−1. To avoid reductive currents during voltage-cycling, all residual O2 was removed from the humidifier and gas line system by a N2 purging procedure, lasting approximately 45 min.
Results and Discussion
Evaluation of YCl3 reduction via TGA
The synthesis of PtxY/C alloys, presented in this work, is based on the reduction of an yttrium halide precursor to metallic yttrium using H2 at elevated temperature and simultaneous alloying with platinum in its vicinity. According to the calculations presented by Roy et al., the reduction of YCl3 by H2 at elevated temperature is possible when the evolving HCl gas (according to Equation 1) is constantly removed from the system. To verify the reaction according to Equation 1, the mass change of YCl3 was monitored vs. temperature in H2 atmosphere. In contrast to yittrium halide precursors, the formation of metallic yttrium from many other precursors (e.g., yttrium oxide) occurs at significantly higher temperatures and would not be viable in a similar synthesis procedure.8
![Equation ([1])](https://content.cld.iop.org/journals/1945-7111/165/15/J3173/revision1/d0001.gif)
The TGA of YCl3, provided in Figure 1 (blue line), reveals a total weight loss of 55.0% when the temperature is increased from 25 to 1200°C, which is in excellent agreement with the theoretical loss of 54.5% for the full reduction of YCl3 to Y (calculated from the stoichiometry of the components and their molar masses, i.e., 195.3, 2.0, 88.9, and 36.5 g mol−1 for YCl3, H2, Y, and HCl). Even though the mass of the precursor starts to decrease at approximately 800°C, the TGA experiment suggests that the temperature for a complete reduction is >1000°C.
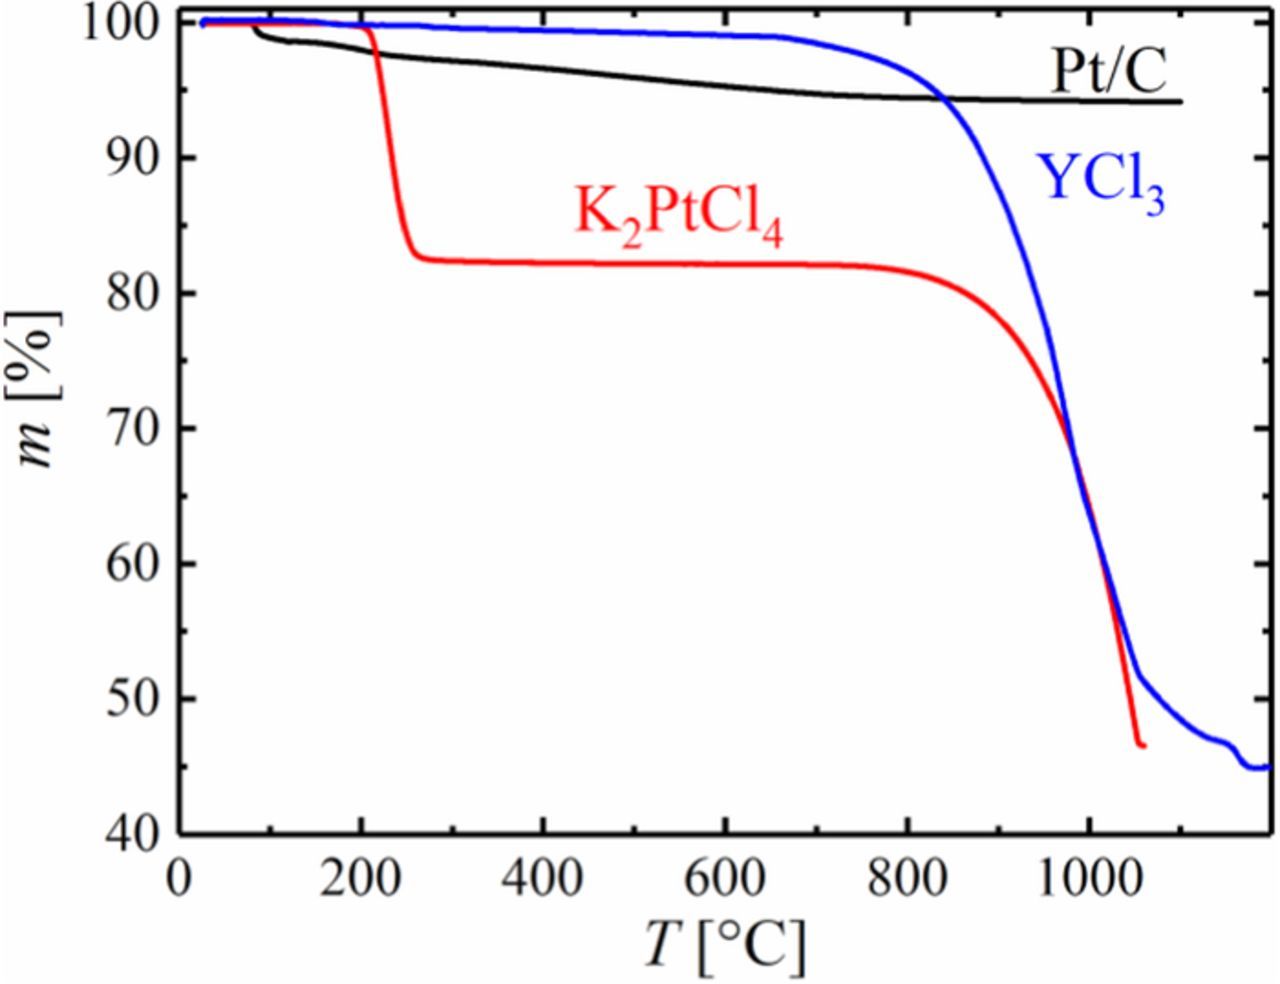
Figure 1. TGA of YCl3 (blue), K2PtCl4 (red) and 20%wt Pt/C (black) showing the mass of the sample, m, versus temperature, T, at a heating rate of 20 K min−1 in 5% H2 in Ar at a flow rate of 40 mL min−1 as reactive gas and 20 mL min−1 of Ar as purge gas for the TGA cell.
Following this synthesis route for PtxY alloys from YCl3 precursor, PtxY/C alloys can either be prepared by co-reduction of YCl3 and a Pt precursor on carbon or by impregnation of a Pt/C catalyst with YCl3 and subsequent heat-treatment in a H2 containing atmosphere. However, in contrast to the high temperature necessary to reduce YCl3, common platinum precursors are easily reduced to the metal at temperatures on the order of 300°C. As an example, the TGA curve of K2PtCl4, provided in Figure 1 (red line), shows a mass loss of 17.8% at ≈270°C, which is in good agreement with the complete reduction to metallic Pt (17.1% mass loss) according to Equation 2 (molar masses of 415.1, 195.1, and 74.6 g mol−1 for K2PtCl4, Pt, and KCl).
![Equation ([2])](https://content.cld.iop.org/journals/1945-7111/165/15/J3173/revision1/d0002.gif)
We ascribe the additional mass loss in this experiment at temperatures above ≈900°C (red line in Figure 1) to the reduction of KCl to metallic potassium, accompanied by immediate evaporation (the boiling point of potassium is 774°C).
As expected, there is no significant change in the mass of a Pt/C catalyst upon temperature exposure to 1200°C in H2 (Figure 1, black line), where the small loss (≈6%) can be attributed to the release of water, the removal of minor impurities, and the reduction of surface groups on Pt and carbon in the as-received catalyst. Since the reduction of common Pt precursors is facile and occurs at significantly lower temperatures compared to the formation of metallic Y from YCl3, the preparation of PtxY/C alloys from Pt and YCl3 precursors does not provide any advantages over the reduction of an yttrium halide salt on a well-known Pt/C catalyst. Therefore, PtxY/C catalysts were synthesized based on the reduction of YCl3 on a commercial 20%wt Pt/C catalyst to simplify the synthesis.
Ex situ catalyst characterization
Since TGA experiments have shown that the reduction of YCl3 by H2 is generally feasible (c.f., Figure 1), PtxY/C was prepared by dispersing YCl3 on a conventional Pt/C catalyst and subsequent heat-treatment in a tube furnace at 1200°C under a flow of 5% H2 in Ar (500 mL min−1) for 1 h, as described in more detail in the Experimental section. As the melting point of Pt-Y alloys is rather high, ranging between 1000°C (for Y-rich alloys) and 2000°C for Pt-rich alloys,27 we expected that a comparably high temperature was necessary to ensure sufficient mobility of the metal atoms to form an alloy. According to Greeley et al., Pt3Y bulk alloys show a high ORR activity,5 hence a molar ratio of Pt:Y of 3:1 would in principle be desirable for the synthesis. However, quantitative alloying of Y and Pt is unlikely to occur for the here chosen synthesis method, because the YCl3 precursor was dispersed over the entire Pt/C catalyst, including the carbon support. Therefore, an excess of yttrium compared to the Pt3Y phase was used in this study (Pt:Y molar ratio of 1:1). The resulting, crystalline Pt-Y alloy phases and side products of the synthesis were analyzed by XRD.
Figure 2a shows the XRD pattern of the as-synthesized PtxY/C catalyst (after background and angular shift correction vs. a Si standard), with the respective literature hkl tick positions for the identified phases provided below the graph. Phase identification was carried out using the ICDD database. Due to the heterogeneous composition of the sample and the broad, strongly overlapping reflexes in the PtxY samples (especially in the range of 40° 2θ), a refinement (hkl tick positions or Rietveld refinement) of the diffractogram was not possible. Hence, only the diffractogram of Pt/C-HT was refined for hkl tick positions.
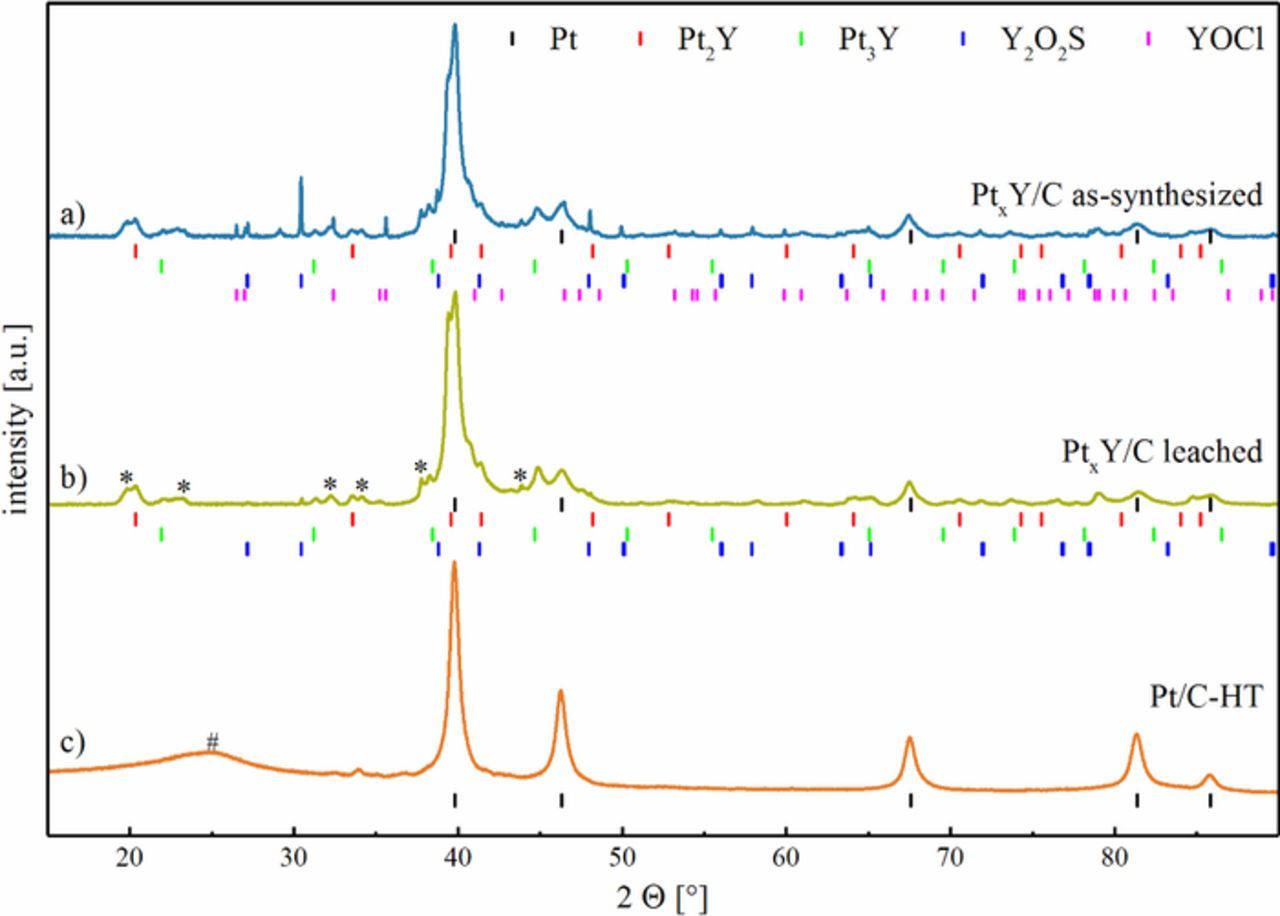
Figure 2. XRD patterns (after background and the angular shift corrections) of the various catalyst powders prepared in this study: a) as-synthesized PtxY/C; b) PtxY/C after leaching of the as-synthesized material with 1 M H2SO4; and, c) heat treated Pt/C catalyst (Pt/C-HT) produced from the same Pt/C material as comparison. The literature hkl tick positions are shown for Pt (black),28 Pt2Y (red),29 Pt3Y (green),30 Y2O2S (blue),31 and YOCl (magenta).32 Unidentified reflexes are marked with an asterisk (*), and the hashtag (#) denotes the broad reflex originating from the carbon support (already subtracted for the patterns in a) and in b).
As no refinement of hkl tick positions for the PtxY samples was possible, an exact determination of the phase composition (degree of alloying of Pt with Y in mixed phases) in the as-synthesized and leached PtxY/C catalyst was not possible. Nevertheless, it is evident from the XRD patterns provided in Figure 2 that the formation of the desired Pt2Y and Pt3Y alloy phases was successful by the reduction of YCl3 and its simultaneous alloying of Y with Pt at 1200°C. For the heat-treated Pt/C catalyst, lower cell parameters compared to literature (3.921 Å vs. 3.923 Å)28 were determined by a structure-less refinement using the Lebail method which can be explained by the observation of Solliard et al., who showed that the lattice constant of Pt nanoparticles can be slightly lower compared to bulk materials (Figure 2c).33 In our case, the cell parameter of 3.921 Å is in good agreement with literature values for a Pt particle size of approximately 10 nm.33 This average crystallite size is also in good agreement with the particle size analyzed by TEM, further elaborated upon below (c.f., Figure 3).
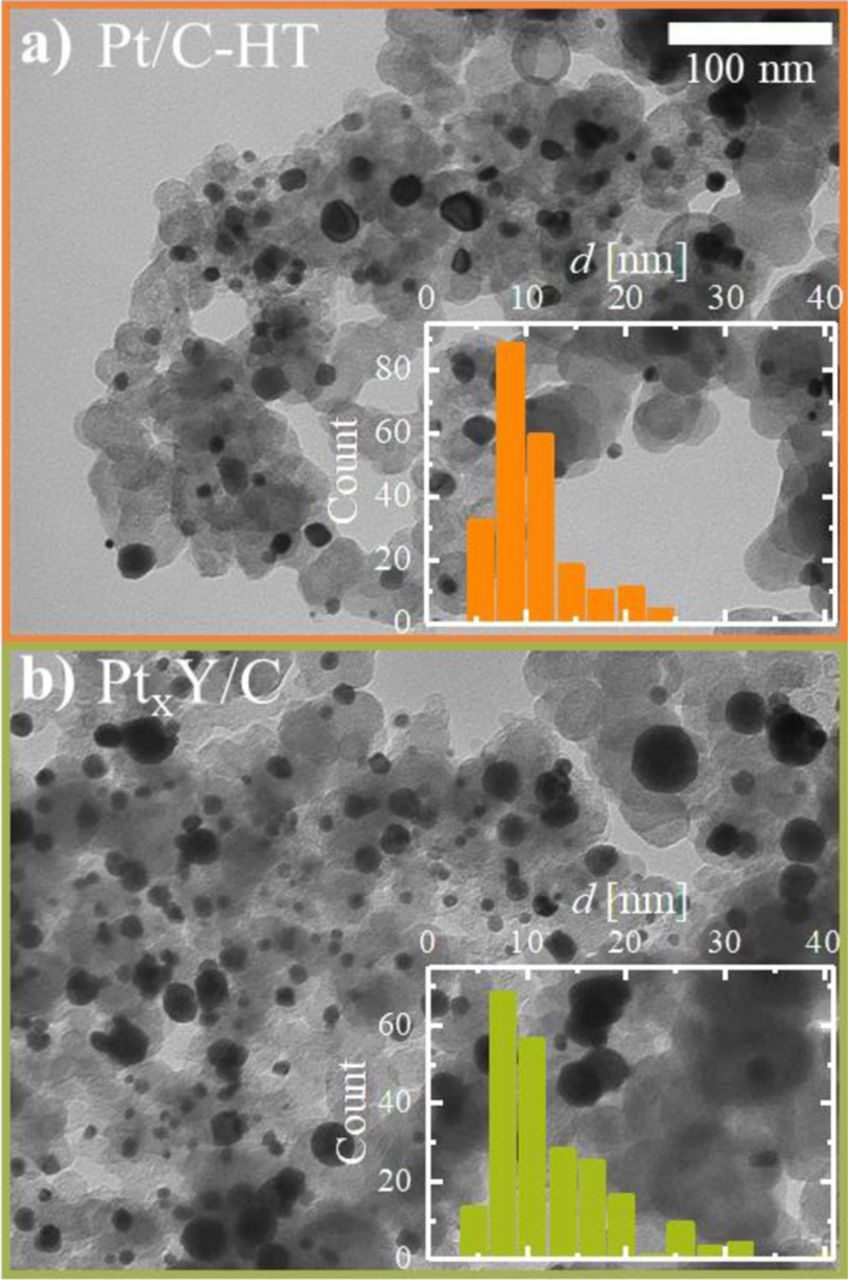
Figure 3. TEM images at a magnification of 52000x and representative particle size distribution (insets) of: a) heat treated 20%wt Pt/C catalyst referred to as Pt/C-HT (prepared at 1200°C in 5% H2 in Ar for 10 h); b) PtxY/C catalyst after leaching (prepared at 1200°C in 5% H2 in Ar for 1 h and subsequent leaching in 1 M H2SO4).
Undesired side phases were found in the as-synthesized catalyst, partially identified as Y2O2S and YOCl. Especially the formation of Y2O2S was unexpected, since no sulfur was intentionally added with the precursors of the synthesis. However, elemental analysis showed that the Vulcan carbon support of the Pt/C catalyst contained approximately 0.5 ± 0.3%wt sulfur,34 which was verified to be similar for the platinum containing catalyst (0.6 ± 0.2%wt determined by elemental analysis), thereby explaining the occurrence of Y-S phases. The formation of Y2O2S at high temperatures (1250°C) in 5% H2 was also reported by Wang et al., using, amongst others, Y2O3 and sulfur as precursors.35 Interestingly, Y2O3 was not found to be the major crystalline side phase at the given reaction conditions, although metallic yttrium is expected to be oxidized upon exposure to ambient air after completion of the synthesis. The formation of YOCl from Y2O3 in the presence of Cl2, was, e.g., reported by Gaviria et al., who studied YOCl formation between 575–975°C.36 The formation of minor amounts of oxidized yttrium species during the preparation process might originate from the transfer of the sample from the glove box to the tube furnace during which a short air exposure (< 10 s) could not be avoided.
In order to remove the different side phases and leachable non-noble metal cations, the catalyst was washed with sulfuric acid after the synthesis; this is also necessary to avoid a later contamination of the ionomer phase in the MEA with leachable cations, which would negatively affect PEMFC performance. The XRD of the catalyst after leaching in 1 M H2SO4 is shown in Figure 2b, including the literature hkl tick positions of the identified phases. No change of the reflex positions of Pt and Pt-Y alloy phases was observed after the acid treatment. The YOCl phase was removed quantitatively, while trace amounts of Y2O2S remained in the catalyst, indicated mostly by the small reflex at 30.4° 2θ. In addition to the identified phases, minor unknown side phases (marked by an asterisk in Figure 2b) were detected. This unknown phase (or multiple phases) did not match any diffraction pattern of phases containing either Pt, Y, C, O, S, Cl or H found in the ICDD database. While we cannot quantify the weight fractions of the various phases from the XRD data, they nevertheless indicate that the PtxY alloy phases and the remaining Pt phase are the majority constituents of the final catalyst. At the same time, elemental analysis of the leached catalyst showed that the total amount of yttrium decreased from 5%wt to 3%wt, whereas the platinum quantity remained unchanged at 19%wt, which corresponds to an average molar ratio of Pt:Y of ≈3:1, suggesting that at least a major fraction of the leached catalyst contains Pt3Y and Pt2Y phases (further on referred to as leached PtxY/C catalyst).
Particle size distribution of PtxY/C
The leached PtxY/C catalyst prepared by the synthesis method described earlier (1200°C, H2, 1 h, leached in 1 M H2SO4), was imaged by TEM in order to analyze its particle size distribution and dispersion on the carbon support. As comparison, the particle size distribution of a Pt/C catalyst heat treated in the absence of an yttrium precursor was evaluated (Pt/C-HT). The heat-treatment procedure for this reference catalyst was prolonged to 10 h in order to achieve a similar average particle size compared to the PtxY/C catalyst. As shown in Figures 3a and 3b, the Pt and PtxY particles of these two catalysts span a broad range of particle sizes from ≈4 nm to more than 30 nm, with the majority of particles in both cases having a diameter on the order of 10 nm.
The number-averaged ( ) and surface-averaged (
 ) diameters were calculated according to Equations 3 and 4 for the two catalysts.
![Equation ([3])](https://content.cld.iop.org/journals/1945-7111/165/15/J3173/revision1/d0003.gif)
![Equation ([4])](https://content.cld.iop.org/journals/1945-7111/165/15/J3173/revision1/d0004.gif)
On the one hand, both catalysts had a very similar number-averaged diameter of  = 11 and 12 nm for Pt/C-HT and PtxY/C, respectively. On the other hand, the broader particle size distribution and especially the presence of several very large particles in the PtxY/C catalyst (≈30 nm) resulted in a substantially larger surface-averaged particle size of
  = 21 nm compared to that of 14 nm for the Pt/C-HT catalyst. Hence, the particle size of these catalysts is substantially larger than that of the 20%wt Pt/C precursor (TEC10V20E,
  = 2.8 nm17 and
  = 3.2 nm). The larger surface-averaged particle diameter of the PtxY/C catalyst might either originate from the alloying of the platinum nanoparticles with yttrium as opposed to the simple temperature-driven coalescence of platinum nanoparticles in the case of the Pt/C-HT catalyst, but may also be due to the fact that a single large particle can lead to a substantial increase in the calculated value of
  , so that its quantification from TEM image analysis is prone to large errors, even when counting several hundred particles. Despite this experimental uncertainty,
  may be used to estimate the ECSA based on the surface and volume of a sphere according to Equation 5:
![Equation ([5])](https://content.cld.iop.org/journals/1945-7111/165/15/J3173/revision1/d0005.gif)
For the Pt/C-HT catalyst (ϱ = 21.5 g cm−3), this results in an estimated ECSA of ≈20 m2Pt gPt-1, compared to ≈85 m2Pt gPt-1 for the commercial 20%wt Pt/C catalyst which was used as precursor. Similarly, we can estimate the ECSA of the PtxY/C catalyst by assuming an average particle density of ϱ = 15.8 g cm−3 (calculated from the crystallographic densities of Pt2Y (14.9 g cm−3) and Pt3Y (16.7 g cm−3)), predicting a similar ECSA of ≈18 m2Pt gPt-1. However, it should be noted, that these numbers present only a rough estimate of the ECSA, since Equation 5 assumes perfect spherical particles, a statistically significant particle size distribution (difficult for broad size distributions), and that the contact area between nanoparticles and the support is essentially zero.
Even though the ORR overpotential is expected to increase with decreasing ECSA, a higher specific activity of the PtxY/C catalyst might yield a comparable or better ORR mass activity as a high surface area Pt/C catalyst, while also providing significantly enhanced stability due to the high thermodynamic stability of large particles. Therefore, the following electrochemical analysis of the prepared catalysts focuses on the evaluation of the ECSA, ORR activity, and catalyst stability over the course of a voltage-cycling AST.
ECSA determination via CO stripping
Electrochemical evaluation of the leached PtxY/C catalyst was first performed by cyclic voltammetry in an RDE setup in 0.1 M HClO4, and steady-state CVs for different potential windows are shown in Figure 4a. When initially limiting the upper potential to 1.0 VRHE, the CV of PtxY/C shows rather undefined Hupd features, with only a broad peak in the potential region from 0.05 to ≈0.30 VRHE, while the formation of surface oxide species above ≈0.8 VRHE is suppressed. Surface oxide formation in the anodic scan is only observed upon opening the upper potential window to 1.2 VRHE, with the corresponding reduction feature at 0.8 VRHE; at the same time, more pronounced Hupd features appear in the hydrogen adsorption/desorption regime. The occurrence of Hupd peaks may suggest the liberation/formation of Pt sites on the surface of the catalyst, e.g., due to restructuration of the surface, leaching of yttrium from the surface, and/or cleaning of Pt sites from adsorbates. The surface (hydr-)oxide formation charge below 1.2 VRHE and the Hupd charge still increase significantly when the upper potential window is increased to 1.3 VRHE, while a further increase of the upper potential limit to 1.4 VRHE is not anymore accompanied by a significant increase in the Hupd area.
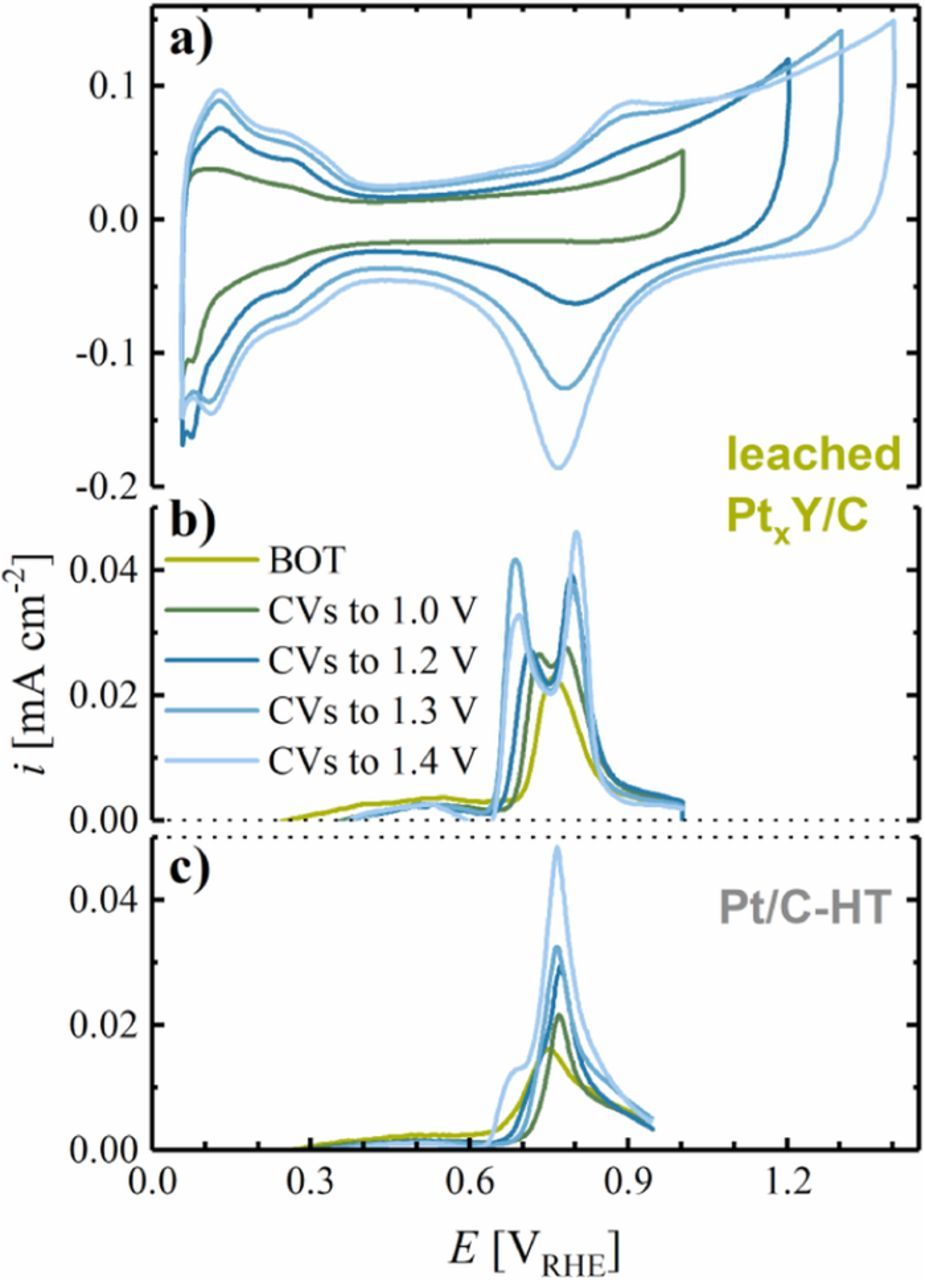
Figure 4. a) Steady-state CVs of the leached PtxY/C catalyst in stagnant, deaerated 0.1 M HClO4 at room temperature with a scan rate of 50 mV s−1, a lower potential limit of 0.05 VRHE, and an upper potential limit of 1.0, 1.2, 1.3 or 1.4 VRHE. The measurement consisted of 50 cycles in each potential window, for which only the steady-state CV is shown. b) Baseline-corrected CO stripping voltammograms of the same PtxY/C catalyst at a scan rate of 10 mV s−1 from 0.06 to 1.00 VRHE. CO stripping was carried out at beginning-of-test (BOT) and after 50 cycles to the respective upper potential limit (shown in the same color). The catalyst was prepared by heat-treatment at 1200°C for 1 h and leached in 1 M H2SO4 prior to the measurement. c) Baseline-corrected CO stripping voltammograms of Pt/C-HT prepared by heat-treatment of the 20%wt Pt/C catalyst at 1200°C for 10 h.
CO stripping was performed after each cycling step to identify the development of the ECSA, as well as to obtain a more elaborate understanding of the surface properties of the PtxY/C catalyst. In the CO stripping at beginning-of-test (BOT), i.e., after dipping the electrode into the electrolyte and applying a potential of 0.06 VRHE to adsorb CO, the first anodic scan shows a single oxidative peak at ≈0.76 VRHE (green line in Figure 4b), while the CO oxidation wave separates into two distinct features after 50 cycles with an upper potential limit of 1.0 VRHE (dark green line in Figure 4b). After 50 cycles (each) first to 1.2, then 1.3, and finally to 1.4 VRHE, the CO peaks further separate, reaching constant peak positions at 0.69 and 0.80 VRHE when cycling to ≥1.3 VRHE. Similar to the leached PtxY/C catalyst, the Pt/C-HT catalyst, heat treated in 5% H2 (at 1200°C for 10 h), shows a single CO stripping peak at ≈0.75 VRHE at BOT (green line in Figure 4c). After 50 cycles to 1.0 VRHE this CO stripping peak shifts slightly to 0.77 VRHE, with its position remaining unaltered when cycling to higher upper potential limits. The similarity of the CO stripping voltammograms of Pt/C-HT and the leached PtxY/C at BOT and the differences evolving after 50 cycles to higher potentials suggest that cycling to at least 1.2 VRHE is required to clean the catalyst surface from contaminants/adsorbates originating from the synthesis process (this is the reason why 50 cycles to 1.2 VRHE were chosen as activation procedure; see Experimental section). Furthermore, the separation of the CO oxidation features into two peaks on the PtxY/C catalyst and the peak position differences compared to Pt/C-HT after cycling to ≥1.2 VRHE provides electrochemical evidence for the incorporation of Y into the Pt structure. The occurrence of two individual CO oxidation waves on PtxY/C could be rationalized by several phenomena: i) the presence of different crystal facets on the PtxY/C catalyst with different reactivity toward the oxidation of CO; ii) the partial formation of a Pt-enriched shell on the bimetallic alloy core induced by the potential cycling procedure; and/or, iii) the occurrence of several alloy phases of Pt and Y. While we cannot exclude any of the hypotheses, the latter is supported by the XRD diffractograms discussed earlier (c.f., Figure 2b).
Interestingly, none of the CO stripping features of the leached PtxY/C coincides with the peak potential for CO oxidation on the heat treated Pt/C-HT catalyst. We therefore conclude that most Pt nanoparticles in the PtxY/C catalyst are, at least partially, influenced by the presence of yttrium, e.g., due to partial incorporation of yttrium into the platinum lattice. Thus, the CO oxidation wave at the more positive potential may represent Pt nanoparticles with small amounts of yttrium. This is supported by the decrease in the relative intensity of the CO stripping wave at low potential compared to that at high potential when cycling to 1.4 VRHE, where a loss of yttrium due to dealloying would be expected. Hence, the evolution of the CO stripping waves upon potential cycling indicates both, the presence of different PtxY phases in the prepared catalyst and an enrichment of Pt on the surface of the particles due to leaching of Y. Nevertheless, to the best of our knowledge, no CO stripping data on well-defined PtxY alloys was reported in the literature, hence no unambiguous assignment of the two CO stripping peaks to specific PtxY phases can be carried out.
Since the hydrogen ad- and desorption process on PtxY alloys is not well-characterized and might therefore not be a reasonably accurate measure of the catalysts' ECSA, the charge originating from CO stripping was utilized to evaluate the surface area of the prepared catalysts. Due to its large average particle size (c.f., Figure 3), the ECSA of PtxY/C determined by CO stripping is rather small, amounting to 13 ± 2 m2Pt g-1Pt after pre-cycling to 1.0 VRHE and reaching 16 ± 1 m2Pt g-1Pt after pre-cycling to ≥1.3 VRHE (see Figure 6a); the latter is in quite good agreement with the ECSA value determined by TEM analysis (≈18 m2Pt g-1Pt). These CO stripping derived ECSA values are comparable to those obtained for the heat treated Pt/C-HT catalyst (7 ± 1 m2Pt g-1Pt after pre-cycling to 1.0 VRHE and 13 ± 1 m2Pt g-1Pt after pre-cycling to 1.4 VRHE), but are of course much smaller than those obtained for the commercial 20%wt Pt/C catalyst (74 ± 2 m2Pt g-1Pt).34
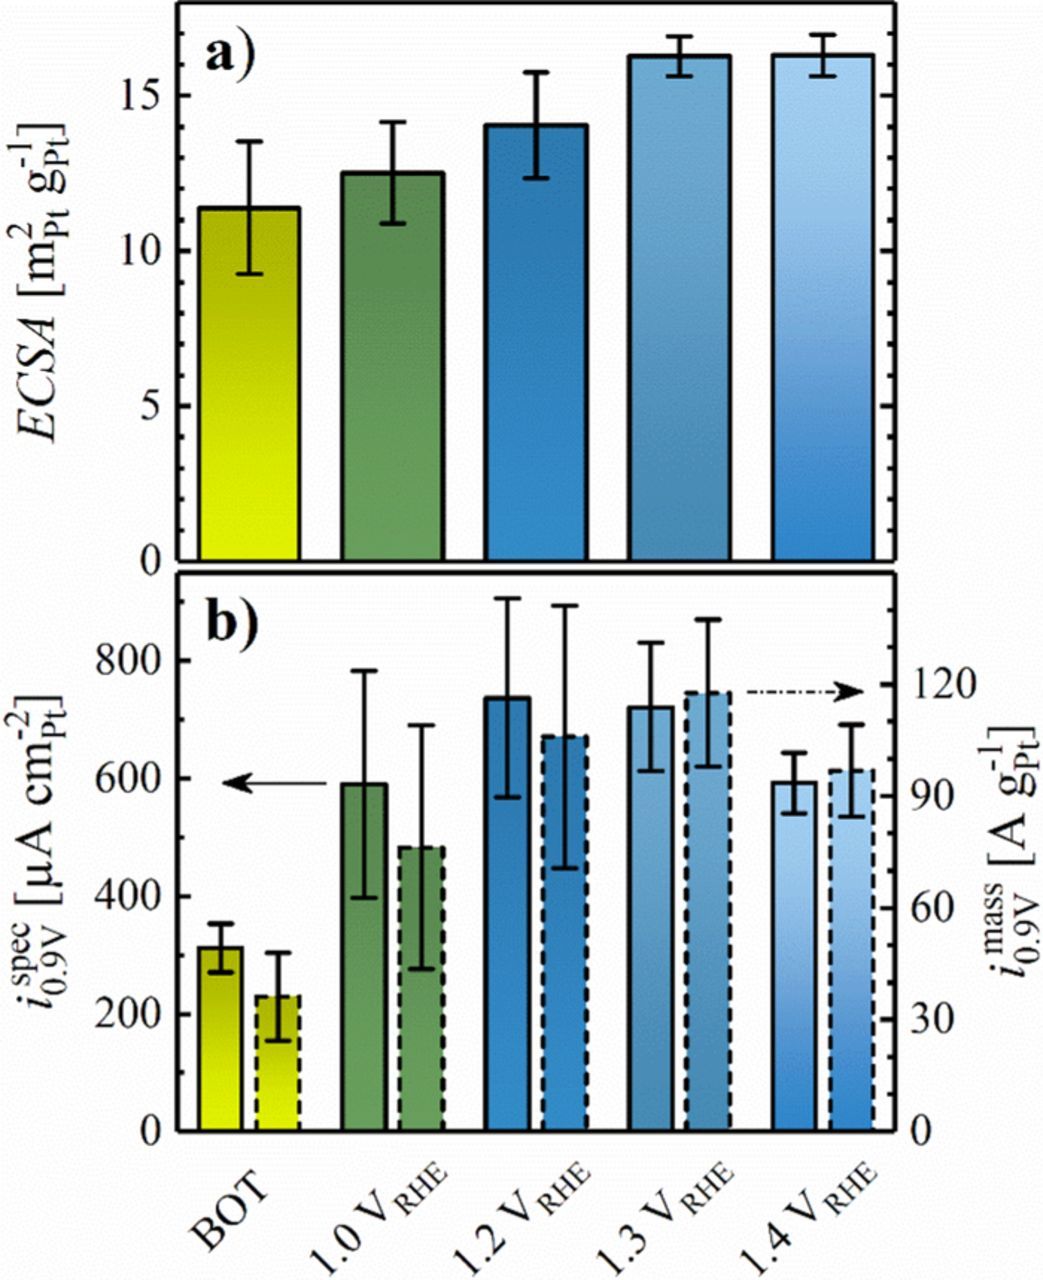
Figure 6. a) ECSA as a function of the upper potential limit in preceding cleaning CVs (50 cycles at 50 mV s−1 between 0.05 VRHE and the marked upper potential limit at 25°C) for the leached PtxY/C catalyst evaluated from CO stripping, using a specific charge of 420 μC cm−2. b) Specific ORR activity (bars with solid lines, left y-axis) and ORR mass activity (bars with dashed lines, right y-axis) at 0.9 VRHE as a function of the upper potential limit in preceding cleaning CVs. Error bars represent the standard deviation of at least 2 measurements.
ORR activity in RDE
To identify the suitability of the catalyst for the incorporation into the cathode of a PEMFC, and then to optimize the electrochemical cleaning procedure, the catalyst ORR activity was assessed in O2-saturated 0.1 M HClO4 in an RDE setup. The anodic scans of the leached PtxY/C (green line), as well as of a commercial 20%wt Pt/C catalyst (gray line) are shown in Figure 5 for comparable Pt loadings (8.7 and 9.3 μgPt cm−2, respectively), with the expected limiting current on the order of 5.5–6.0 mA cm−2.37 Quite clearly, compared to the commercial Pt/C catalyst, the ORR mass activity of the PtxY/C catalyst after preceding cleaning cycles to 1.2 VRHE is significantly lower.
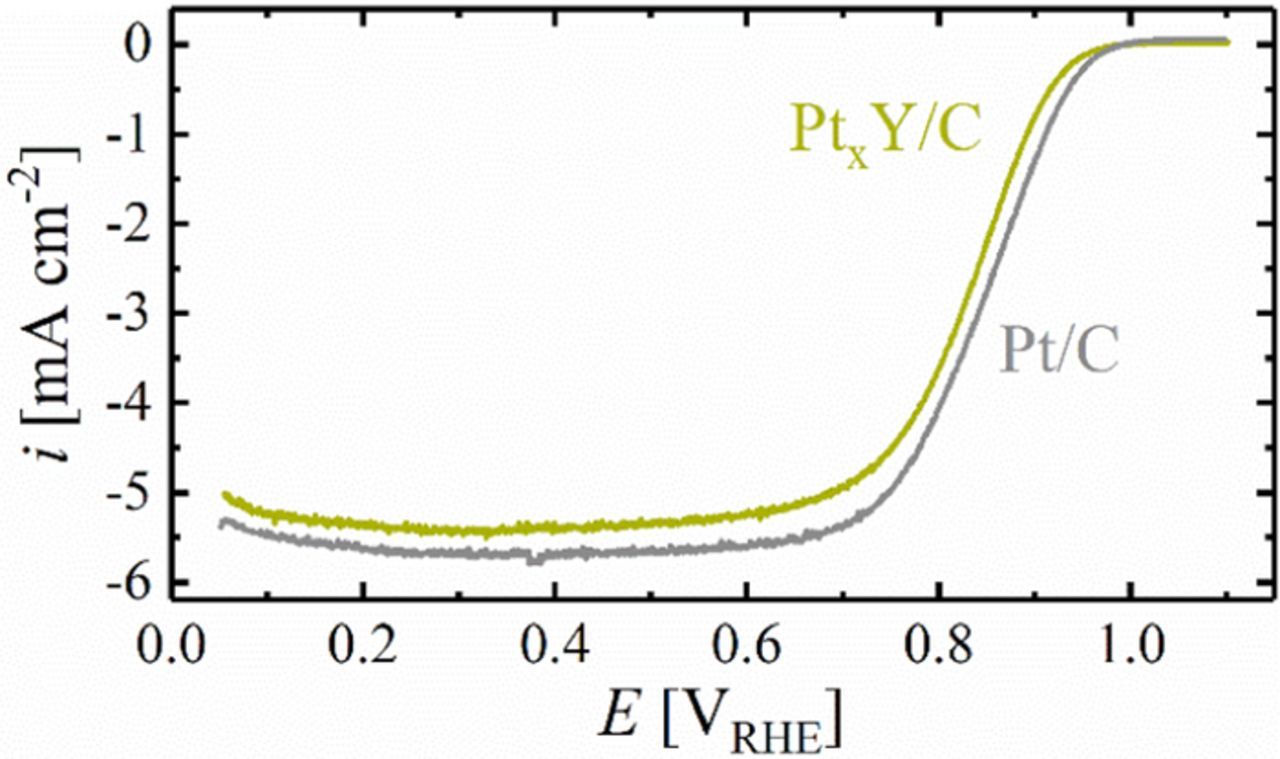
Figure 5. Steady-state anodic voltammetric scan (10 mV s−1) in O2-saturated 0.1 M HClO4 at room temperature and a rotation rate of 1600 rpm, comparing leached PtxY/C (prepared under 5% H2 at 1200°C for 1 h) with commercial 20%wt Pt/C (i.e., not heat treated) at a loading of 8.7 and 9.3 μgPt cm−2, respectively. The ohmic resistance measured by EIS was ≈35 Ω, however, the data shown in the figure are not iR corrected. Prior to determination of the ORR activity, the electrodes were subjected to 50 potential cycles between 0.05 and 1.20 VRHE at a scan rate of 50 mV s−1.
To extract the ORR activity of the catalysts, the potential was corrected for the ohmic drop (measured via EIS at OCV in O2-saturated electrolyte). Subsequently, the measured current was extracted at 0.9 VRHE and corrected for the capacitive contribution (determined from a CV in Ar-saturated electrolyte at the same potential), as well as for the depletion of the O2-concentration in the vicinity of the electrode according to Equation 6.
![Equation ([6])](https://content.cld.iop.org/journals/1945-7111/165/15/J3173/revision1/d0006.gif)
Here, i is the measured current, ikin is the calculated kinetic ORR current, and ilim is the measured limiting current.
Despite the fact that the specific ORR activity of the leached PtxY/C before cycling activation (310 ± 40 μA cm-2Pt, Figure 6b) was similar to that of Pt/C (385 ± 40 μA cm-2Pt, gray bar in Figure 7b), its ≈6 times lower ECSA (11 ± 2 m2Pt g-1Pt, Figure 6a) resulted in a low ORR mass activity of only 36 ± 12 A g-1Pt (Figure 6b) compared to the as-received commercial 20%wt Pt/C catalyst (270 ± 5 A g-1Pt, gray bar in Figure 7b). In the course of activation by potential cycling, a clear increase of the specific, as well as of the mass activity of PtxY/C was observed. The maximum activity was obtained for an upper cycling limit of 1.2 or 1.3 VRHE, where the slight increase in the ECSA to 14 ± 2 m2Pt g-1Pt, along with a significant increase in the specific ORR activity to 740 ± 170 μA cm-2Pt resulted in a mass activity of 106 ± 35 A g-1Pt. It is well known in the literature that bimetallic alloys of Pt and other transition metals (e.g., Co, Ni, Cu) tend to form a Pt-enriched shell on an alloy core when exposed to repeated voltammetric oxidation/reduction cycles.38 Accordingly, the initial increase of ispec0.9 V and imass0.9 V is likely due to a combination of cleaning of the surface from contaminants originating from the synthesis procedure and of surface restructuration of the nanoparticles to form a Pt-enriched overlayer. Even though the ECSA remained reasonably constant when cycling to 1.4 VRHE, the specific and mass activity of the PtxY/C catalyst decreased due to leaching of Y from the catalyst particles, indicated by the above discussed shift in the intensity of the CO oxidation features in Figure 4b. Since the activity after cycling to 1.2 or 1.3 VRHE was comparable, activation of all catalysts described further on in this manuscript was carried out by 50 potential cycles with an upper potential limit of 1.2 VRHE in order to avoid extended exposure of the carbon support to high anodic potentials and yttrium leaching.
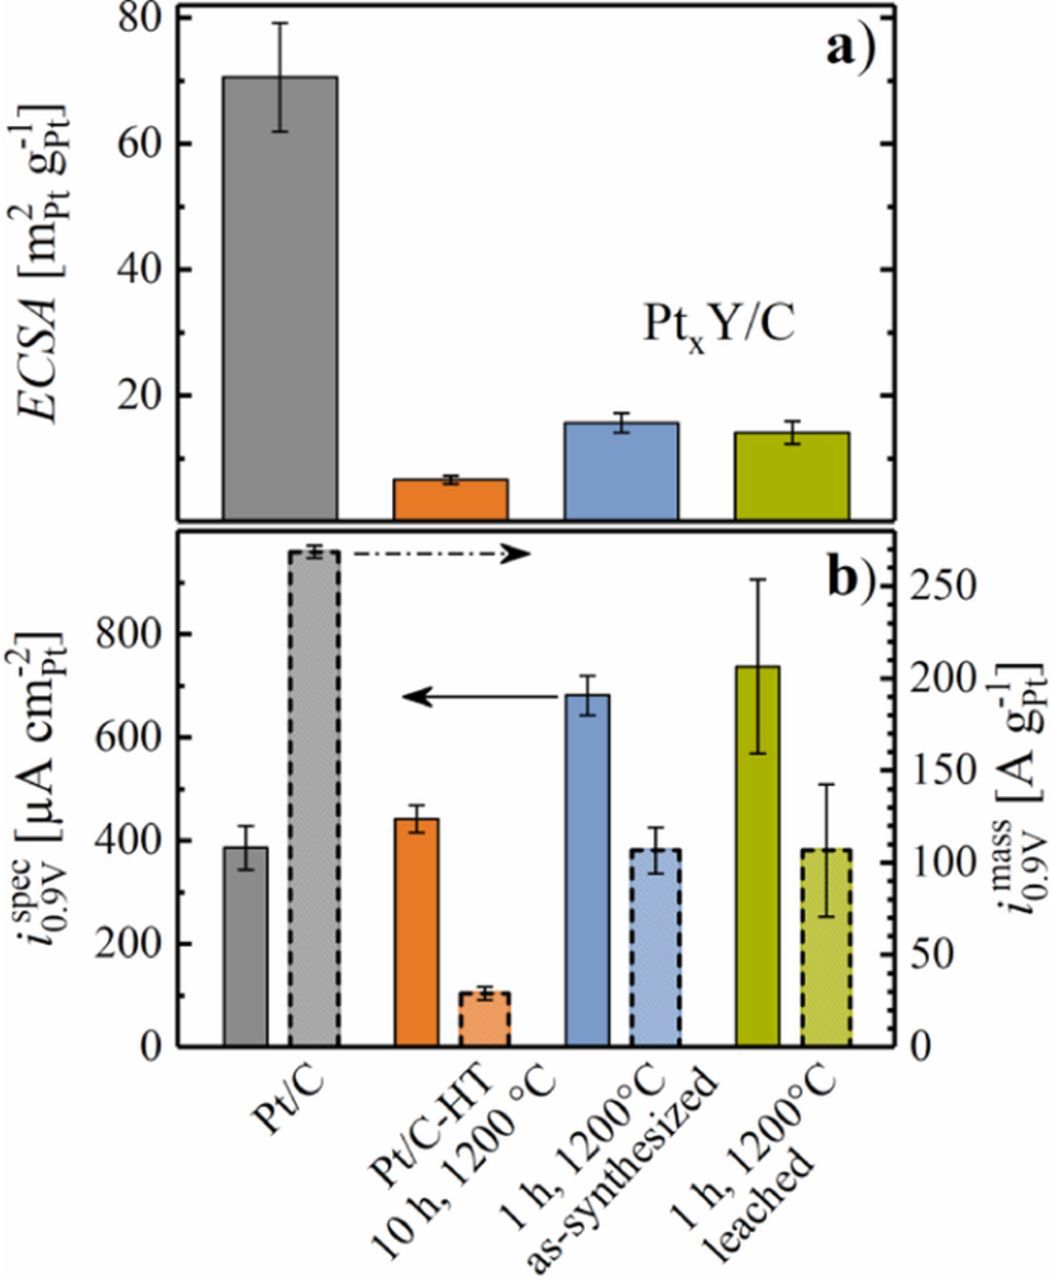
Figure 7. a) ECSA of Pt/C, Pt/C-HT, as-synthesized and leached PtxY/C after activation by 50 potential cycles between 0.05 and 1.20 VRHE at 50 mV s−1 and 25°C, evaluated from CO stripping in RDE, using a specific charge of 420 μC cm−2. b) Specific ORR activity (bars with solid lines, left y-axis) and ORR mass activity (bars with dashed lines, right y-axis) at 0.9 VRHE. Error bars represent the standard deviation of at least 2 independent measurements.
Figure 7 shows a comparison of the ECSA (Figure 7a) and the ORR activity (Figure 7b) for PtxY/C (as-synthesized, blue), PtxY/C (leached, green), commercial 20%wt Pt/C (gray), and the heat treated Pt/C-HT (orange). As already indicated, the particle size (c.f., Figure 3) of the PtxY/C catalyst is relatively large, resulting from the high synthesis temperature necessary to achieve the complete reduction of YCl3 and alloying of the two metals. Therefore, both the leached and the as-synthesized catalyst show a significantly smaller ECSA compared to Pt/C (70 ± 10 m2Pt g-1Pt), which is comprised of Pt nanoparticles with an average diameter of ≈3 nm.17 Similar to the PtxY/C catalysts, the ECSA of Pt/C-HT was very low (7 ± 1 m2Pt g-1Pt), reflecting a similarly dramatic particle growth.
While the particle growth upon heat-treatment of Pt/C triggered a moderate increase in the specific ORR activity of this catalyst from 385 ± 40 μA cm-2Pt to 440 ± 30 μA cm-2Pt (gray vs. orange bars in Figure 7b), as one would expect from the literature,39 the introduction of yttrium leads to a significant enhancement of the specific ORR activity of the as-synthesized PtxY/C catalyst (680 ± 40 μA cm-2Pt, blue bars in Figure 7b). As expected, chemical pre-treatment in sulfuric acid did not alter the catalytic properties of PtxY/C significantly (740 ± 170 μA cm-2Pt, green bars in Figure 7b), since all catalysts had been subjected to potential cycling in the acid electrolyte for these RDE experiments, where leaching of yttrium does not negatively affect performance (in contrast to what one would expect in an MEA, where the proton inventory is limited). In summary, a clear beneficial effect for the introduction of yttrium to Pt/C regarding ispec0.9 V was identified in this study, but the small ECSA of PtxY/C resulted in a low imass0.9 V (106 ± 35 A g-1Pt for the leached catalyst) compared to the commercial Pt/C catalyst (270 ± 5 A g-1Pt); on the other hand, imass0.9 V of the PtxY/C catalyst is substantially larger if compared to the Pt/C-HT catalyst with similarly large particles (30 ± 4 A g-1Pt, orange bar in Figure 7b).
The superior specific ORR activity of PtxY/C is similar to that reported by Brandiele et al., whereas this group reported additionally an approximately 3x higher ORR mass activity compared to Pt/C due to a smaller average particle size (≈5 nm) resulting from a significantly lower reaction temperature of 600°C compared to our study.7 The PtxY/C catalyst presented by Roy et al. showed a similar improvement of the specific ORR activity over Pt/C, with a slightly improved ORR mass activity.8 As a comparison, the data from the literature and from this study is summarized in Table I. While the enhancement factor of the specific ORR activity is very similar in all cases, the absolute values deviate significantly. This is partially due to the utilization of different scan rates, since higher scan rates lead to higher current densities at 0.9 VRHE.37 Furthermore, the referenced data was not corrected for capacitive effects, which becomes increasingly relevant at high scan rates.
Table I. Characteristic data for PtxY/C catalysts, including heat-treatment temperature (T) and time (t), number-averaged particle size ( ), ECSA, i spec0.9 V, i mass0.9 V, and the enhancement factor of the specific ORR activity (fspec) and ORR mass activity (fmass) compared to the Pt/C reference. The data from this study represents the leached PtxY/C catalyst, activated by 50 cycles between 0.05 and 1.20 VRHE at 50 mV s−1 and measured in O2-saturated 0.1 M HClO4 at 25°C, 10 mV s−1 and 1600 rpm. The data was corrected for the ohmic drop, for capacitive effects and for the depletion of O2. Brandiele et al. recorded the data at 20 mV s−1 and Roy et al. used 50 mV s−1.
| T | t |  |
ECSA | i spec0.9 V | fspec | i mass0.9 V | fmass | |
|---|---|---|---|---|---|---|---|---|
| Source | °C | h | nm | m2Pt g-1Pt | μA cm-2Pt | - | A g-1Pt | - |
| This study | 1200 | 1 | 12 | 14 ± 2 | 740 ± 170 | 1.9 | 106 ± 35 | 0.4 |
| Brandiele et al.7 | 600 | 5 | 4 | 33 | 1570 | 1.7 | 586 | 2.9 |
| Roy et al.8 | 800 | 6 | 12 | 21 | 2000 | 2.0 | 410 | 1.5 |
Even though the low mass activity of the PtxY/C catalyst appears to be disadvantageous, the large particle size is expected to provide a superior stability when exposed to a voltage-cycling AST in a PEMFC.
Voltage-cycling stability and performance of PtxY/C in a PEMFC
The commercially available 20%wt Pt/C catalyst, the heat treated Pt/C-HT catalyst, and the leached PtxY/C catalyst were tested in 5 cm2 MEAs with respect to their stability over 30000 triangular potential scans at 50 mV s−1 between 0.6 and 1.0 VRHE under H2/N2 flows (200 nccm/75 nccm) at the anode/cathode at 100 kPaabs, 80°C, and 100% RH, following a previously published procedure.17 Note that MEA tests were only carried out with leached catalysts in order to avoid ionic contamination of the ionomer/membrane. The ECSA was determined by CO stripping for PtxY/C and Pt/C-HT, since this yields a more reliable estimate of the ECSA for small electrode rf values, and since the correlation between ECSA and HUPD charge is not clear for PtxY alloys.
Figure 8 shows the ECSA evolution over the course of extended voltage-cycling, either in terms of absolute ECSA values (Figure 8a) or normalized to the maximum ECSA value recorded for each catalyst (Figure 8b). For PtxY/C and Pt/C-HT, an activation procedure consisting of 50 potential cycles between 0.07 and 1.20 VRHE (based on the above described experiments in liquid electrolyte; the lower potential limit was increased by 20 mV to limit the hydrogen evolution reaction (HER) current and the temperature was raised to 40°C) was applied after having executed an initial voltage-controlled MEA conditioning procedure (see Experimental section); the commercial Pt/C catalyst was only subjected to the ramp-in procedure. First of all, the large difference in particle size of the catalysts is reflected in their respective ECSA. Compared to the as-received Pt/C catalyst (68 ± 1 m2Pt g-1Pt, after conditioning, Figure 8a, gray circles), the ECSA after heat-treatment at 1200°C in 5% H2 (Pt/C-HT) was significantly lower at BOT (7 ± 1 m2Pt g-1Pt, Figure 8a, orange circles), which agrees well with the values obtained in liquid electrolyte (7 ± 1 m2Pt g-1Pt, Figure 7a). Note that both MEA conditioning and activation by 50 cycles between 0.07 and 1.20 VRHE had no influence on the ECSA of the Pt/C-HT catalyst. The ECSA of the PtxY/C catalyst at BOT (12 ± 1 m2Pt g-1Pt), as well as its increase to 16 ± 1 m2Pt g-1Pt, observed after the MEA conditioning procedure (potential holds between OCV and 0.6 V) match well with the above reported trend of increasing surface area upon catalyst activation in RDE experiments (13 ± 2 m2Pt g-1Pt after cycling between 0.05 and 1.00 VRHE). This initial surface area increase upon MEA conditioning could, in principle, be attributed to the following phenomena: i) a better catalyst layer utilization (e.g., due to water release during ORR); ii) the cleaning of the catalyst surface from adsorbates/impurities; and/or, iii) partial restructuration of the bimetallic surface. However, as no ECSA increase was observed for Pt/C-HT, the ECSA gain upon MEA conditioning of the PtxY/C catalyst is most likely related to the latter two effects. Since the cathode ECSA of PtxY/C did not further increase after the voltammetric cycling activation, we conclude that the MEA conditioning procedure is sufficient to completely activate the PtxY/C catalyst. Nevertheless, even though this suggests that no additional catalyst activation by potential cycling to 1.2 VRHE would be necessary for PtxY/C, the later discussed CO stripping voltammetry analysis will show that the surface composition of the PtxY alloy still changes significantly upon cycling activation.
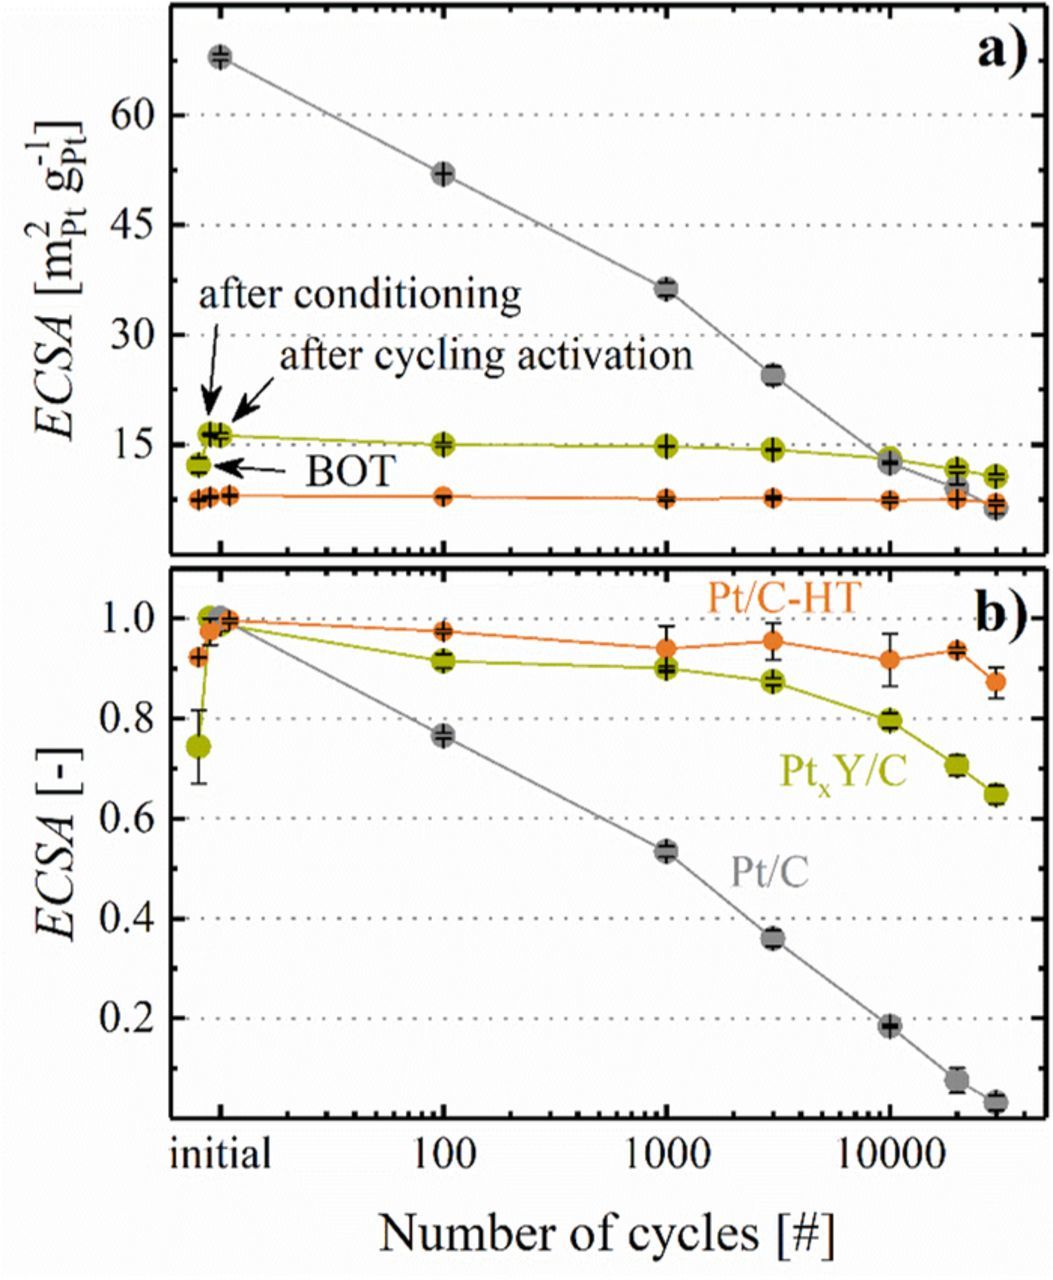
Figure 8. a) Absolute and b) normalized cathode ECSA for all tested MEAs over the course of a voltage-cycling AST, determined by CO stripping for leached PtxY/C (green circles) and heat treated Pt/C-HT (orange circles); the ECSA development for the commercial 20%wt Pt/C (gray circles) was taken from Harzer et al.17 AST conditions: triangular potential scan between 0.6 and 1.0 VRHE at 50 mV s−1, conducted under H2/N2 flows (200 nccm/75 nccm) at the anode/cathode at 100 kPaabs, 80°C, and 100% RH. The cathode Pt loadings were 0.12 mgPt cm−2 (± 5%) for the PtxY/C and Pt/C-HT cathodes and 0.10 mgPt cm−2 (± 5%) for the Pt/C cathodes; error bars represent the mean absolute deviation of two independent measurements. "BOT" refers to the ECSA values obtained prior to MEA conditioning, and "after cycling" refers to the ECSA values obtained after MEA conditioning (see Experimental section) and after 50 voltage cycles at 50 mV s−1 between 0.07 and 1.20 VRHE at 40°C.
Over the course of the voltage-cycling AST, the ECSA of the commercial 20%wt Pt/C catalyst decreased rapidly due to Ostwald ripening and Pt loss into the ionomer phase,40 leaving less than 5% of the initial ECSA after 30000 cycles (s. Figure 8b). As one would expect based on their large particle size (s. Figure 3), the surface area retention of Pt/C-HT and PtxY/C over 30000 voltage cycles is substantially better, owing to the higher stability of large particles towards Pt dissolution.41 We hypothesize that the relatively stronger ECSA loss of the PtxY/C catalyst (≈35%) compared to the Pt/C-HT catalyst (≈15%) over 30000 cycles mainly results from the lower initial ECSA of Pt/C-HT. Therefore, the ECSA loss data in Figure 8b do not provide any evidence for a superior stability of PtxY alloys compared to pure Pt, which previously had been proposed by Greeley et al.,5 whose calculations indicated a high stability of PtxY alloys due to their beneficial electronic interaction.
To further investigate the properties of the catalyst surface upon MEA conditioning and cycling activation, CO stripping was performed at BOT and after selected intervals of the voltage-cycling AST for Pt/C-HT and PtxY/C. The CO stripping voltammograms are shown in Figure 9, separated into different activation/aging intervals. Figure 9a shows a single CO stripping peak for the PtxY/C catalyst at BOT (red line) with a current peak at 0.8 VRHE, which is in good agreement with the CO stripping peak position of the Pt/C-HT catalyst at BOT (orange line). In accordance with the CO stripping measurements performed in liquid electrolyte (Figure 4b), the CO stripping peak of PtxY/C separates into two distinct peaks after MEA conditioning (green line in Figure 9a), with maxima at 0.73 and 0.81 VRHE (vs. 0.69 and 0.80 VRHE in Figure 4b; note that these lower CO stripping potentials are likely due to the slower scan rate of 10 mV s−1). The analysis shows that at least a few voltage cycles that are part of the MEA conditioning procedure (see Experimental) are required to clean and restructure the surface of the PtxY/C catalyst to approach the steady-state surface properties of the PtxY/C alloy. As discussed earlier, the identification of the exact origin of the single CO stripping peak at BOT is not trivial, but we hypothesize that it is caused by residual contaminations from the synthesis. This hypothesis is supported by the fact that the CO stripping peak of the Pt/C-HT catalyst at BOT occurs at the same peak position, but does not separate into two individual peaks after the activation procedure or upon voltage-cycling (data not shown, but analogous to those in Figure 4c).
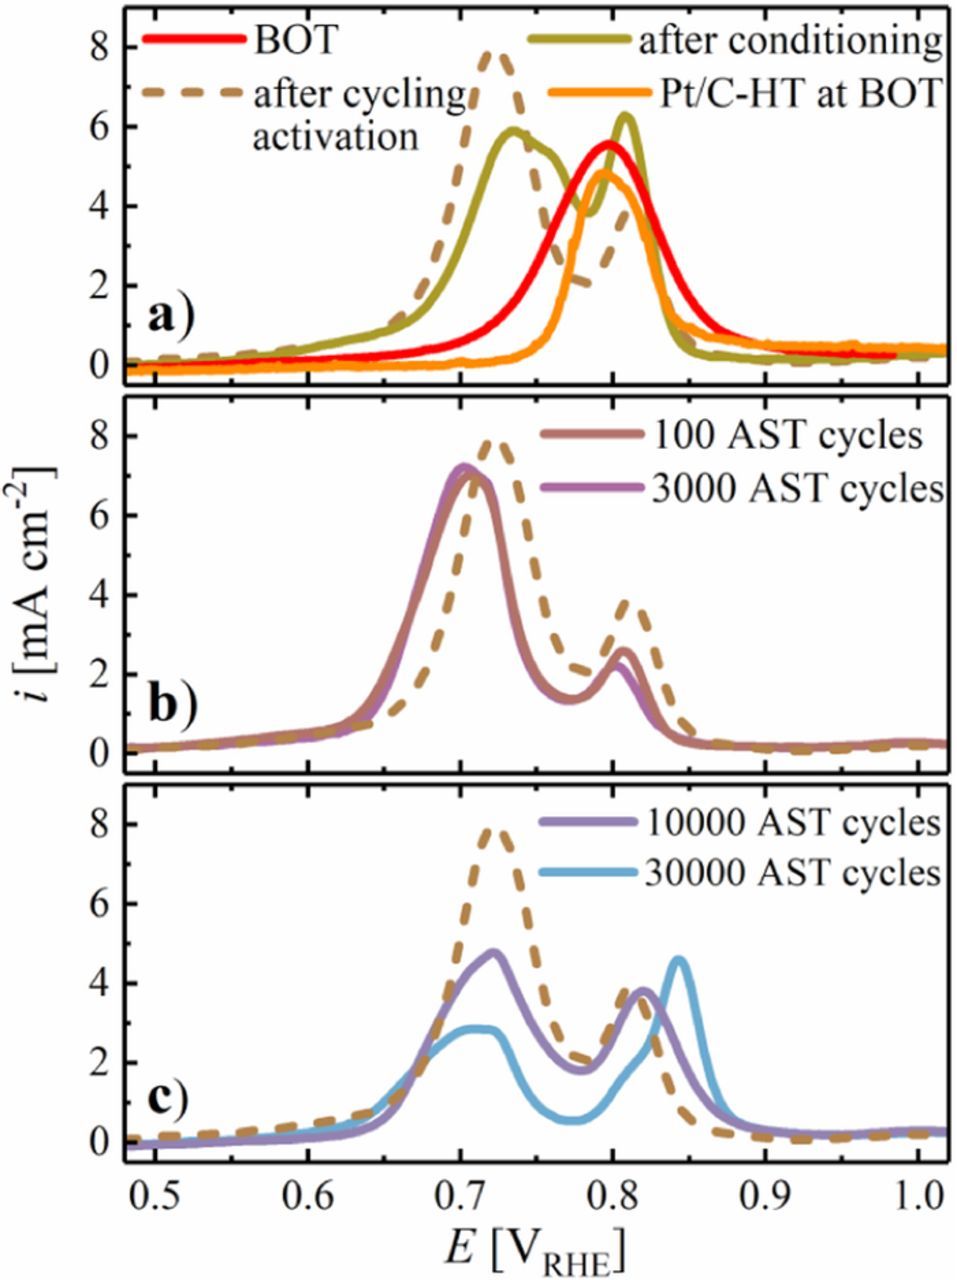
Figure 9. a) Baseline-corrected CO stripping voltammograms of the leached PtxY/C catalyst in 5 cm2 MEAs at BOT, after MEA conditioning by a voltage-controlled ramp-in procedure, and after catalyst cycling activation (50 cycles at 50 mV s−1 between 0.07 and 1.20 VRHE at 40°C) compared to Pt/C-HT at BOT. b-c) CO stripping voltammograms of the PtxY/C catalyst after different numbers of voltage-cycles throughout the voltage-cycling AST shown in Figure 8, with the CO stripping voltammogram of the cycling activated PtxY/C catalyst plotted for reference (brown dashed line). CO stripping was performed at 100 mV s−1 with an upper potential limit of 1.1 VRHE at 40°C and 150 kPaabs, whereby CO (10% in N2) was adsorbed for 10 min at a flow rate of 100 nccm while holding the cathode potential at 0.1 VRHE.
After cycling activation of the PtxY/C catalyst (50 cycles at 50 mV s−1 between 0.07 and 1.20 VRHE at 40°C), the overall ECSA remained constant (Figure 8), but the ratio of the two peaks changed in favor of the peak at low potentials (dashed brown line in Figure 9a). Similar to the measurements performed in liquid electrolyte (Figure 4b), this trend indicates a restructuration of the catalyst surface. This hypothesis is supported later on by an increase in the PtxY/C ORR mass activity. The relative ratio of these two CO stripping peaks after cycling activation remains essentially constant over the initial 100 and 3000 AST voltage cycles (Figure 9b), during which also the ECSA remains constant (see Figure 8). After 10000 and 30000 AST cycles which are accompanied by a significant loss of ECSA compared to 3000 cycles (see Figure 8), the relative intensity of the CO stripping peak at higher potential gradually increases again compared to that at lower potential (Figure 9c). As described earlier for the CO stripping peaks in liquid electrolyte, we hypothesize that these changes originate from leaching of yttrium due to a certain degree of voltage-cycling induced dealloying.
PEMFC performance after a voltage-cycling AST
The Tafel representation of the differential flow H2/O2 polarization curves at 80°C, 100% RH, 170 kPaabs before and after 30000 AST cycles are shown in Figure 10, whereby the following corrections to the measured current and voltage were made (for details see Orfanidi et al.):34 i) correction of the current for the H2 crossover current (≈5 mA cm−2) and the shorting current (corresponding to a resistance of ≈6 kΩ cm2), determined at the same conditions with N2 on the cathode; ii) subsequently, the current was normalized to the mass of platinum in the cathode catalyst layer; iii) correction of the measured voltage for the HFR representing the ohmic resistance of the membrane and electric contact resistances; and, iv) voltage correction for the effective proton conduction resistance in the cathode catalyst layer ( ), based on the proton conduction resistances measured by EIS (
 values were 31 ± 11 mΩ cm2 for Pt/C, 34 ± 6 mΩ cm2 for Pt/C-HT, and 38 ± 4 mΩ cm2 for PtxY/C).
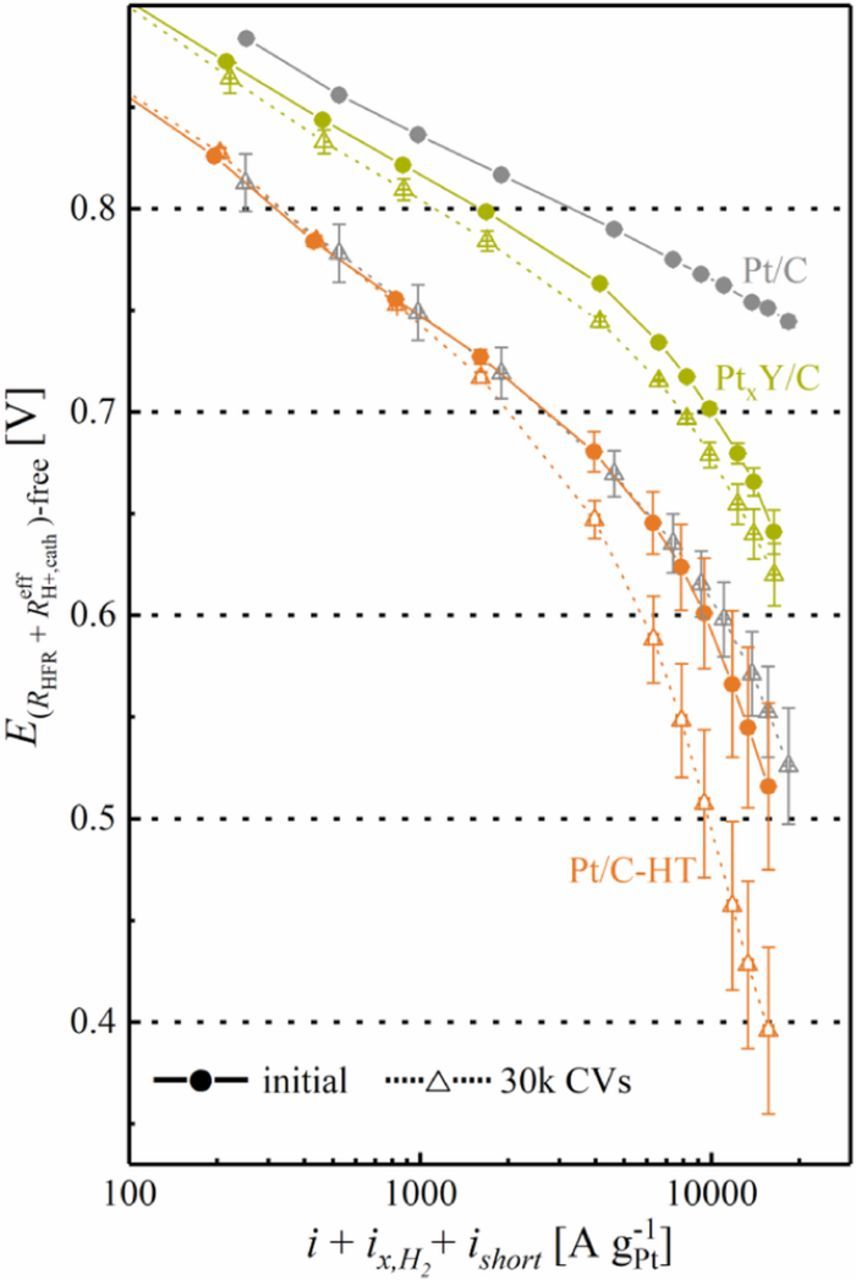
Figure 10. Tafel representation of the H2/O2 polarization curves of 5 cm2 MEAs based on cathodes with the leached PtxY/C and the heat treated Pt/C-HT catalysts (at Pt loadings of 0.12 mgPt cm−2) after MEA conditioning and cycling activation (solid lines and full symbols) and after 30000 AST cycles (dashed lines and open symbols); the data points for the commercial 20%wt Pt/C catalyst (gray color; Pt loading of 0.10 mgPt cm−2) were taken from Harzer et al.17 The current was first corrected for hydrogen crossover and electrical shorting currents, and then normalized to the mass of platinum in the cathode catalyst layer. The voltage was corrected for the ohmic resistance (RHFR) and the effective proton conduction resistance ( ). Error bars represent the mean absolute deviation of two independent measurements. AST conditions: triangular potential scan between 0.6 and 1.0 VRHE at 50 mV s−1, conducted under H2/N2 flows (200 nccm/75 nccm) at the anode/cathode at 100 kPaabs, 80°C, and 100% RH. Polarization curve conditions: H2/O2 (2000/5000 nccm), 80°C, 100% RH, and 170 kPaabs.
Solid lines/symbols represent the performance after MEA conditioning and cycling activation between 0.07 and 1.20 VRHE for the Pt/C-HT (orange) and the PtxY/C (green) based cathodes; cathodes with commercial 20%wt Pt/C catalyst (gray) were solely conditioned. Prior to the AST, the voltage profile of the commercial Pt/C cathodes in Figure 10 follows a straight line with a Tafel slope of 70 ± 1 mV dec−1 throughout the entire measurement range. On the other hand, the cathodes with heat treated Pt/C-HT have a substantially lower performance even at low current density, dropping dramatically with increasing current density and not following a straight line of corrected voltage vs. the logarithm of the current density (the apparent Tafel slope being ≈107 ± 9 mV dec−1 between 50–200 mA cm−2, corresponding to approximately 500–2000 A g-1Pt), which we attribute to non-Fickian oxygen transport resistance losses due to the low rf value of the Pt/C-HT cathodes.1,17 In comparison, the PtxY/C cathodes show significantly lower ORR overpotentials, but they also do not display a straight Tafel line, even though the apparent Tafel slope at low current densities of ≈84 ± 8 mV dec−1 (taken between 50–200 mA cm−2) is now much closer to the ideally expected value of ≈70 mV dec−1. We mainly attribute the apparently lower oxygen transport resistance for PtxY/C compared to Pt/C-HT to the higher ECSA and the faster ORR kinetics of the former.
The Pt/C catalyst based cathodes degraded strongly over the 30000 AST cycles, resulting in an end-of-test (EOT) performance which is similar to that of the Pt/C-HT based cathodes prior to the AST. However, in contrast to the strong degradation of Pt/C based cathodes, cathodes composed of Pt/C-HT retain most of their initial performance at EOT (see Figure 10), consistent with their minor ECSA loss over the course of the AST (Figure 8). Similarly, the PtxY/C based cathodes show only a slight deterioration at EOT, whereas the higher ORR kinetics of this catalyst results in a significantly higher EOT performance compared to Pt/C-HT. It is especially noteworthy that the EOT performance of PtxY/C is significantly superior compared to that of the commercial Pt/C catalyst. This indicates that the most advantageous catalyst would be an alloy catalyst with high specific ORR activity and with an ECSA that is high enough to avoid large non-Fickian oxygen transport resistances and low enough to prevent excessive ECSA loss over extended voltage-cycling.
The ORR mass and specific activity of the catalysts were determined from an extrapolation of linear regression lines between 50 and 200 mA cm−2 (corresponding to 500–2000 A g-1Pt) to 0.9 VRHE from the H2/O2 data shown in Figure 10. Artifacts resulting from oxygen transport resistances at high current density can thereby largely be avoided, even though it should be noted that the determination of the ORR activity becomes increasingly more inaccurate for cathode catalyst layers with low rf values and/or low ORR activity (e.g., for Pt/C-HT at ≥10000 AST cycles), in which case the linear regression lines have to be extrapolated over almost one order of magnitude of current.
The ORR specific activity of all catalysts displayed in Figure 11b shows a similar trend, namely an approximately 1.5-2x increase from the beginning of the voltage-cycling AST to EOT (e.g., i spec0.9 V for the PtxY/C catalyst increased from 625 ± 45 μA cm-2Pt to 800 ± 170 μA cm-2Pt). While the enhancement of the commercial Pt/C catalyst is mainly due to the growth of the Pt particles, the formation of a Pt-enriched shell upon voltage-cycling is an additional reason for an increase of the specific ORR activity of PtxY/C. It shall be noted that the quantification of the ORR mass activity of Pt/C-HT is compromised by the high apparent Tafel slope. On the other hand, the catalysts behave differently with regards to the ORR mass activity (Figure 11a). For the commercial Pt/C based cathodes, it decreases significantly in the course of the AST, which can be ascribed to the dramatic loss of ECSA, described in more detail in a previous publication.17 A different trend is observed for the heat treated Pt/C-HT based cathodes, whose ORR mass activity actually increases over the course of 30000 AST cycles. For this catalyst, the ORR mass activity after MEA conditioning (10 ± 2 A g-1Pt, see first orange data point in Figure 11a) increases substantially upon cycling activation (to 36 ± 6 A g-1Pt, see first orange data point in Figure 11a), which we ascribe to a cleaning of the platinum surface, analogous to the albeit much smaller voltage-cycling induced activation seen for the Pt/C catalyst after 100 AST cycles from 0.6 to 1.0 VRHE. Finally, the ORR mass activity of the PtxY/C cathodes remains roughly constant over the course of the AST cycles, while they also show a strong mass activity gain upon the initial cycling activation (from 22 ± 6 A g-1Pt after MEA conditioning to 101 ± 3 A g-1Pt after the cycling activation). In this case, the cycling activation process may be understood on the basis of the CO stripping data (Figure 9b), where a significant change in the CO oxidation features is observed between MEA conditioning and cycling activation, which we ascribe to a surface reconstruction in the PtxY alloy phases. Important to note is the fact that the ORR mass activity of the PtxY/C catalyst is approximately two times higher than that of the conventional Pt/C after 30000 AST cycles. This proves the beneficial effect of incorporating yttrium into the carbon supported platinum catalyst, as its higher specific ORR activity enables the utilization of larger nanoparticles, eventually providing a significantly higher stability for PEMFC cathodes.
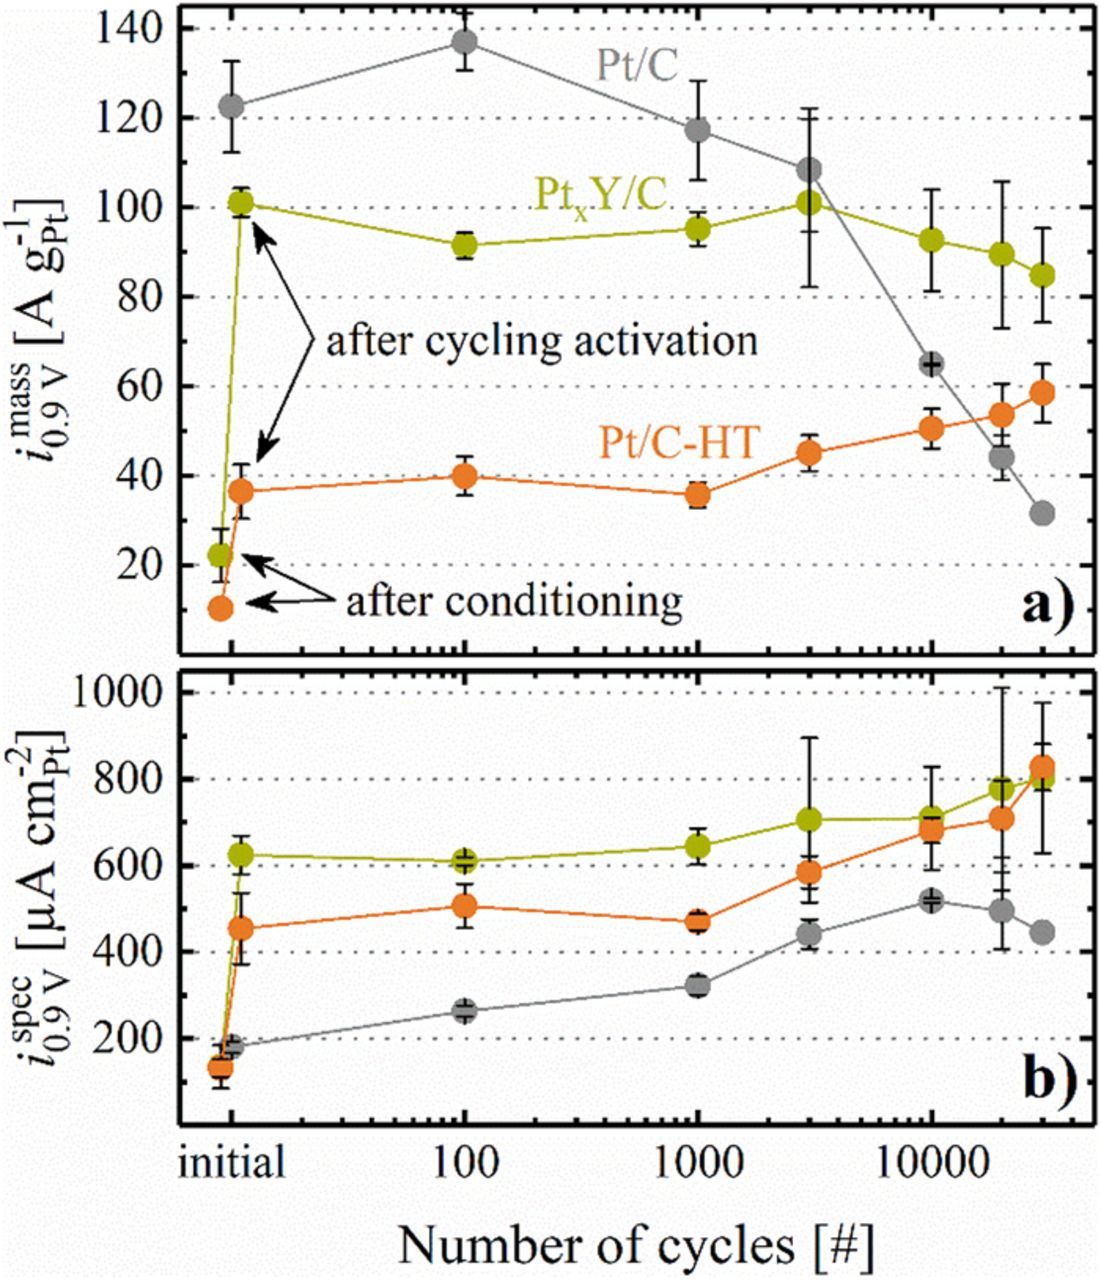
Figure 11. a) ORR mass activity (i mass0.9 V) determined by extrapolation of a linear regression between 50–200 mA cm−2 (corresponding to 500–2000 A g-1Pt) to 0.9 VRHE from the H2/O2 data. b) Specific ORR activity (i spec0.9 V) obtained from i mass0.9 V and the ECSA shown in Figure 8. Note that the thus determined ORR activities are referenced to an O2 partial pressure of 123 kPaabs rather than to the frequently used reference value of 100 kPaabs (the latter can be obtained by multiplying the former with 0.78).34 Error bars represent the mean absolute deviation of two independent measurements. For PtxY/C and Pt/C-HT, the first data point was taken after MEA conditioning and the second data point (both indicated by arrows) was recorded after cycling activation (50 cycles between 0.07 and 1.20 VRHE at 50 mV s−1 and 40°C). The first data point for the commercial 20%wt catalyst was taken after MEA conditioning and no cycling activation was carried out.
Finally, the performance of the three different catalysts in H2/O2 was complemented by recording differential flow polarization curves in H2/air (at 170 kPaabs, 80°C, and 100% RH), where O2 mass transport related properties of the catalyst layer typically become more apparent. Even though the cathode loading of the MEA consisting of commercial Pt/C was solely 0.1 mgPt cm−2, an excellent performance with a competitive current density of ≈1850 mA cm−2 at 0.6 V was observed before the voltage-cycling AST (Figure 12, solid, gray line). As shown by Harzer et al., the excellent performance of these MEAs originates from optimized mass transport properties in the cathode catalyst layer.17 In contrast, heat-treatment of this catalyst led to a significantly lower initial performance of only ≈360 mA cm−2 at 0.6 V (Figure 12, solid, orange line), which at least in part may be ascribed to the very low rf value of the Pt/C-HT cathode catalyst layer (10 ± 1 cm2Pt cm−2 compared to 72 ± 4 cm2Pt cm-2 for the commercial Pt/C) that is reported to cause a large non-Fickian oxygen transport resistance1 (for Pt/C-HT, this was  = 3.31 ± 0.16 s cm−1, measured by the limiting current method at 80°C, 170 kPaabs, 100% RH, according to our previous study;17 data not shown). However, based on its ≈3-fold lower ORR mass activity compared to Pt/C (see Figure 11a), one would only predict a kinetic ORR voltage loss of ≈33 mV (assuming an intrinsic Tafel slope of 70 mV dec−1), which is ≈3-fold smaller than the voltage difference between the Pt/C and the Pt/C-HT cathodes at 100 mA cm−2 (Figure 12), a current density where voltage losses due to non-Fickian oxygen transport resistances should be entirely negligible. Therefore, we suspect that issues related to the ionomer distribution on the catalyst surface or across the cathode electrode must be an additional factor leading to its poor H2/air performance.
Figure 12. a) Differential flow polarization curves in H2/air at 80°C, 100% RH, and 170 kPaabs before the voltage-cycling AST (solid lines and full symbols) and after 30000 AST cycles (dashed lines and open symbols) for the three catalysts tested in 5 cm2 MEAs with cathode loadings of 0.12 mgPt cm−2 for PtxY/C and Pt/C-HT and of 0.10 mgPt cm−2 for commercial 20%wt Pt/C. The error bars represent the mean absolute deviation of two independent measurements. AST conditions: triangular potential scan between 0.6 and 1.0 VRHE at 50 mV s−1, conducted under H2/N2 flows (200 nccm/75 nccm) at the anode/cathode at 100 kPaabs, 80°C, and 100% RH. b) Polarization curve for PtxY/C (black stars) predicted from the diagnostic measurements (ORR mass activity, HFR, proton conduction resistance in the cathode and O2 mass transport resistance) carried out prior to the voltage-cycling AST. The measured polarization curve for PtxY/C from a) is also plotted in b) as a reference. The gray shaded area is the difference between the two curves and resembles the unassigned voltage losses.
While the average particle size of PtxY was comparable to Pt/C-HT, resulting in a similar rf value (20 ± 1 cm2Pt cm-2), its H2/air performance was far superior, with a current density of 800 mA cm−2 at 0.6 V (Figure 12, solid, green line). Compared to the Pt/C benchmark MEA, one would expect identical ORR kinetic losses for the PtxY/C based MEA, since the product of ORR mass activity (see Figure 11a) and the platinum loading for the two MEA types predicts the same ORR kinetic current at a given geometric current density. This is reasonably closely observed up to 50 mA cm−2, but already at 100 mA cm−2 significant performance differences appear, amounting to ≈100 mV at 1 A cm−2. In part this can be ascribed to the ≈2-fold higher O2 mass transport resistance of  = 1.79 ± 0.18 s cm−1 for the PtxY/C vs. the Pt/C cathodes (0.80 ± 0.02 s cm−1),17 determined by the limiting current method prior to the voltage-cycling AST (not shown; taken at 80°C, 100% RH, and 170 kPaabs), which originates largely from the low cathode rf value. However, compared to the actually measured H2/air performance of the PtxY/C MEAs (green line in Figure 12), even this high
  value would predict a ≈2-fold higher current density at 0.6 V when using the voltage-loss model described by Harzer et al.17 The polarization curve predicted by this model is shown in Figure 12b (black stars), including all voltage loss contributions that have been determined prior to the voltage-cycling AST, namely i) the kinetic ORR overpotential (calculated for i mass0.9 V = 101 A g-1Pt (Figure 11a), ECSA = 16 m2Pt g-1Pt (Figure 8a), a loading of 0.12 mgPt cm−2, and the theoretical Tafel slope of 70 mV dec−1), ii) the ohmic drop (HFR, determined by EIS at each current density, on the order of 25 mΩ cm2), iii) the effective proton conduction loss in the cathode (using
  = 38 mΩ cm2), iv) and the estimated O2 mass-transport loss (
 = 1.79 s cm−1). Following this analysis, it is clear that the measured H2/air polarization curve exhibits significant unassigned voltage losses (e.g., 122 mV at 1 A cm−2), which could not be determined by the currently available diagnostic toolset (gray shaded area in Figure 12b). Even though significant unassigned voltage losses have been observed previously for low cathode rf values,17 we expect that the discrepancy is most likely related to MEA design parameters which affect the homogeneity of the ionomer across the catalyst surface and across the electrode,34 suggesting that further MEA optimization is required. However, the more reasonable step prior to investing into a time consuming MEA optimization process, is to improve the PtxY/C synthesis route with the aim to obtain smaller and more homogeneously alloyed particles, targeting an initial ECSA of ≈40 m2Pt g-1Pt, so that the cathode roughness factor is large enough to still have a minimal non-Fickian oxygen transport resistance at a loading of 0.1 mgPt cm−2 (as explained by Kongkanand and Mathias).1
Despite its rather poor H2/air performance prior to the AST, the performance decay of the PtxY/C based cathodes after 30000 voltage-cycles is comparably small (Figure 12, dashed, green line), significantly exceeding the H2/air performance of the commercial Pt/C catalyst at EOT. In comparison, the H2/air performance of the Pt/C-HT based MEAs decayed much more compared to PtxY/C, which we attribute to the Pt/C-HT catalyst's lower ORR mass activity as well as to its lower ECSA and the associated high non-Fickian oxygen transport resistance.
Conclusions
In this study, we showed the successful preparation of a carbon supported bimetallic Pt-Y alloy by impregnation of a commercial Pt/C catalyst with an yttrium halide precursor and subsequent heat-treatment in reductive atmosphere (1200°C for 1 h in 5% H2 in Ar). Electrochemical measurements in an RDE configuration were used to identify a suitable activation procedure by potential cycling (50 cycles at 50 mV s−1 with an upper limit of 1.2 VRHE), yielding a high specific ORR activity (740 ± 170 μA cm-2Pt), while the large average particle size (≈10 nm) resulted in a low ECSA (14 ± 2 m2Pt g-1Pt), hence a mass activity (106 ± 35 A g-1Pt) comparable to commercial Pt/C.
Furthermore, measurements in 5 cm2 single-cells provided consistent results (ECSA = 17 ± 1 m2Pt g-1Pt, i spec0.9 V = 625 ± 45 μA cm-2Pt, i mass0.9 V = 101 ± 3 A g-1Pt) with the data collected in RDE. Over the course of 30000 voltage cycles between 0.6 and 1.0 VRHE (50 mV s−1, H2/N2 flows of 200 nccm/75 nccm at the anode/cathode, 100 kPaabs, 80°C, and 100% RH), the mass activity and the ECSA of the PtxY/C catalyst showed a much better retention compared to the commercial Pt/C catalyst. However, a comparison with a heat treated Pt/C catalyst with similarly large particle size indicates that the high voltage cycling stability of PtxY/C is a particle size rather than an alloying effect.
Finally, H2/air polarization curves of MEAs with the PtxY/C catalyst showed an inferior performance to commercial Pt/C, partially originating from the low cathode rf value and most likely from MEA design parameters (e.g., ionomer distribution within the cathode). Therefore, the preparation of PtxY/C catalysts with higher ECSA (i.e., smaller particle size) and improved alloying, as well as MEA optimization are planned for future work.
Acknowledgment
The authors of this work would like to give special thanks to Umicore AG & Co. KG who supported this research financially and scientifically. The efforts by the elemental analysis laboratory at the Technical University of Munich are greatly acknowledged. Furthermore, we would like to direct our thanks to Benjamin Strehle for his expert assistance with the analysis of the XRD data and to Michele Piana for discussion of the XRD data.
ORCID
Jan N. Schwämmlein 0000-0001-8902-4508
Gregor S. Harzer 0000-0002-1830-1931