Abstract
Different kinds of composite electrode materials containing copper boron oxide Cu3B2O6 as an active component are studied in Li-ion test cells. Cu3B2O6-based electrodes are modified by incorporating 10% w/w of either single-wall/double-wall (SW/DW), multi-wall (MW) carbon nanotubes (CNTs) or reduced graphene oxide (RGO). The studies show an increase of cycling performance for all composites in comparison to the standard mixture with 10% w/w amorphous carbon. The best improvement of specific capacity is achieved for the SW/DW CNT Cu3B2O6 composite. After 30 cycles the capacity is still over 152 mAh/g in comparison to 20 mAh/g for the standard mixture. Electrochemical impedance spectroscopy reveals a significant decrease of the resistivity of the Schottky contacts in the CNTs- and RGO- composites compared to the standard mixture. This supports the conclusion that the main mechanism for the capacity improvement is related to better electronic transport properties of the composites.
Export citation and abstract BibTeX RIS
Rechargeable (secondary) lithium ion (Li-ion) batteries are widely used as energy source for mobile devices due to their favorable balance of high energy density with high power density compared to other energy storage systems.1 Higher capacities can be achieved by using multielectron electrochemical conversion reactions. The conversion mechanism relies on an access of all oxidation states during the redox reaction, down to the metallic state.2 Transition 3d metal oxides are already applied as electrodes for non-rechargeable and secondary Li-ion batteries with LiPF6 in EC/DMC as electrolyte.3 Transition metal borate (TMBO) electrodes are proposed to minimize the formation of LiF on the electrode surface, which appears due to the electrolyte salt decomposition and side reactions of hydrogen fluoride. HF can be formed in the cell due to presence of traces of water, with highly reactive Li2O. A formation of more inert lithium boron oxide instead of Li2O is expected to prevent the reaction with HF and successive decomposition of electrolyte components. However, conversion-type electrodes suffer from poor cycling performance. The major reason for this is the poor electronic transport in the converted state.4 The main challenge to optimize TMBO for application is to overcome this limitation.
Many other electrode materials, including intercalation materials, are investigated with respect to improve the electrochemical performance. A good example is LiFePO4, to which several methods of the electronic transport improvement were already successfully applied: carbon coating,5,6 metal doping,7,8 and particle size reduction.9,10 Such modifications enhanced rate capability and cycle efficiency. Especially conductive additives like carbon nanotubes (CNTs) proved to have a significant impact on the performance. Applying such modifications to conversion electrodes is challenging due to the comprehensive structural changes occurring already during the first electrochemical cycle.
In this work, two methods for the improvement of the electronic transport of the Cu3B2O6 electrode material were applied. The first method introduces composites consisting of different kinds of carbon nanotubes. In the second method, the copper borate material was modified by a reduced graphene oxide. The electrochemical lithium storage performance is investigated and differences in electrochemical properties are discussed based on the reasons for the obtained enhanced electronic properties.
Experimental
Synthesis of Cu3B2O6
Cu3B2O6 was prepared by a solid-state reaction of copper (II) oxide (CuO 99.995%, Alfa Aesar) and boric acid (H3BO3 ultrapure, Ventron) at 900°C in a muffle furnace. After 24 h, the material was reground, pressed to pellets and heated for another 24 h.4 X-ray powder diffraction revealed a single phase product of Cu3B2O6. This phase crystallizes in a triclinic structure with the P-1 space group.11 The structure parameters were refined by the Rietveld method using FullProf program:12 a = 3.3590(2) Å, b = 19.6674(8) Å, c = 19.6577(8) Å, α = 88.821(3)°, β = 69.718(3)°, γ = 70.051(3)°.
CNTs-Cu3B2O6 composites
The syntheses of the single-wall/double-wall (SW/DW) and multi-wall CNTs without high-temperature treatment (MW no-HT) and with high-temperature treatment (MW HT) were performed using catalytic chemical vapor deposition (CVD)13 and the fixed bed method.14
In the case of SW/DW carbon nanotubes, a mixture of Co-Mo-Mg oxides in the molar ratio Co:Mo:Mg = 4:0.8:95.2 was used as a solid catalyst material. The CNTs synthesis was started by injection of methane (CH4) into the reactor at the temperature of 880°C for 30 minutes. A mixture of SW/DWs and catalyst support was obtained. In order to get pure CNTs (no MgO) the as grown material was washed in HCl.
For synthesis of multi-walled carbon nanotubes (MW no-HT and MW HT) a mixture of oxides Fe:Mo:Mg = 0.18:0.03:0.79 was used as solid catalyst. The synthesis was performed with ethylene (C2H4) as C-precursor at 700°C for 60 min. In this case, no purification with HCl was necessary. A high temperature treatment of MW HT CNTs was applied in argon at 2800 K for 60 min to eliminate any defects in the nanotubes. After this annealing process, Fe catalyst particles were found to be completely evaporated out of the carbon nanotubes.
The fourth kind of the multi-wall carbon nanotubes (MW Ac) was synthesized by the aerosol-assisted CVD method.15 This method is based on a decomposition of a solution consisting of a liquid hydrocarbon source (acetonitrile) and a vapourable catalyst compound (ferrocene). The solution was nebulized to an aerosol by an ultrasonic generator and then injected with a support of a carrier gas mixture of argon and hydrogen into the CVD reactor at 800°C. The CNTs adhering at the internal surface of quartz tubes was done easily without any wet-chemical assistance.
The surfaces of the carbon nanotubes were characterized by X-ray photoelectron spectroscopy (XPS). In the SW/DW, MW Ac, MW no-HT carbon nanotubes, besides carbon, an oxygen in concentrations between 1–3 at% was detected. The MW HT CNTs exhibit a very pure carbon shell and are oxygen free. The electrical resistivity of the CNTs was determined at room temperature by the 4-point probe method on samples pressed into pellets. The following electrical conductivities were derived: 19 S/cm for CNT SW/DW, 83 S/cm for CNT MW Ac, 53 S/cm for CNT MW no-HT, and 28 S/cm for CNT MW HT.
The preparation of the composites was performed by 30 min. ultrasonication of Cu3B2O6 and an applicable amount of CNTs in a solvent, followed by drying in vacuum at 100°C for 3 days. Two types of solvents with different polarity were used to elucidate their influence on the preparation efficiency. Bi-distilled water with ɛ = 80.1 at 20°C16 was chosen as a more polar solvent, while n-heptane (Alfa Aesar, 99%) with ɛ = 1.92 at 20°C17 was used as a nonpolar solvent.
RGO-Cu3B2O6 composite
Graphene oxide was prepared according to the work described in.18 Afterwards it was reduced under mild conditions using L-ascorbic acid in water solution19 and stored with a concentration of 5 g L−1 in N-Methyl-2-pyrrolidone (NMP 99.5%, RDH) solution. The copper borate powder in proportion 9:1 w/w of Cu3B2O6 to RGO was added to the suspension of RGO in NMP. The new suspension was gently stirred for 12 h and then dried in a vacuum at 100°C for two days. The extracted powder was used as electrode material in the test cells.
Characterization techniques
Electrochemical experiments were controlled by a multichannel potentiostatic-galvanostatic system VMP3 (Bio-Logic, France) at the constant temperature of 298 K. The working electrode was prepared from about 10 mg of the electrode mixture pressed on a 12 mm diameter steel mesh. Then, the working electrode was dried in 373 K in vacuum for about 1 day. The reference electrode was made from a metal lithium foil (Aldrich). As electrolyte, a solution of 1 M lithium hexafluorophosphate in 1:1 mixture of an ethylene carbonate with a dimethyl carbonate was used (LP-30, Novolyte). The Swagelok test cells were assembled under argon atmosphere with H2O and O2 contents less than 1 ppm.
For ex situ investigations, the cells were disassembled in specific states of charge without contact with air or moisture. The recovered electrode material was washed by dimethyl carbonate (Aldrich) to remove any residual electrolyte traces.
X-ray photoelectron spectroscopy studies were performed with a PHI 5600 CI apparatus (Physical Electronics) equipped with a hemispherical analyzer. Monochromatic Al-Kα radiation (1486.6 eV) was used. The XPS spectrometer was calibrated by using the photoemission line C1s at 284.8 eV with respect to the Fermi level. The Cu2p peaks assignments were made with respect to the reference compounds: metallic Cu, Cu2O and CuO.
X-ray powder diffraction patterns were collected with a STOE STADI P diffractometer using Cu Kα1 radiation (λ = 1.54060 Å).
A scanning electron microscope (SEM), Leo 1530 Gemini (Zeiss/Leo), equipped with an Inlens detector, was used for the microstructural characterization.
Results and Discussion
Morphology characterization of the composites
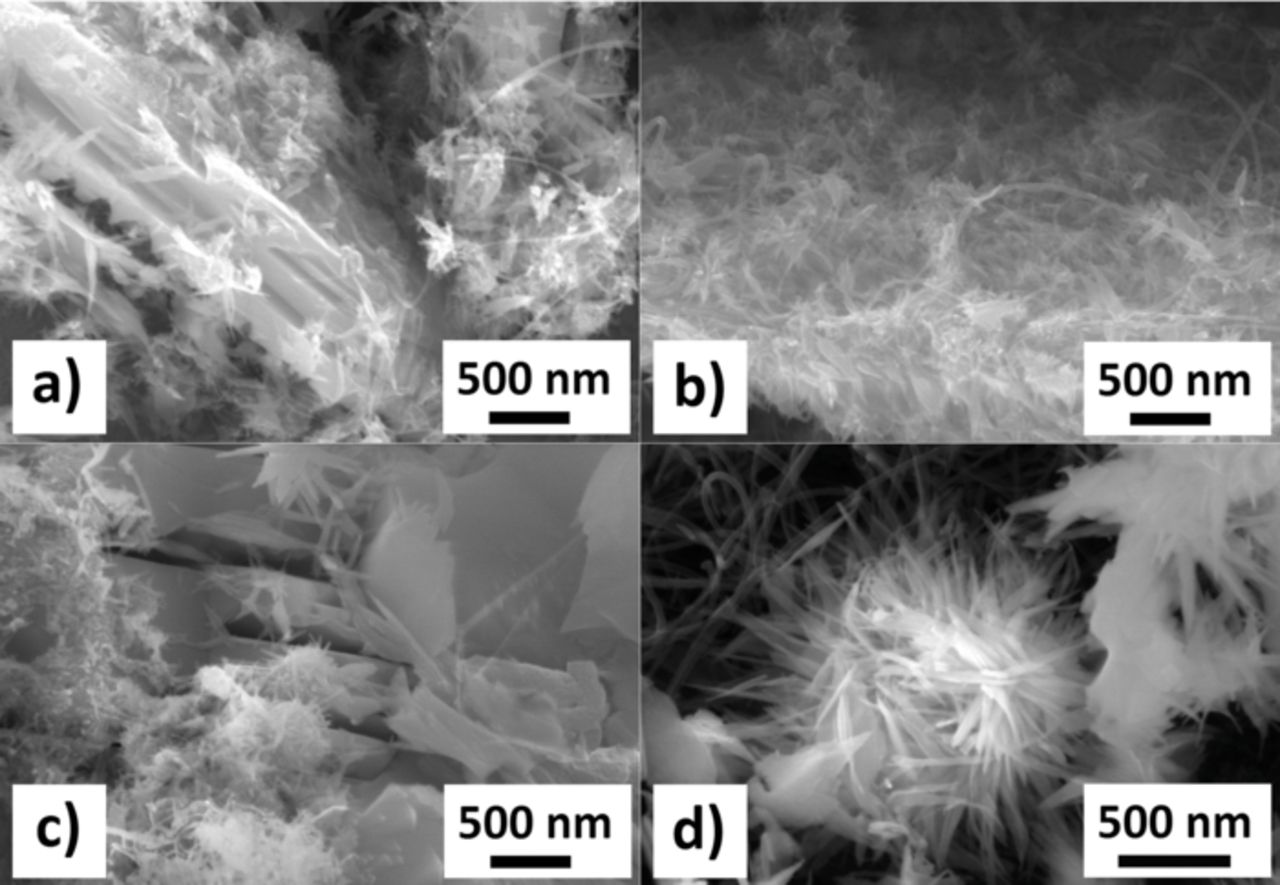
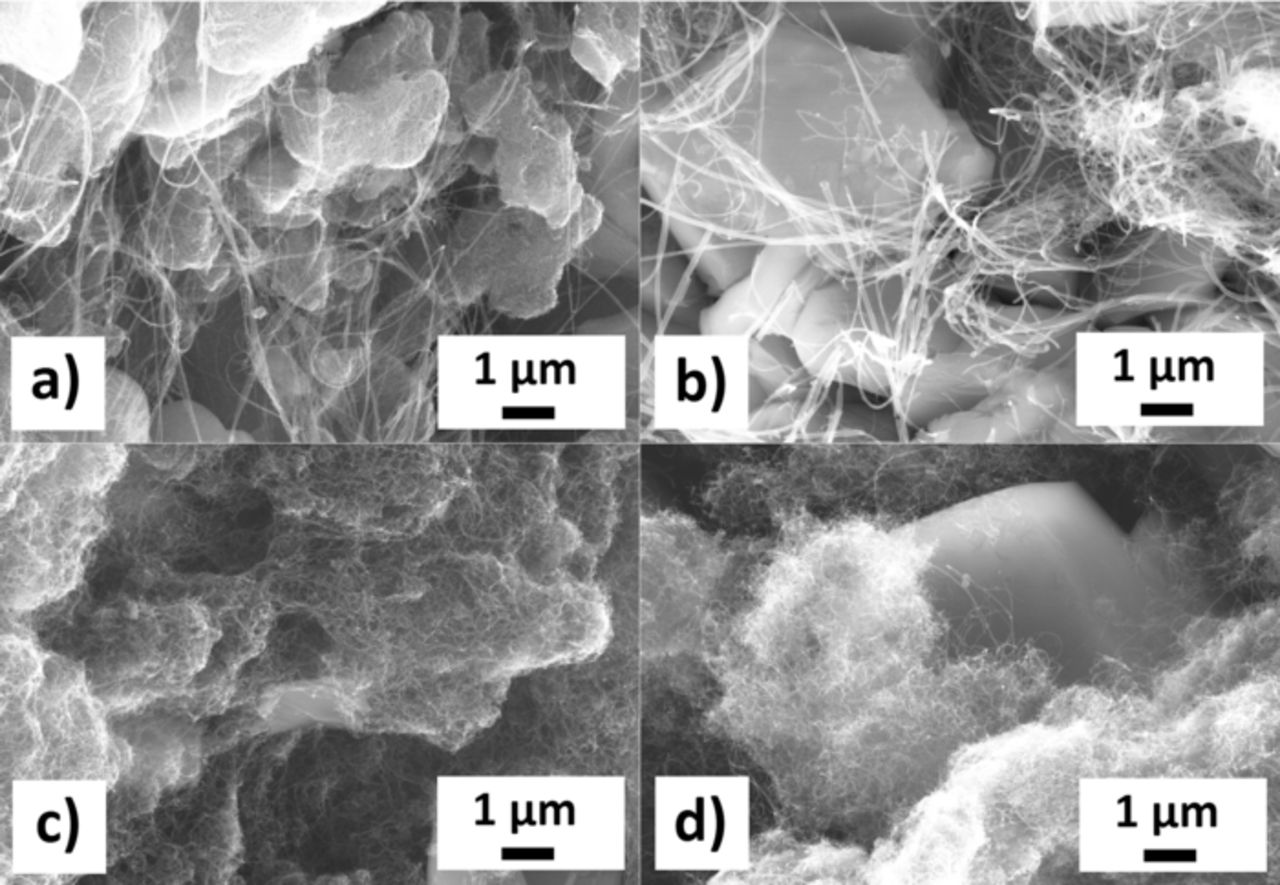
The SEM investigations of the composites revealed generally a homogeneous distribution of the carbon nanotubes among the Cu3B2O6 particles (Fig. 1, Fig. 2). The size of the particles is around 5 μm. Further reduction of the size through milling was not possible due to a mechanically induced decomposition of the compound.
Figure 1. SEM images of the 10% w/w CNT-Cu3B2O6 composites prepared in a polar solvent (water): SW/DW a), MW Ac b), MW no-HT c), MW HT d). Agglomeration and decomposition of the nanotubes is very pronounced – compare with Fig. 2.
Figure 2. SEM images of the 10% w/w CNT-Cu3B2O6 composites prepared in the nonpolar solvent n-heptane: SW/DW a), MW Ac b), MW no-HT, c) MW HT d). The network of long and thin CNTs is uniformly distributed among the crystals.
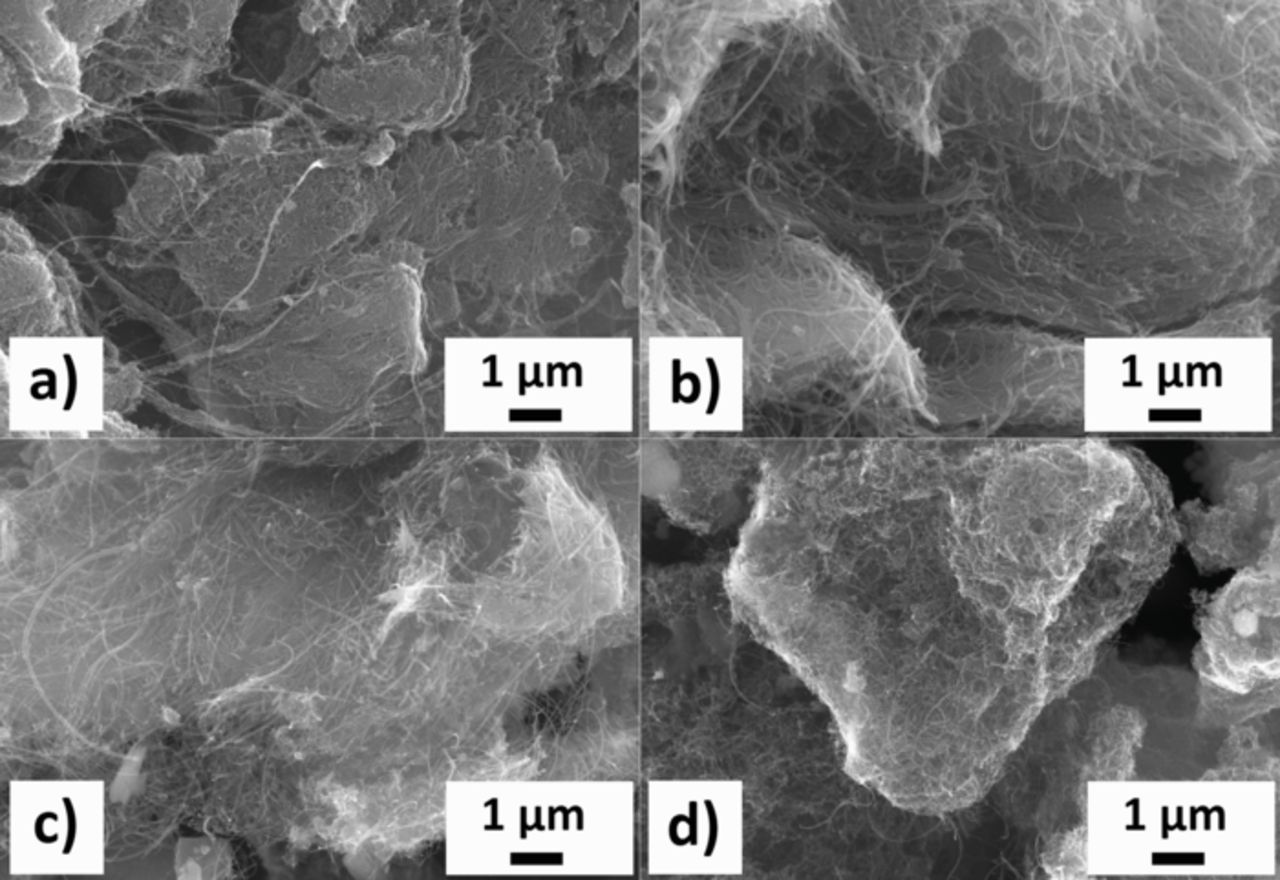
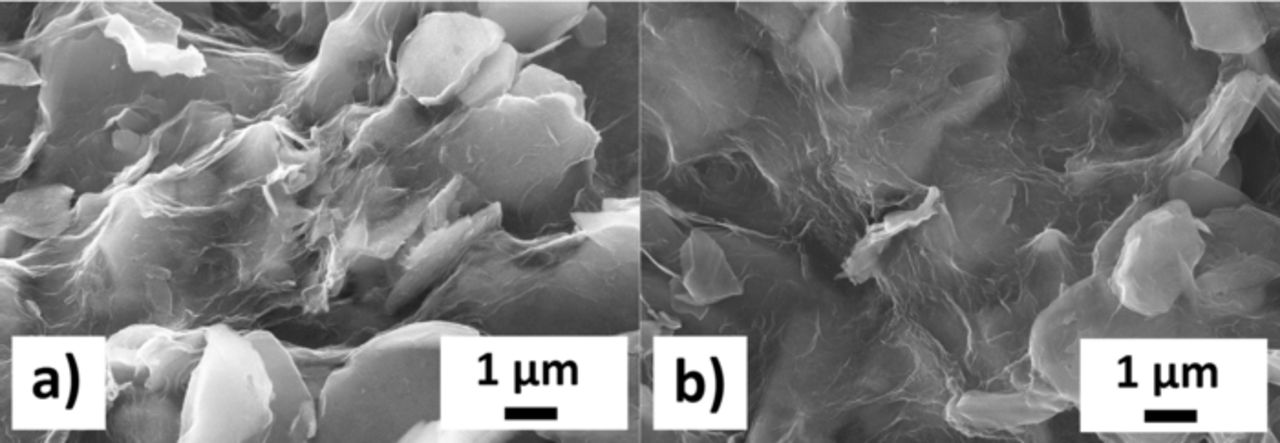
The CNTs in the composites prepared in bi-distilled water have a tendency to agglomerate and show features which look like a partial decomposition (Fig. 1). A compromise between a good distribution of the CNTs among Cu3B2O6 particles in the resulting composite material and a minimization of the agglomeration of the CNTs was achieved with an ultrasonication time set to 30 min. The ultrasonication in the nonpolar medium n-heptane did not show any features of these effects mentioned above for water as solvent (Fig. 2). The investigation of the RGO-composite shows (Fig. 4a) that the reduced graphene oxide flakes have wrapped the Cu3B2O6 particles during stirring. This assures a large contact interface between the conductive network and the electrochemically active material. The electrode materials were checked by SEM again after 30 charge/discharge cycles (Fig. 3, Fig. 4b) between 1.0 V and 4.5 V with a C/10 rate (8.69 mA g−1).
Figure 3. SEM images of the 10% w/w CNT-Cu3B2O6 composites prepared in the nonpolar solvent n-heptane, after 30 charge/discharge cycles with 8.69 mA/g (C/10) current: SW/DW a), MW Ac b), MW no-HT, c) MW HT d). No degradation of CNTs is observed.
Figure 4. SEM images of the 10% w/w RGO-Cu3B2O6 composite prepared in NMP solvent a), after 30 charge/discharge cycles with 8.69 mA/g (C/10) current b).
The agglomeration effect in the case of the water solvent-treated material, can be explained by the hydrophobic surface of the carbon nanotubes. The decomposition can be attributed to the rapid collapse of cavitated bubbles in the cavitation process induced by ultrasonication.20–23 The process depends on many factors including the specific solvent, solvent's viscosity, surface tension, vapor pressure, gas solubility, and the type of active intermediates or radicals formed.24,25 Despite of these numerous relevant parameters, a clear influence of water-treated CNTs on the electrochemical performance of the composites was observed.
The carbon nanotubes show no visible decomposition after the cycling and maintain a homogenous distribution among the active material. The RGO sheets also do not show any significant degradation. In both cases, the conductive network should sustain the prolonged cycling.
Structural characterization of the composites
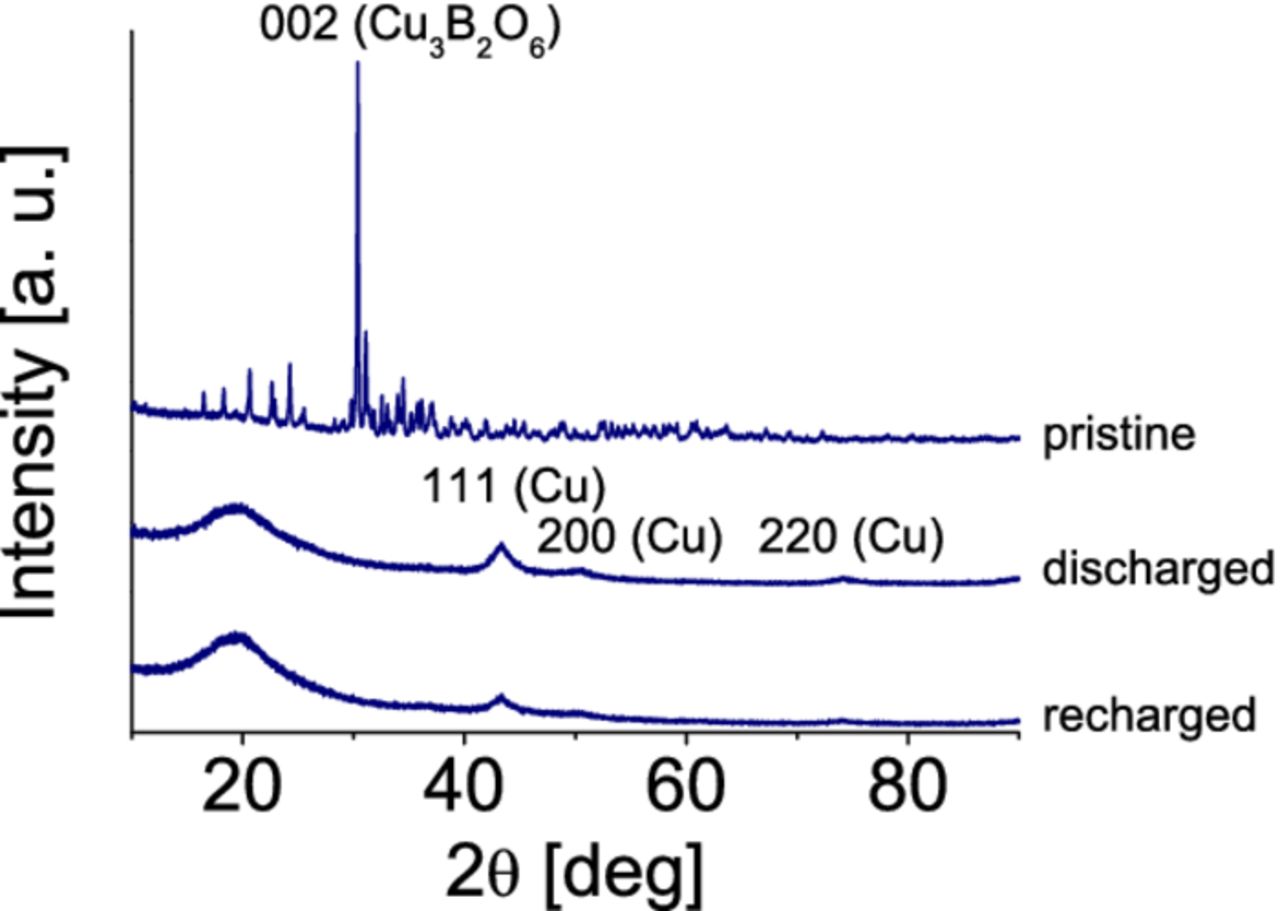
Structural features of the composites were investigated in different states of charge: pristine state, after discharge to 1.0 V, and after recharge to 4.5 V. The results are similar for the all composites. An example with 10% w/w SW/DW CNT-Cu3B2O6 is shown in Fig. 5. The initial Cu3B2O6 structure irreversibly decomposes to nanosized copper and amorphous products. In the recharged state, the amount of nanosized copper is much smaller. Structural transformations of the composites are similar to the ones reported for C/Cu3B2O6 in [4].
Figure 5. XRD patterns of 10% w/w SW/DW CNT-Cu3B2O6 electrode in different states of charge.
Electrochemical characteristic of the composites
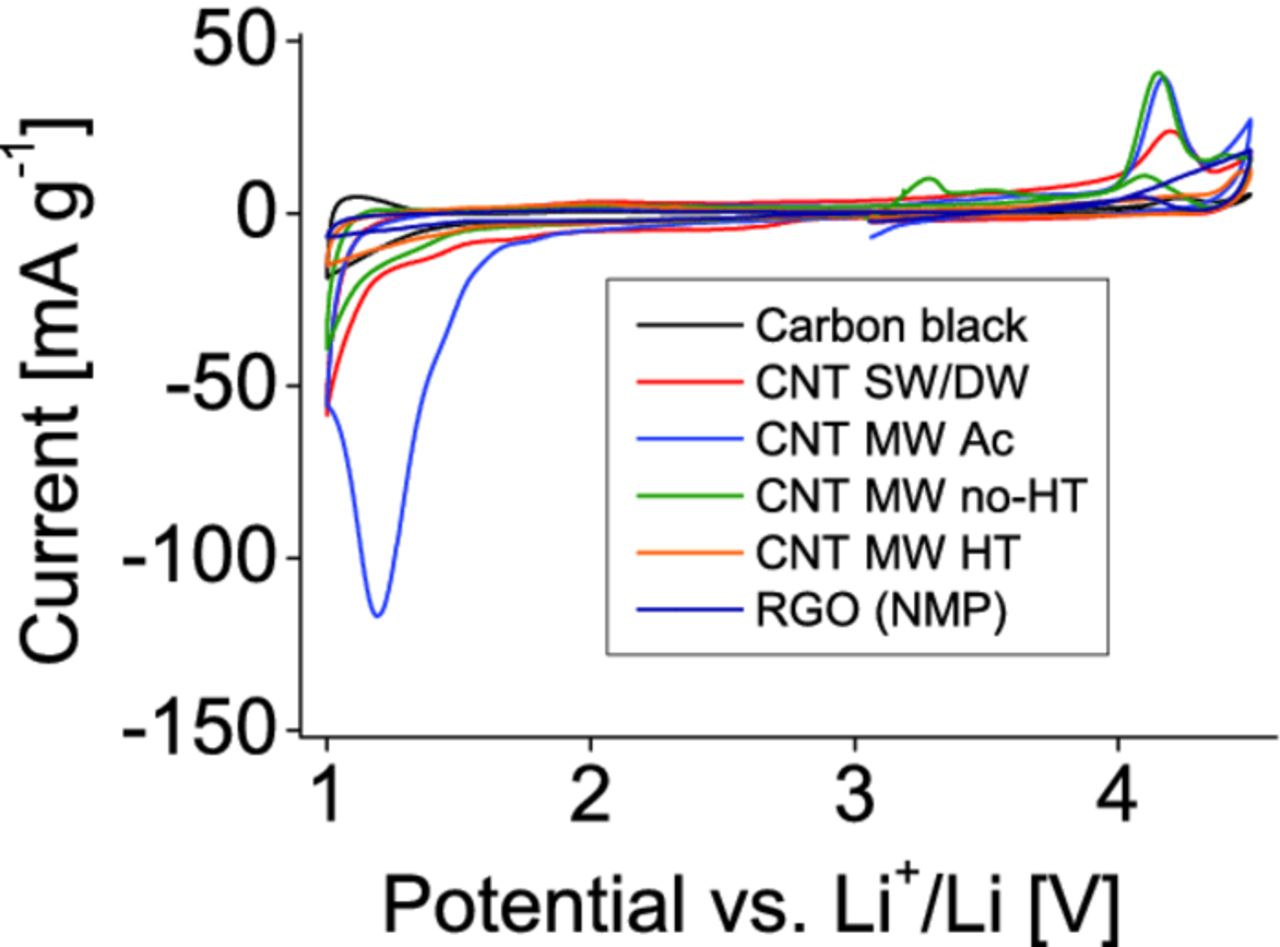
Before testing the electrochemical performance of the composite electrode materials in electrochemical cells, the carbon nanotubes and reduced graphene oxide were examined by cyclic voltammetry to check for any possible electrochemical side reactions and are compared with the results on composites with carbon black. The potential scan rate was set to 0.05 mV s−1. The electrodes included about 1 mg of the different conductive carbon species. The results presented in Fig. 6 show some oxidizing processes in the first cycle above 4.2 V, most pronounced for MW no-HT, MW Ac and SW/DW nanotubes. An interesting feature, a strong reduction peak, appears at 1.2 V for MW Ac CNTs. This peak disappears in the following cycles. No significant differences between carbon black and CNTs were found in further cycles.
Figure 6. Cyclic voltammetry (CV) profiles of various conductive agents: carbon black, the different carbon nanotubes, and the reduced graphene oxide, recorded with a rate of 0.05 mV/s.
The potential range of galvanostatic cycling experiments of the all CNT-composites was chosen between 1.0 V and 4.5 V, to include reactions with high overvoltages. It was shown [4] that within similar voltage window there is no indication of side reactions.
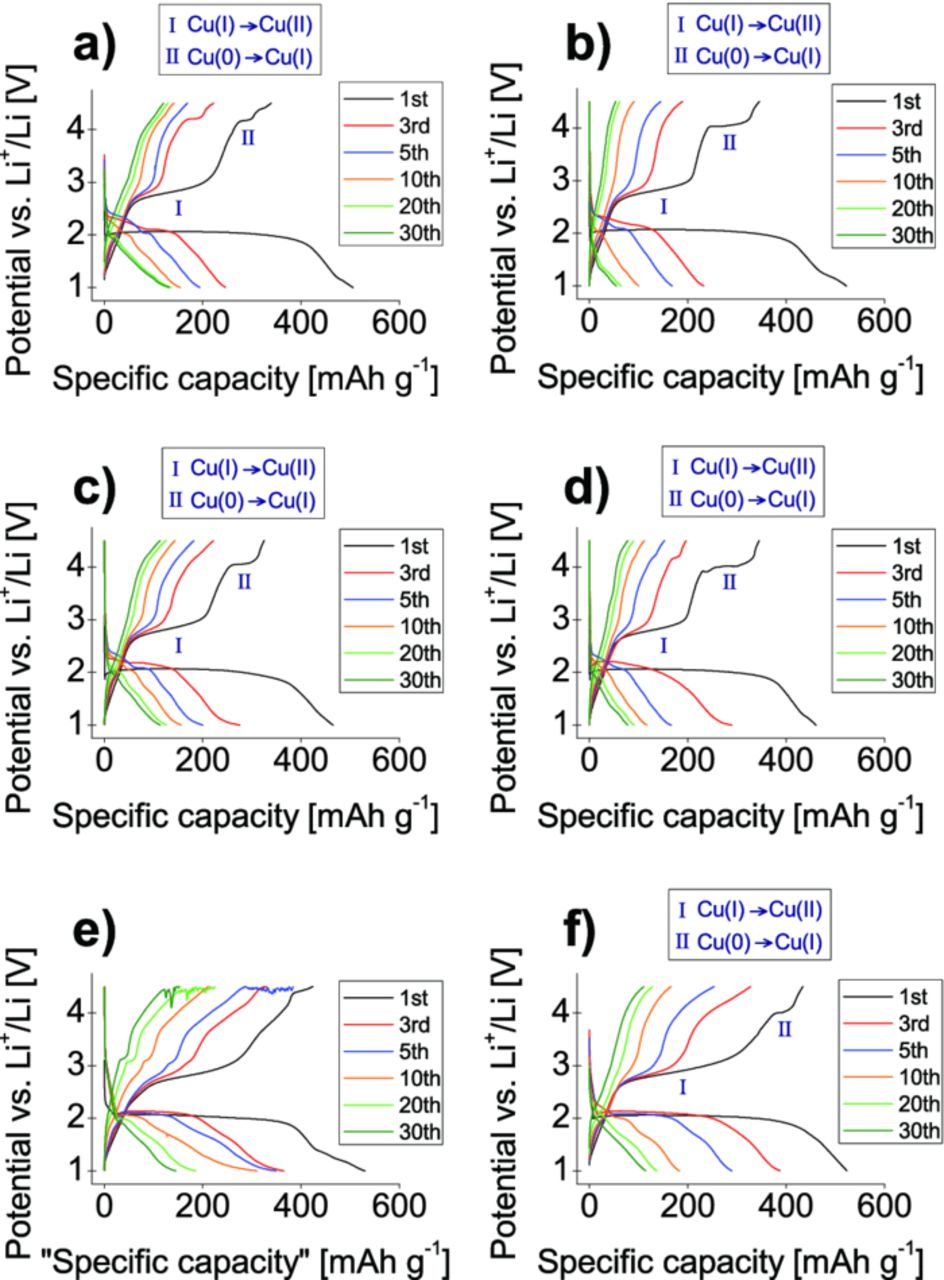
The electrochemical results of the galvanostatic cycling experiments of the all CNT-composites prepared in water, exhibit a pronounced presence of side reactions in the systems. In all these materials an ongoing oxidation is observed around the maximum potential, like it is show on the example of the composite with SW/DW CNTs in Fig. 7e. Most probably, this side reaction has destroyed a component of the cell and results in a poor cycle stability. The derived capacity values, despite many efforts, are not reproducible or only within a broad range as the envelope to the scattered data. These composites were not considered for further investigations.
Figure 7. Selected potential profiles of the: 10% w/w SW/DW CNT-Cu3B2O6 a), 10% w/w MW Ac CNT-Cu3B2O6 b), 10% w/w MW no-HT CNT-Cu3B2O6 c), 10% w/w MW HT CNT-Cu3B2O6 d) prepared in heptane; 10% w/w SW/DW CNT-Cu3B2O6 prepared in water e); 10% w/w RGO-Cu3B2O6 treated in N-Methyl-2-pyrrolidone solvent f). Two plateaus were marked at the first charging: at around 4.0 V which reflects Cu(I) to Cu(II) oxidation, and around 2.7 V of oxidation Cu(0) to Cu(I). The imposed current was set to 8.69 mA/g (C/10).
In the CNT- composites prepared in n-heptane (Fig. 7a–7d) and RGO-composite prepared in NMP (Fig. 7f), a plateau at the potential of 4.0 V is observed as a new feature in comparison with the standard mixture with amorphous carbon and composites prepared in polar solvent.
This plateau gives evidence for the copper oxidation from Cu(I) to Cu(II), further confirmed by XPS studies. Oxidation at such high voltage points to a huge overpotential which was not reported before. The existence of large potential hystereses is known for other conversion systems, but its origin has not been analyzed so far.26 The other oxidation plateau at around 2.8 V corresponds to the oxidation of Cu(0) to Cu(I).4 While both redox plateaus are visible in the first cycles, they are smeared out for higher cycle numbers. This effect was already reported in other conversion27 and even intercalation materials.28 After the conversion reaction, the surface area of the electrochemically active domains greatly increases and reacts at slightly different energies than in the bulk.26,29
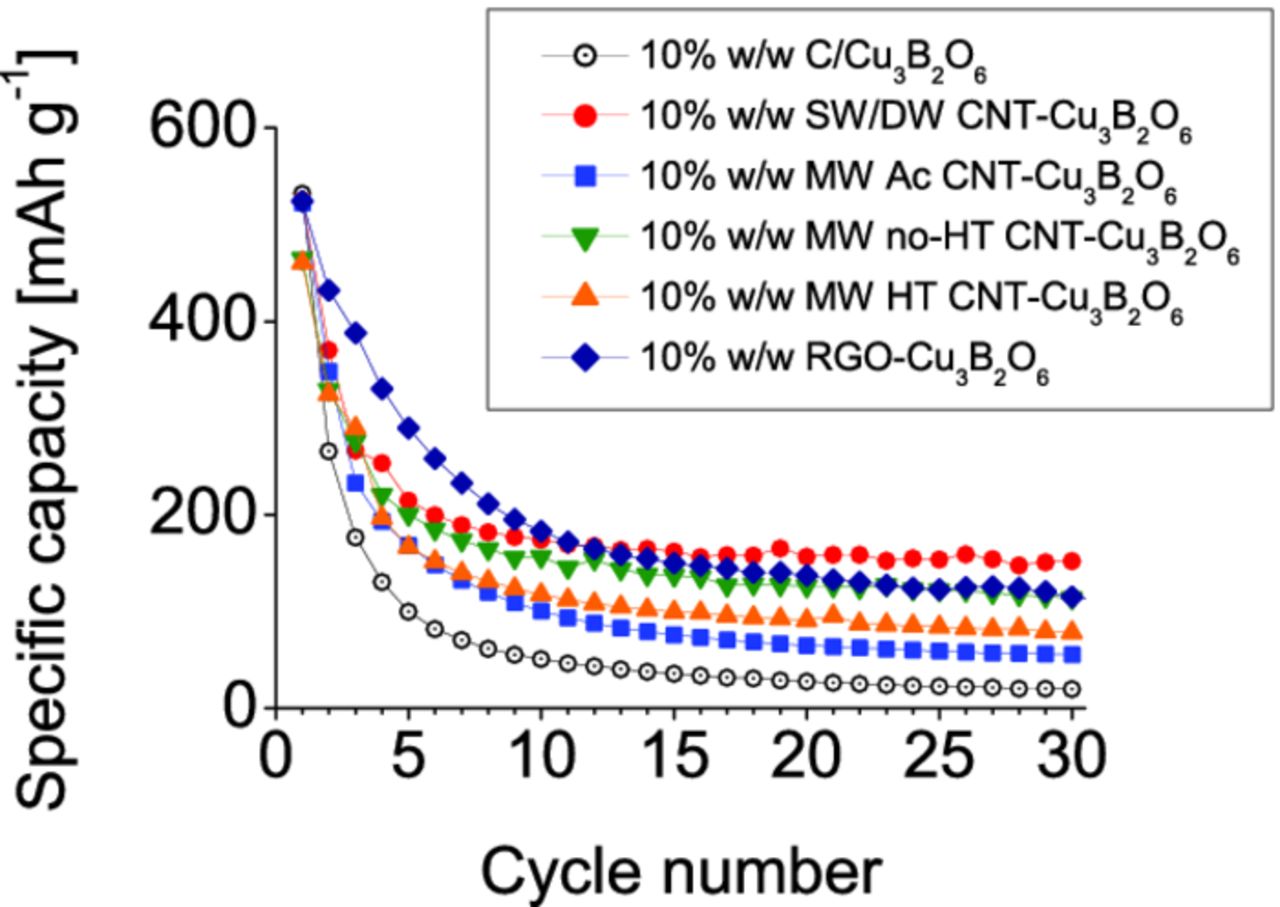
The obtained specific capacities, presented in Fig. 8, were compared to the conventional electrode mixture consisting of Cu3B2O6 and carbon black.4 After 30 cycles the reversible capacity of SW/DW CNT-Cu3B2O6 composite is 152 mAh g−1, what is equivalent to 29.2% of the initial specific charge capacity. It is much higher than 20 mAh g−1 (only 3.8% of the initial capacity) for the standard mixture of Cu3B2O6 with 10% w/w carbon black. The specific capacities of the other composites are: 55 mAh g−1 (10.6% init. cap.) for MW Ac CNT-Cu3B2O6 composite, 114 mAh g−1 (21.8% init. cap.) for MW no-HT CNT-Cu3B2O6 composite, 78 mAh g−1 (15.0% init. cap.) for MW HT CNT-Cu3B2O6 composite, and 111 mAh g−1 (21.4% of the initial capacity) for RGO-Cu3B2O6 composite.
Figure 8. Specific capacities (C/10) of the 10% w/w CNT composites prepared in n-heptane together with the conventional electrode mixture containing 10% w/w carbon black.
The all composites, show better cycling performance and retain more capacity for up to 30 cycles than the standard mixture with carbon black. The composite SW/DW CNT-Cu3B2O6 has the highest capacity retention among the all investigated materials.
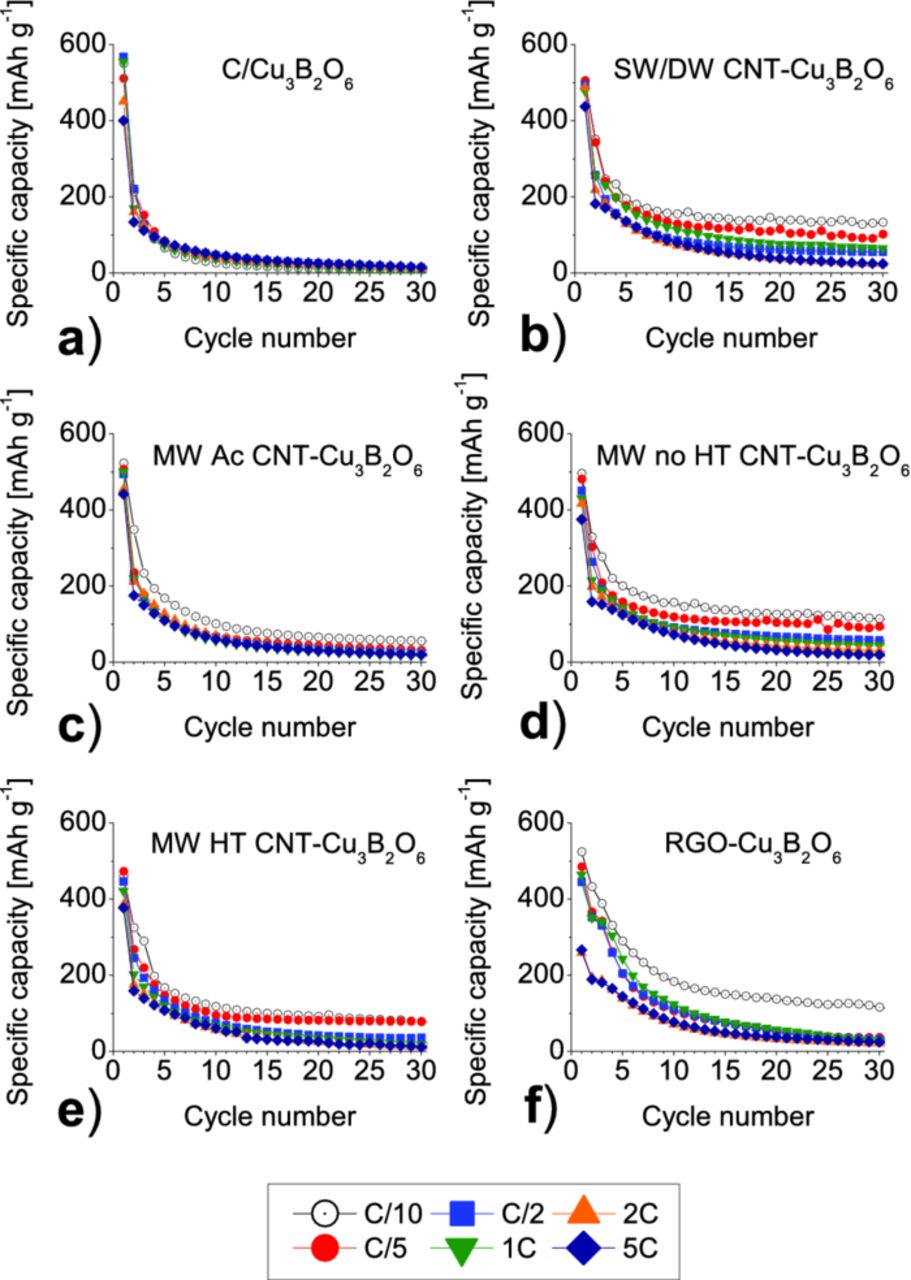
Figure 9 shows the capacities as function of cycle number at different discharge rates: C/10 rate (8.69 mA g−1), C/5 (17.38 mA g−1), C/2 (43.45 mA g−1), 1 C (86.9 mA g−1), 2 C (173.8 mA g−1), 5 C (434.5 mA g−1). It can be seen that higher currents cause a drop of capacities for all composites.
Figure 9. Capacity vs. cycle number of 10% w/w C/Cu3B2O6 a), and 10% w/w SW/DW CNT- b), 10% w/w MW Ac CNT- c), 10% w/w MW no HT CNT- d), 10% w/w MW HT CNT- e), 10% w/w RGO- composite f) prepared in heptane, at different current rates.
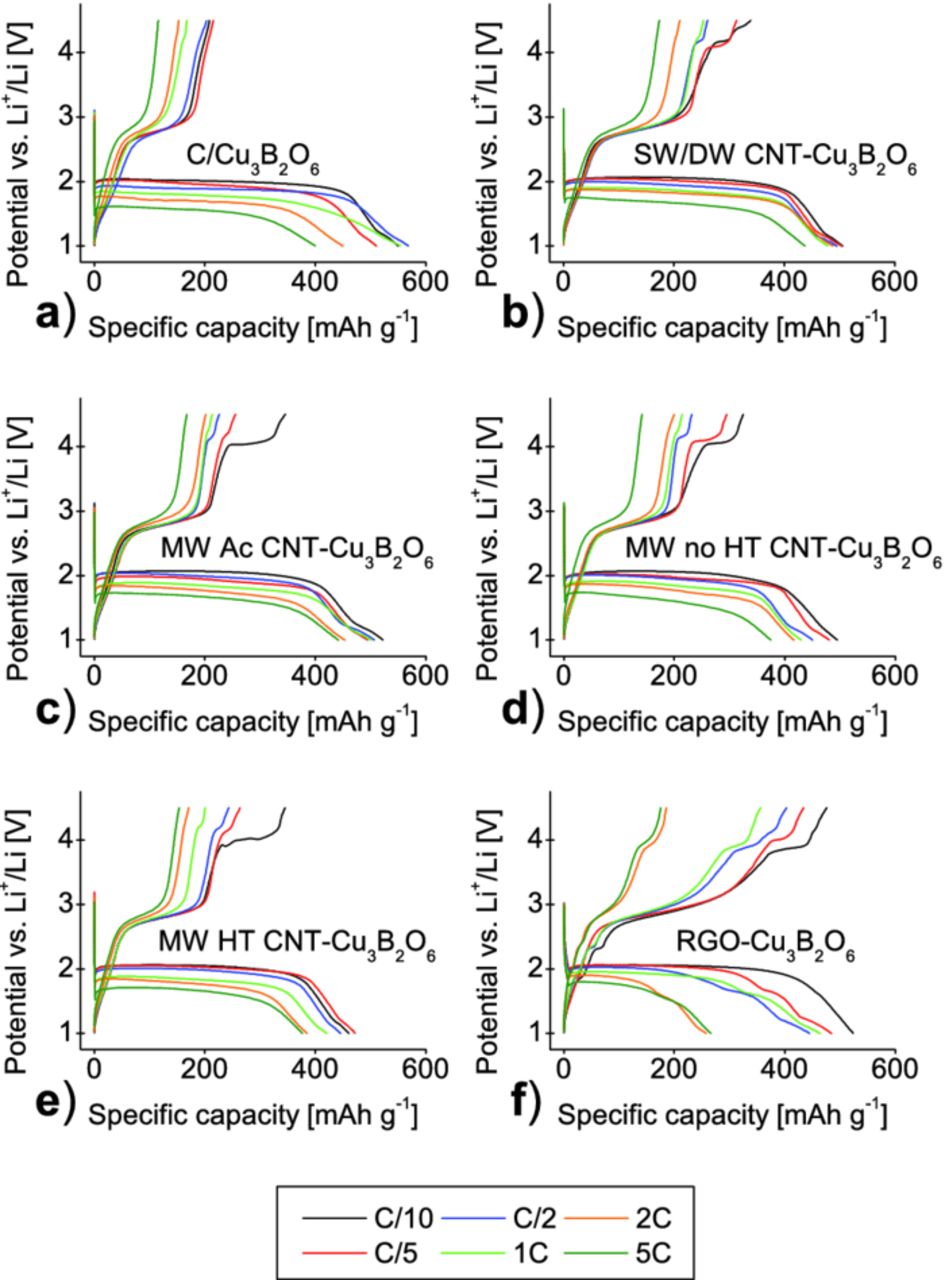
In Figure 10, the voltage profile at the first cycle is plotted against the capacity for each sample. An increase of the current rates results in a decrease of the capacity as well as in a drop in the discharge voltage plateau. In addition, the different C-rates have a major effect on the appearance of the second oxidation plateau at around 4.0 V. The dependence is related to the type of carbon additive used. It seems that the second plateau appears at high currents only for the RGO- composite. Nevertheless, the capacity drops considerably in comparison with CNT- composites, what suggests that the diffusion kinetics of lithium ions is worse in the RGO-composite.
Figure 10. Capacity-voltage profiles of the first cycle of 10% w/w Cu3B2O6 carbon mixture a), and 10% w/w SW/DW CNT- b), 10% w/w MW Ac CNT- c), 10% w/w MW no HT CNT- d), 10% w/w MW HT CNT- e), 10% w/w RGO- composite f) prepared in heptane at different current rates.
XPS characterization of the SW/DW-Cu3B2O6 composite material
The material with the best electrochemical performance, SW/DW CNT-Cu3B2O6 composite prepared in n-heptane, was chosen for the XPS studies to reveal the evolution of the copper oxidation states during cycling. A detailed XPS study of the standard electrode mixture C/Cu3B2O6 was described in.4 Here, the focus was set only at the chemical state of Cu after the first cell charge up to 4.5 V.
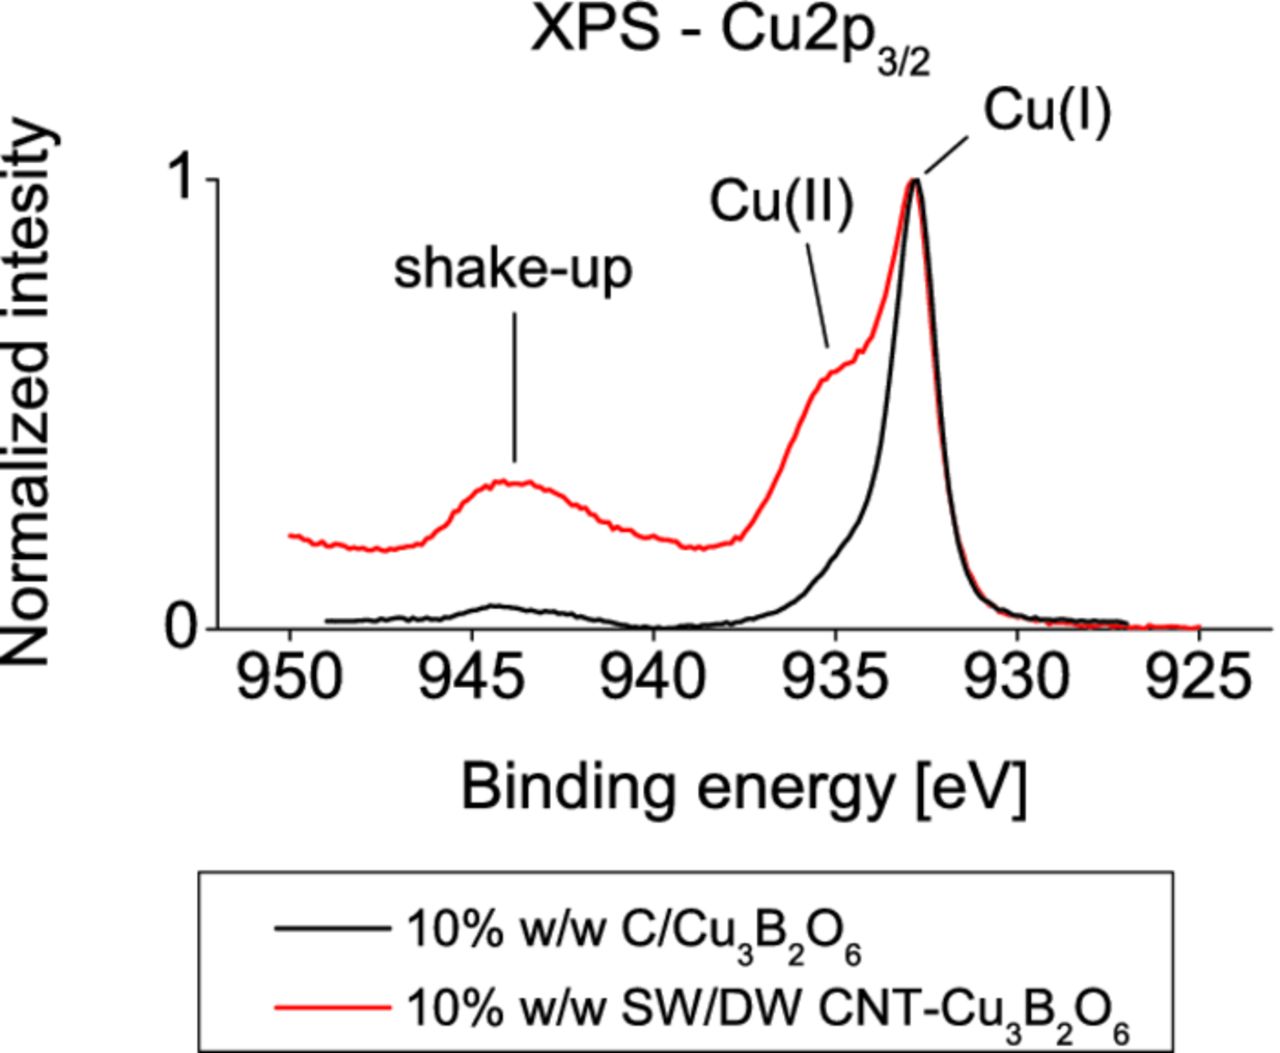
The spectrum (Fig. 11) shows that the copper exists in the mixed Cu(II)/Cu(I) valence state (two peaks: at 935 eV and 933 eV respectively). The Cu(II)/Cu(I) ratio is significantly higher than in the standard mixture with carbon black, where no Cu(II) was detected in the electrochemically reoxidized state4 (933 eV). It proves that the usage of the right conductive agent can decrease the overpotential of the inaccessible (in the carbon mixture) oxidation to Cu(II) valence state, at least for the first few cycles, what translates to higher capacity of the active material.
Figure 11. Normalized XP spectra of the Cu2p3/2 emission region in the SW/DW CNT-Cu3B2O6 composite, the C/Cu3B2O6 mixture, both after the first cell charge up to 4.5 V in the GCPL experiment.
Electrochemical impedance spectroscopy measurements
Electrochemical impedance spectroscopy (EIS) was carried out using a sinusoidal voltage signal with the amplitude of 5 mV in frequency region of 10−2 – 105 Hz. Every EIS measurement was preceded with an one hour of relaxation time. In the tested electrodes with the copper borate, four different conductive agents were used: carbon black, reduced graphene oxide, SW/DW, and MW no-HT carbon nanotubes, in amount of 10% w/w per electrode. The electrodes were prepared with the same weights of electrode material and with the similar surface area.
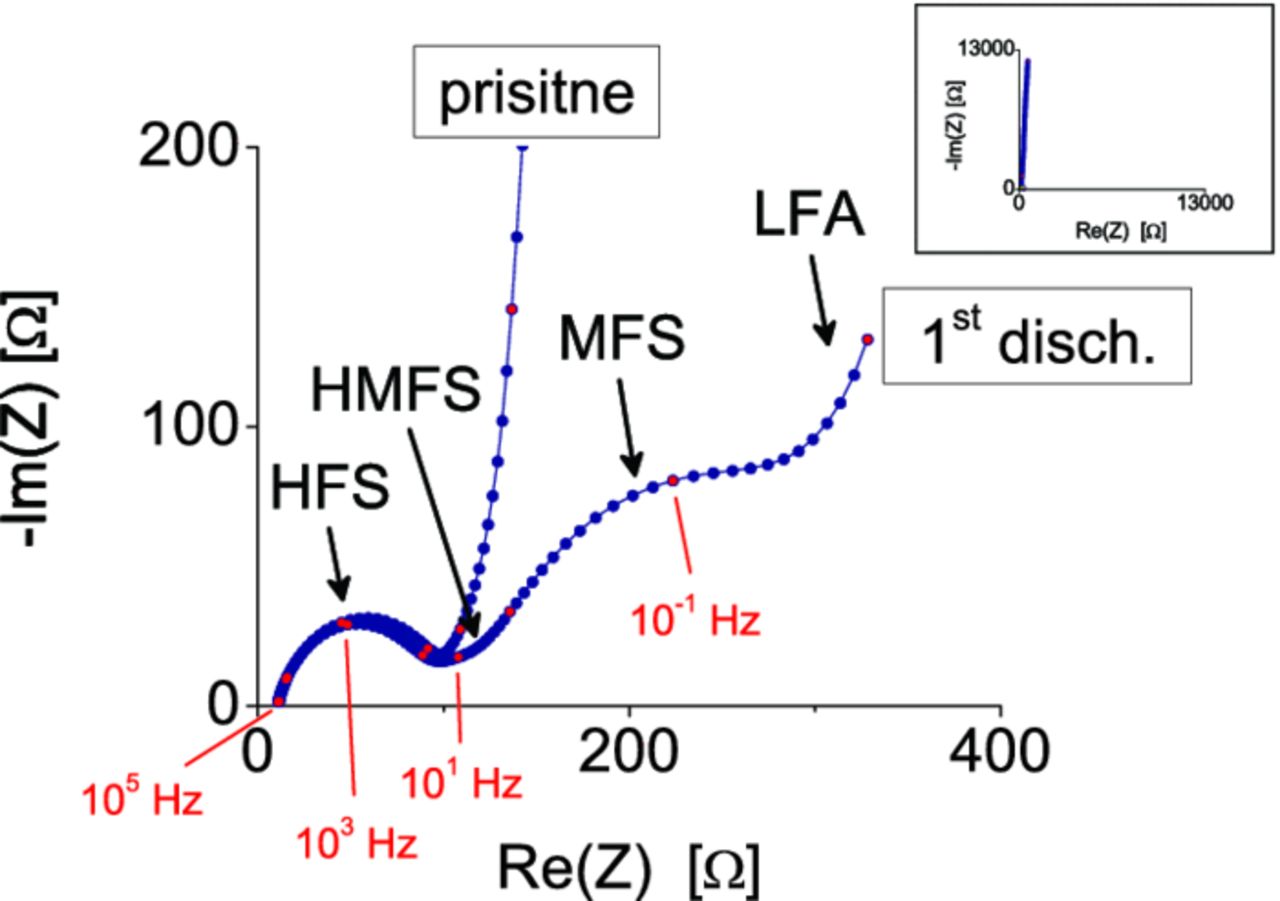
In the Fig. 12, a Nyquist plots of C/Cu3B2O6 at pristine state at 3.0 V, and after discharge to 1.0 V are shown. In the high frequency range (>102 Hz) a semicircle is present (HFS). It shows that the SEI is formed already after the contact with the electrolyte through spontaneous reactions without any applied voltage, and it does not change significantly after the first discharge. At the pristine state, the lower frequency is dominated by an inclined line which represents the blocking character of the nonlithiated electrode. The lithiation causes the inclined line to bend down and reveal three more overlapped elements: a small semicircle in the high to middle frequency (HMFS), a medium frequency semicircle (MFS), and a low frequency arc (LFA). The order of magnitude of the derived time constants is 10−4 s, 10−2-10−1 s, 100 s and 102 s for HFS, HMFS, MFS, LFA, respectively. The Nyquist shapes of the first discharge process slightly change between the composites and the presented carbon mixture. However, in the all cases, the initial conversion cause the emerging of the three mentioned elements.
Figure 12. Nyquist plot of C/Cu3B2O6 in pristine state (3.0 V) and after the first discharge (down to 1.0 V). The frequency dependence of the complex impedance can be described with four successive semicircles.
The specific selection of an EIS model for conversion materials is a nontrivial and not unambiguous task, mainly due to complex dynamic processes and the ongoing structural transformations and degradation of the material. It needs to be emphasized that the interpretation of the impedance response of a conversion material is significantly different than of a typical intercalation material, what is described in detail in work.30,31 The main difference between an intercalation and a conversion system is that the active material, like in this case Cu3B2O6, is an electronic insulator with a large bandgap, and the electrochemical reactions can only occur in the contact area with the conductive agent. This is the reason why a good electrical contact is one of the most important issues in conversion electrodes. Such interface between the insulating active material and the conducive agent behaves as a Schottky contact through which electrons are tunneled. The magnitude of the Schottky barrier reflects effective electronic resistivity at the contact area.
To our knowledge, the presence of the small HMFS has never been reported before for conversion materials. It is possible that it is a response of the contact between the active material and the current collector.30,32 The magnitude of this semicircle remains constant during the initial discharge. As authors have proven in their works,30,31 it is expected that the initial conversion reaction will increase the Schottky barrier between the conductive agent and active material due to alternation of contact media. Such behavior is observed for the MFS where its R-value slightly increases during the discharge, hence this semicircle is assigned to the Schottky contact.
By taking into account the mentioned effects, a following EIS model is proposed.
The diffusion of Li-ions through the electrolyte and their interaction with the ligands of the electrolyte gives mainly the ohmic resistivity of the electrolyte (denoted as R0 on the equivalent circuit in Fig. 13), other frequency independent contributions without phase shift are also summarized in R0. The migration of lithium ions through the solid-electrolyte interface (SEI) gives information in a form of a semicircle in the high frequency region about the resistivity of the SEI film coupled with SEI film capacitance (represented in the equivalent circuit, by the constant phase element Q1, and R1 respectively). The HMFS was described by Q2, R2 parameters. The MFS assigned to the active material/conductive agent Schottky contact is represented by Q3 and R3. The low frequency arc (described by Q4 and R4 in the equivalent circuit) represents the double layer capacitance coupled with the charge-transfer resistivity, which acts close to the carbon conductive network. This model allows to provide information about the electronic and ionic transport properties on one hand, and their changes during capacity losses with ongoing cycling on the other.
Figure 13. Equivalent circuit of impedance for the test cells. The meaning of the circuit elements is explained in the text.
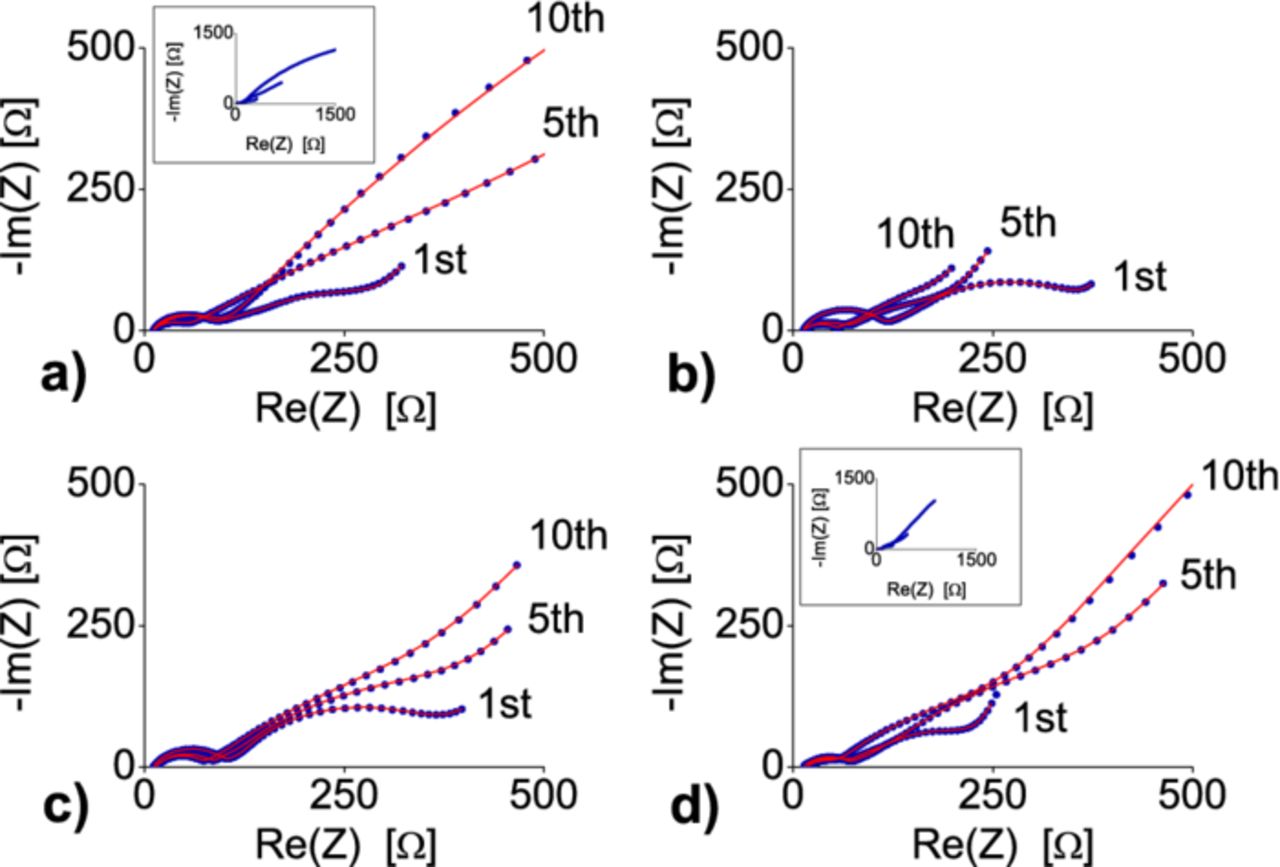
The impedance behavior of the materials was fitted according to the mentioned model using the ZFit program.33 The impedance spectra change considerably for higher cycle numbers, but with a different characteristic for every sample (Fig. 14). The semicircles were identified by deriving their time constants.
Figure 14. Nyquist plots of selected cycles of the C/Cu3B2O6 electrode a), SW/DW CNT- Cu3B2O6 electrode b), no-HT CNT- Cu3B2O6 electrode c), RGO- Cu3B2O6 electrode d). The experiments were performed in the discharged states down to 1 V and after 1 h of relaxation. The red lines are obtained from the best fits with the equivalent circuit from Fig. 13.
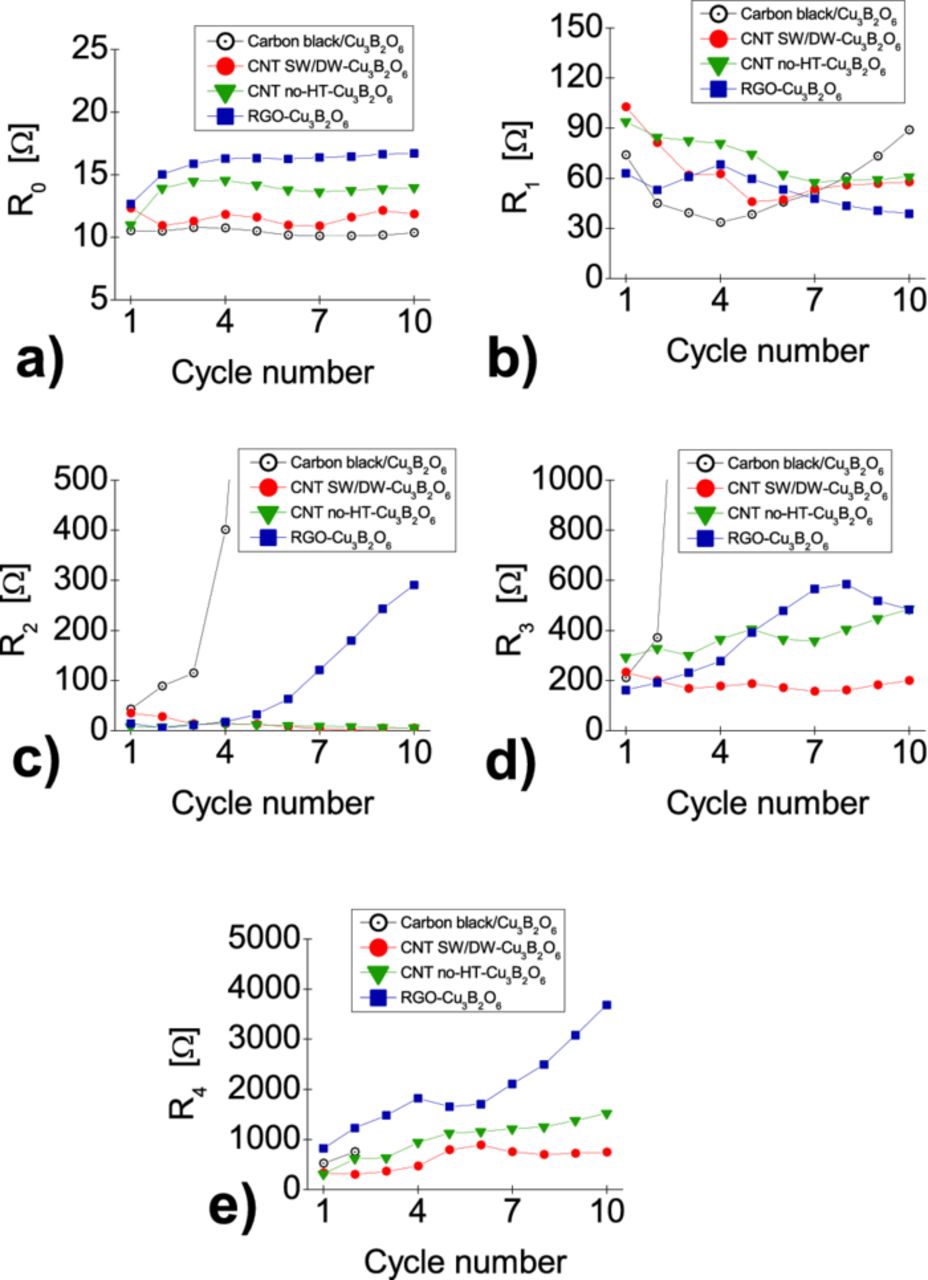
The resistivities R0, ...R4 derived from the fits are presented in Fig. 15. The ohmic resistivity R0, mainly determined by the electrolyte, (Fig. 15a) is stable during the cycling for all composites as expected. It seems that the resistivity R1 of the SEI film (Fig. 15b) in the composite with amorphous carbon increases faster than with the different CNTs, what suggests various rates of ongoing formation of LiF during cycling.4 The R2 values (Fig. 15c) are negligible for the CNT-composites. However, in the carbon mixture the semicircle starts to grow rapidly after four cycles to relatively high values. Therefore, the HMFS may not only correspond to the resistivity between the active material and the current collector, but it can be overlapped by other processes which have a similar time constant. After a few cycles, the all three semicircles merge into one and their parameters could not be reliably separated. The R3 resistivity (Fig. 15d), which describe the Schottky contact at the conductive agent/active material interface area, slightly goes up for the RGO- and MW no-HT CNT-composites. In the case of the SW/DW CNT-composite, this resistivity is not only lower in the initial cycle, but also remains low in the following cycles. This is a good evidence, that the use of SW/DW carbon nanotubes as conductive network is the best choice to enhance the electronic properties at the interfaces within the different investigated composites. Finally, the R4 values (see Fig. 15e) increase upon cycling with a different rate for each material. It means that the transfer resistivity increases causing reduction of Cu+ to Cu0 more difficult. Again, the lowest values are observed for the SW/DW CNT composite.
Figure 15. The values of the resistivity parameters obtained from the fits: R0 (mainly the ohmic resistivity of the electrolyte) a), R1 (resistivity of the SEI film) b), R2 (resistivity of the contact area with the current collector) c), R3 (electronic resistivity on the contact area between the conductive agent and the active material) d), R4 (charge-transfer resistivity) e).
The combination of all resistivities affects the transport behavior and the electrochemical performance of the investigated electrode materials. The rapid drop of the capacity in C/Cu3B2O6 mixture seems to be related directly to the high electronic resistivity at the interface between the carbon particles and the active material. The conversion process causes a loss of contact between the active material and the conductive network based on the amorphous carbon. This also influences the charge-transfer resistivity. The active material in the composites exhibits better contact with the conductive network based on the carbon nanotubes and reduced graphene oxide.
Conclusions
The electrochemical properties of Cu3B2O6-based electrode material modified by using different kinds of carbon nanotubes or reduced graphene oxide, were studied. The RGO- and CNT-modified Cu3B2O6 composites show an improvement of the specific capacity and capacity retention, depending on the specific type of carbon nanotubes and solvent used. The reversible capacities not higher than one third of the initial capacity after 30 cycles are observed. The highest specific capacity (152 mAh g−1) is found for the composition with SW/DW CNTs prepared in n-heptane solvent, followed by RGO-Cu3B2O6 composite (111 mAh g−1).
All CNT-composites prepared in the non-polar solvent show a rather stable behavior upon cycling after about 5 to 10 cycles. Probably, some initial cycles are needed to complete the conversion reaction and to establish a stable electrode. The level of stable performance depends strongly on the details of the electronically conducting carbon network.
The interpretation of the impedance spectra according to the presented model, reveals that the CNTs or RGO in the composites stabilize the charge-transfer resistivity of the solid-electrolyte interface. Moreover, the resistivity of the Schottky contacts can be reduced by more than three times after the first ten cycles for both CNTs- and RGO-containing composites in comparison to the standard mixture C/Cu3B2O6. The best bulk charge transport properties were obtained for the SW/DW CNT-Cu3B2O6 composite.
The improvement of the electronic properties of the composites decreased the overpotential to the range of stable working conditions of the used electrolyte. The overpotential is still relatively high, but the improvement allows the oxidation of copper not only to the Cu(I), but also to the Cu(II) valence state for the first few cycles for all composites.
The described improvement of the conversion model electrodes can be used for other conversion systems suitable for application.
Acknowledgments
Financial support from the European Union and the Free State of Saxonia in the framework of the European Center for Emerging Materials and Processes (ECEMP) is gratefully acknowledged, as well as a stipend within the DFG Research Collaborative Center 595 "Electrical Fatigue in Functional Materials".


